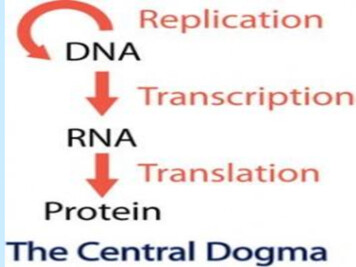
Transcription
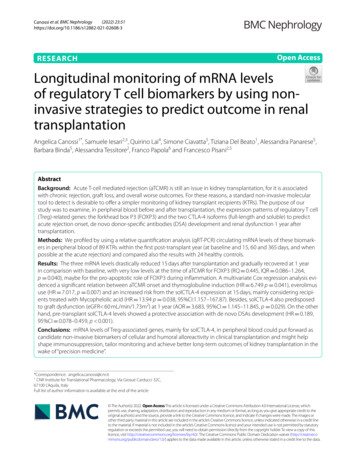
(2022) 23:51Canossi et al. BMC -3Open AccessRESEARCHLongitudinal monitoring of mRNA levelsof regulatory T cell biomarkers by using noninvasive strategies to predict outcome in renaltransplantationAngelica Canossi1*, Samuele Iesari2,3, Quirino Lai4, Simone Ciavatta5, Tiziana Del Beato1, Alessandra Panarese5,Barbara Binda5, Alessandra Tessitore2, Franco Papola6 and Francesco Pisani2,5AbstractBackground: Acute T-cell mediated rejection (aTCMR) is still an issue in kidney transplantation, for it is associatedwith chronic rejection, graft loss, and overall worse outcomes. For these reasons, a standard non-invasive moleculartool to detect is desirable to offer a simpler monitoring of kidney transplant recipients (KTRs). The purpose of ourstudy was to examine, in peripheral blood before and after transplantation, the expression patterns of regulatory T cell(Treg)-related genes: the forkhead box P3 (FOXP3) and the two CTLA-4 isoforms (full-length and soluble) to predictacute rejection onset, de novo donor-specific antibodies (DSA) development and renal dysfunction 1 year aftertransplantation.Methods: We profiled by using a relative quantification analysis (qRT-PCR) circulating mRNA levels of these biomarkers in peripheral blood of 89 KTRs within the first post-transplant year (at baseline and 15, 60 and 365 days, and whenpossible at the acute rejection) and compared also the results with 24 healthy controls.Results: The three mRNA levels drastically reduced 15 days after transplantation and gradually recovered at 1 yearin comparison with baseline, with very low levels at the time of aTCMR for FOXP3 (RQ 0.445, IQR 0.086–1.264,p 0.040), maybe for the pro-apoptotic role of FOXP3 during inflammation. A multivariate Cox regression analysis evidenced a significant relation between aTCMR onset and thymoglobuline induction (HR 6.749 p 0.041), everolimususe (HR 7.017, p 0.007) and an increased risk from the solCTLA-4 expression at 15 days, mainly considering recipients treated with Mycophelolic acid (HR 13.94 p 0.038, 95%CI:1.157–167.87). Besides, solCTLA-4 also predisposedto graft dysfunction (eGFR 60 mL/min/1.73m2) at 1 year (AOR 3.683, 95%CI 1.145–11.845, p 0.029). On the otherhand, pre-transplant solCTLA-4 levels showed a protective association with de novo DSAs development (HR 0.189,95%CI 0.078–0.459, p 0.001).Conclusions: mRNA levels of Treg-associated genes, mainly for solCTLA-4, in peripheral blood could put forward ascandidate non-invasive biomarkers of cellular and humoral alloreactivity in clinical transplantation and might helpshape immunosuppression, tailor monitoring and achieve better long-term outcomes of kidney transplantation in thewake of “precision medicine”.*Correspondence: angelica.canossi@cnr.it1CNR Institute for Translational Pharmacology, Via Giosuè Carducci 32C,67100 L’Aquila, ItalyFull list of author information is available at the end of the article The Author(s) 2022. Open Access This article is licensed under a Creative Commons Attribution 4.0 International License, whichpermits use, sharing, adaptation, distribution and reproduction in any medium or format, as long as you give appropriate credit to theoriginal author(s) and the source, provide a link to the Creative Commons licence, and indicate if changes were made. The images orother third party material in this article are included in the article’s Creative Commons licence, unless indicated otherwise in a credit lineto the material. If material is not included in the article’s Creative Commons licence and your intended use is not permitted by statutoryregulation or exceeds the permitted use, you will need to obtain permission directly from the copyright holder. To view a copy of thislicence, visit http:// creat iveco mmons. org/ licen ses/ by/4. 0/. The Creative Commons Public Domain Dedication waiver (http:// creat iveco mmons. org/ publi cdoma in/ zero/1. 0/) applies to the data made available in this article, unless otherwise stated in a credit line to the data.
Canossi et al. BMC Nephrology(2022) 23:51Page 2 of 20Keywords: CTLA-4, FOXP3, RT-PCR, Kidney transplantation, Cellular acute rejection, DSA development, GraftdysfunctionBackgroundT-cell mediated acute rejection (aTCMR) is still anissue in kidney transplantation for its association withchronic rejection, graft loss, and overall worse outcomes. In addition, immunosuppressive therapy bearsa risk of infection, malignancy and cardiovascular disease. For this reason, tailored immunosuppressionstrategies are useful to curb adverse events associatedwith kidney transplantation. Therefore, risk prediction and early diagnosis of aTCMR through non-invasive methods can be crucial for allograft survival andimmunosuppression management [1–4]. For thesereasons, developing a standard clinical and molecular assessment procedure offers a simpler monitoring of KTRs. The study of biomarkers of aTCMR andimmune dysregulation in renal transplantation hasprogressively focused on regulatory T cells (Tregs).This C D4 CD25 FOXP3 lymphocytic subpopulation,which spreads from the thymus as effector and memorysuppressive cells, is essential in suppressing alloimmuneresponse and maintaining tolerance in transplantationFOXP3 expression is the major determinant of Tregsphenotype and function. Another important markerrecently investigated in kidney transplantation andaTCMR is CTLA-4 (CD152). CTLA-4 is implicated inself-tolerance and acts as a braking co-inhibitor of activated C D4 and C D8 T cell responses. Tregs represent the principal cellular population expressing theCTLA-4 [5]. CTLA-4 is encoded by the homonymousgene located on chromosome 2 (2q33) in two transcripts in humans: a transmembrane isoform, resulting from the translation of all 4 exons of the gene (fulllength CTLA-4, flCTLA-4), and a truncated isoformof exon-3, encoding the transmembrane domain (soluble CTLA-4, solCTLA-4) following alternative splicing. The inhibitory function of CTLA-4 is carried outthrough several different mechanisms, comprehendingthe cell-extrinsic action of its soluble form responsiblefor competition with CD28, namely the CTLA-4 counterpart, which transduces instead a proliferation signalfor T cells [6–9].The purpose of our study was to develop a new noninvasive diagnostic tool, based on an accurate analysisof molecular FOXP3 and CTLA-4 mRNA expressionpattern in peripheral blood, during the first posttransplant year, capable to predict aTCMR onset, denovo DSA development and renal dysfunction. Fordoing this, we performed three different analyses: 1) aprospective longitudinal monitoring of mRNA levelsof FOXP3, flCTLA-4 and solCTLA-4 during the firstpost-transplant year; 2) a case-control study of KTRscompared to healthy controls for FOXP3 and 3) an evaluation of diagnostic power of the variables investigated.MethodsPopulationOne hundred and twenty-five patients consecutivelyunderwent kidney transplantation at the Organ Transplantation Unit of the Regional Hospital of L’Aquila,Italy during the period January 2011–September 2017.Of them, 120 (96%) received a kidney from a deceasedbrain donor and five (4%) from a living donor. Writteninformed consent was obtained from all participants.Investigations were carried out by the rules of the Declaration of Helsinki, and the institutional ethical committee approved the study (protocol no 0098164/2011). Outof the total KTRs, 89 met the inclusion criteria for thestudy consisting in: a) sufficient/pure mRNA collectedat least two of the four sample collection time-points; b)no steroid-resistant rejection. Twenty-four healthy blooddonors with comparable age, sex, and ethnicity volunteered as controls (all Caucasian subjects).KTRs were treated according to the local immunosuppression protocol. Induction therapy was carried out withbasiliximab (Simulect , Novartis, Basel, Switzerland)in 82 cases (92.1%), and with antithymocyte globulins(Thymoglobulin , Sanofi, Paris, France) in 7 cases (8.9%).Maintenance therapy comprised prednisone, a calcineurin inhibitor (CNI) (either tacrolimus [Advagraf ,Astellas Pharma, Tokyo, Japan], in 75 cases (84.3%), orcyclosporine [Neoral , Novartis] in 14 cases (15.7%), anda proliferation signal inhibitor. The latter consisted ofmycophenolic acid in 77 cases (86.5%), and everolimus(Certican , Novartis) in 12 cases (13.5%). Patients treatedwith everolimus were considered separately, given theeffect of this drug on an increased risk of aTCMR withinthe first postoperative year in this analysis.OutcomesGraft function was reported as estimated glomerular filtration rate (eGFR) [10]. When a filtrate rate was 60 mL/min/1.73m2 for 3 months or more, the patient was considered suffering from chronic renal failure.The diagnosis of acute rejection was biopsy-provenand we considered in the analysis only KTRs with acuteT-cell-mediated rejection (aTCMR), classified in the
Canossi et al. BMC Nephrology(2022) 23:51categories 3 and 4 of Banff ’15 classification [11]. Rejection treatment was based on three intravenous one-grammethylprednisolone boluses over 3 days.Screening for HLA antibody was performed by LambdaCell Tray T cell CDC-based Class-I PRA and LambdaAntigen Tray Mixed Class-I/II ELISA (One Lambda,Canoga Park, CA, USA). Detection of donor specificantibodies (DSA) was performed on T and B lymphocytes by cell-based assays (CDC-XM) and Luminex solidphase assays. Blood samples were collected at four timepoints (baseline, post-KTR day 15, 60, 365) and at thetime of a possible aTCMR. All patients were followed-upuntil 2 years minimum.RNA isolation and gene expression analysisPeripheral venous blood (3 ml) was drawn directly intoTempus Blood RNA tubes (Thermo Fisher ScientificInc., Waltham, MA-US), according to the manufacturer’sprotocol, frozen and stored at 20 C until processing.Whole blood total RNA was extracted using a Tempus Spin RNA isolation (Thermo Fisher Scientific Inc.),which uses an RNA isolation method (6–25 μg of RNA)with silica columns and an additional DNase treatment.The purity and concentration of this RNA were analysedusing an ultraviolet-visible (DU 530 spectrophotometer, Beckman Coulter Life Sciences, Brea, CA-US). Onemicrogram of total isolated RNA was employed for complementary DNA synthesis (cDNA) with the High Capacity cDNA Reverse Transcription kit (Applied Biosystems,Foster City, CA-US).Gene expression profiles of the three gene targets(FOXP3, flCTLA-4 and solCTLA-4) were analysedthrough a quantitative real-time (RT)-PCR (qRT-PCR, 2- CT method) using glyceraldehyde 3-phosphate dehydrogenase (GADPH) and β2 microglobulin (β2M),respectively, as internal control. The relative quantification analysis was estimated by using the cDNA frombaseline samples (pre-transplantation) to calibrate allthe three transcripts. One control blood sample was alsoused as reference for FOXP3 RT-PCR quantification.mRNA expression analysis was performed in duplicate/triplicate using predesigned TaqMan Gene Expression Assays (FOXP3: HS00203958-ml, GAPDH:HS99999905-ML, flCTLA-4: HS01011591-ml, solCTLA-4: HS03044419, β2M: HS00984230; Life Technologies, Monza, Italy) and a standard protocol. RT-PCRamplification was performed in 48-well plates on a StepOne Real Time PCR system (Applied Biosystems, CA,USA) and RQ were calculated using StepOne v.2.3 software for automated data analysis (Applied Biosystems).The comparison between the clinical subgroups of KTRs(i.e. aTCMR-free vs. aTCMR-positive patients) was normalized with the 2- CT logarithm 10 (log2- CT) comparedPage 3 of 20to the endogenous control, to correct the asymmetricdistribution of the data.Statistical analysisBinomial variables were reported using numbers andproportions. Numerical variables were reported usingmeans standard deviations (SD), or medians andinterquartile ranges (IQR), as appropriate. Gene levelsdistribution is shown as box- or scatter-plot representations. Results were compared using Fisher’s exact test orMann-Whitney U test/Wilcoxon. Comparison betweengroups and correlation between variables were examinedby parametric (t test/one-way ANOVA, Pearson’s correlation), and non-parametric tests (Kruskal Wallis, Friedman test for repeated measures and Spearman’s test), asappropriate.Receiver-operating characteristic (ROC) curves weregenerated for the prediction of short- and long-termaTCMR episodes, de novo DSA development and renaldysfunction after transplantation to define the accuracyof diagnostic test and establish the best cut-off for clinicaloutcomes.The predictive ability of several variables for the risk ofthe acute rejection, graft dysfunction and post-transplantdevelopment of DSA in our population was assessed. Allfactors considered in univariable analyses were based onliterature review and suggestions from the clinical team.Logistic regressions were run for simply dichotomousvariables. The crude odds ratios (OR), 95% confidenceinterval (CI) and p value were reported for each predictor in the univariable analysis. Only statistically significant variables in the univariable analysis were enteredinto multiple logistic regression analysis to predict thefinal independent factors. The model fit was assessed bychi-square, degrees of freedom and p-value. We chose abackward conditional method to select significant independent covariates.We used the Cox proportional hazards model for timedependent events (graft loss, death, acute rejection, denovo anti-DSA antibody development). All the covariateswith p 0.05 were introduced into multivariable models.Hazard ratios (HRs), and 95% confidence intervals (CIs)were reported for significant variables.The significance of statistical tests was taken at twotailed p 0.05. Analyses were run with SPSS Statistics v.13.0 (SPSS Inc., Chicago, IL), GraphPad Prism v.6(GraphPad Software, La Jolla, CA-US), and MedCalcv.19.2.0 (MedCalc Software Ltd., Ostend, Belgium).ResultsCharacteristics and follow‑up of the recipientsClinical features of the patients (n 89) transplantedbetween 2011 and 2017 are reported in Table 1. Mean
Canossi et al. BMC Nephrology(2022) 23:51Page 4 of 20Table 1 Demographic and clinical characteristics of the transplant study groupsVariablesFrequenciesN (%)Recipient gender:- males65 (73%)- females24 (27%)Recipient age (years, mean SD)52.5 11.5Donor age (years, mean SD)50.9 15.9Donor gender:- males59 (66%)- females30 (34%)Donor type:- brain-dead donors84 (94.3%)- living donors5 (5.7%)Time on RRT (months, mean SD)54.3 35.0RRT type:- haemodialysis74 (83.1%)- peritoneal dialysis15 (16.9%)No of HLA mismatches (median and IQR)3MM (1-5)Class I PRA (%, mean SD)4.4 11.1Class II PRA (%, mean SD)1.8 7.8CIT (minutes, mean SD)630 265WIT (minutes, mean SD)44 13Induction:- basiliximab82 (92%)- anti-thymocyte globulins (rATG)7 (8%)Calcineurin inhibitor:- cyclosporine14 (16%)- tacrolimus75 (84%)Proliferation signal inhibitor:- everolimus12 (13%)- mycophenolic acid77 (87%)CMV-positive donor/CMV-negative recipient11 (12.4%)Previous transplantation6 (6.7%)Delayed graft function32 (36%)Abbreviations: CIT cold ischaemia time, CMV cytomegalovirus, HLA human leukocyte antigen, IQR interquartile range, PRA panel-reactive antibodies, RRT renalreplacement therapy, SD standard deviation, WIT warm ischaemia timeage at transplant was 52.5 11.5 years. All patients had aminimum follow-up of 2 years (mean follow-up period:38.3 23.8 months).During the entire study period, three patients (3.4%)died: in all the cases, the cause of death was an infection. During the same period, six graft losses (6.7%)were reported. In four cases, an immunological causewas reported, namely a drug-resistant acute rejectionand a chronic active antibody-mediated rejection in twocases, respectively. In the remaining two cases, a graftthrombosis and a graft pyelonephritis were reported.Eighteen patients showed episodes of rejection duringthe follow-up period, sixteen had cellular or mixed acuterejections (cell and/or antibody-mediated rejections)and two showed chronic rejection episodes (mixed orAb-mediated).Seventy-three patients (82.0%) did not develop acuterejection. On the opposite, 16 patients (18.0%) exhibited at least one episode of aTCMR, of whom 11/16(68.8%) cases during the first year. The median time fromtransplantation to the first episode of aTCMR was 2.1(IQR 0.8–10.6) months in the 11 cases experiencing arejection within the 1st year from the transplant, while inthe entire population was 9.95 (IQR 1.05–15.7) months.Twenty-three KTRs in total (25.8%) developed DSAafter transplantation, 19 within the first year. In total,
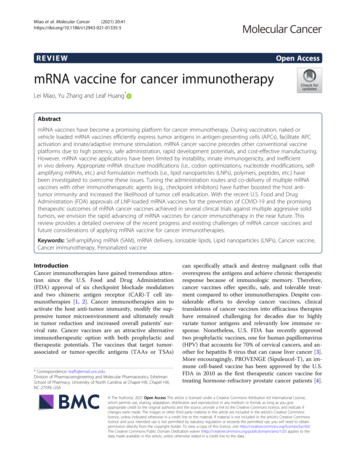
Canossi et al. BMC Nephrology(2022) 23:5117 (89.5%) cases presented DSAs reactive against HLAclass I, whereas eight (42.1%) against class-II. TheeGFR of KTRs in post-transplant period varied from amedian value of 42.6 (IQR 25.1–61.2) ml/min/1.73m2after 15 days, to 50.9 (IQR 32.1–65.8) at 60 days, 55.2(IQR 36.3–72.0) after 1 year from transplantation and58.1 (39.1–75.7) at last follow-up.Characteristics of the healthy controlsTwenty-four healthy blood donors enrolled for the studyshowed comparable characteristics respect to the population of transplanted patients. In detail, age (52.5 11.5 vs.52.8 12.5 years, p 0.920), gender (65 males [73.0%] and24 females [27.0%] vs. 14 males [58.3%] and 10 females[41.7%], p 0.250), and Caucasian ethnicity (89 [100.0%]vs. 24 [100.0%], p 1.000) were not statistically differentbetween KTRs and healthy controls, respectively.Longitudinal evaluation of flCTLA‑4, solCTLA‑4, and FOXP3mRNAs during the first year after transplantation (RT‑PCRreference: pre‑transplant)We compared the expression of CTLA-4 isoforms andFOXP3 before and across the first year after transplantation in all the 89 included KTRs compared tobaseline. We found a reduction in the expression ofall the candidate biomarkers after 15 days (flCTLA-4:Page 5 of 20RQ 0.638 0.433;solCTLA-4:RQ 0.724 0.752;FOXP3: RQ 0.623 0.915), a significant increase ofthe expression after 60 days for CTLA-4 isoforms (Wilcoxon signed rank test: flCTLA-4 p 0.042; solCTLA-4p 0.048) and, on the contrary, a slight decrease for FOXP3expression (RQ 0.561 0.391, p 0.991). After 1 year, therelative expression of all three markers partially recoveredto baseline levels. In case of rejection episode, flCTLA-4expression was the highest compared to the other twomolecules at the time of the adverse event (flCTLA-4:RQ 0.800 0.620,solCTLA-4:RQ 0.666 0.529,FOXP3: RQ 0.624 0.559, Kruskal Wallis test: p 0.763,Fig. 1).Longitudinal evaluation of FOXP3 expressionlevels depending on the type of maintenanceimmunosuppression (RT‑PCR reference: healthy controls)The trend of FOXP3 mRNA levels over time up to 1year after transplantation on all KTRs compared tohealthy controls followed that observed for CTLA-4isoforms and, by distinguishing the KTRs for immunosuppressive regimen, we observed that therewere no differences between recipients treated witheverolimus and recipients on mycophenolic acidfor the whole duration of the monitoring (Additional file 1: Fig. S1).Fig. 1 Time-related trend of mRNA levels of flCTLA-4, solCTLA-4, and FOXP3 (mean SD) in all KTRs in the post-transplant period compared tobaseline mRNA values. The expression levels were monitored at 15, 60 and 365 days, and at the moment of the ACR. A significant increase between15 days and 60 days was highlighted for CTLA-4 isoforms (flCTLA-4 RQ 0.895 0.798, *p 0.042, solCTLA-4 RQ 0.937 0.740, *p 0.048), whileFOXP3 slightly decreased. Later every marker reverted to baseline levels. In case of rejection episode, flCTLA-4 expression was the highest comparedto the other two molecules at the time of the adverse event
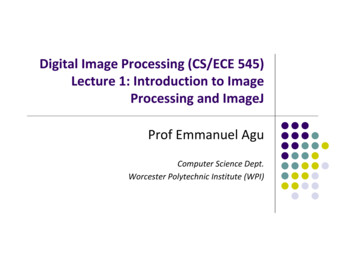
Canossi et al. BMC Nephrology(2022) 23:51Case‑control study of FOXP3 mRNA expressionbetween KTRs and healthy controlsFOXP3 expression profiles showed differences betweenKTRs and healthy controls. Controls had higher levels of mRNA compared to KTRs at baseline (controlsvs. aTCMR-free cases: median RQ 2.132 vs. 1.630,p 0.005; vs. aTCMR-positive cases: RQ 1.381,p 0.010). Distinguishing between the aTCMR-freeand -positive patients, despite of limited cohort, we evidenced a similar trend between two groups of patients,with an initial significant reduction in FOXP3 levels at15 days after transplantation and a gradual enhancementof expression up to 1 year, but always below baseline levels (Wilkoxon signed rank test p 0.001 and p 0.015),Friedman ANOVA test p 0.001. The expression ofFOXP3 at the time of acute rejection was the lowestwhen compared to baseline (median RQ 0.445, vs.Page 6 of 20aTCMR-free baseline RQ 1.630, p 0.040 or aTCMRpositive RQ 1.381, paired t test p 0.035, Fig. 2).Association between aTCMR onset and clinicalor molecular variablesWe examined several clinical variables along with themolecular targets to assess their predictive ability forthe cumulative risk of short- and long-term aTCMRafter transplantation. There were no significant differences between KTRs with and without aTCMR within1 year after transplantation concerning FOXP3 andthe flCTLA-4 isoforms (Fig. 3). Only solCTLA-4 levels showed a different trend after transplantation, withsignificant higher transcript levels 15 days after transplantation in cases with aTCMR, compared to aTCMRfree KTRs (log 0.365, IQR -0.073–0.648, vs. -0.070,IQR -0.440–0.280, p 0.040). Furthermore, someFig. 2 Comparison of the median RQs of FOXP3 mRNA between healthy controls (HCR) and recipients. Recipients are divided into twosubgroups of KTRs experiencing or not aTCMR. Controls represent the reference for RT-PCR. **Controls vs. baseline ACR-free KTRs: RQ 2.132,IQR 1.664-2.895 vs. RQ 1.630, IQR 1.072-2.367, p 0.005; and *ACR-positive KTRs: RQ 1.381, IQR 0.986-2.483, p 0.010. **** Controls vs. 15-dayACR-free KTRs: RQ 0.771, IQR 0.415-1.169 and ACR-positive KTRs: RQ 0.767, IQR 0.327-1.962, Wilcoxon signed rank p 0.001 and p 0.0002,respectively. The expression of FOXP3 at the time of ACR was lowest compared to baseline (RQ 0.445, IQR 0.360-0.636, p 0.035). The choiceof the FOXP3 molecule as tolerance marker candidate was supported by evidence of a wide inter-individual variability in both healthy (min RQ:1.326 - max: 4.612) and dialysis patients (min RQ: 0.362- max: 7.968). Abbreviations: ACR, acute cellular rejection; (fl- or sol)CTLA-4, (full-length orsoluble) cytotoxic T lymphocyte-4 antigen; FOXP3, forkhead box P3; KTR, kidney transplant recipient; RQ, relative quantification; RT-PCR, real-timepolymerase-chain reaction; ds, days; yr, year
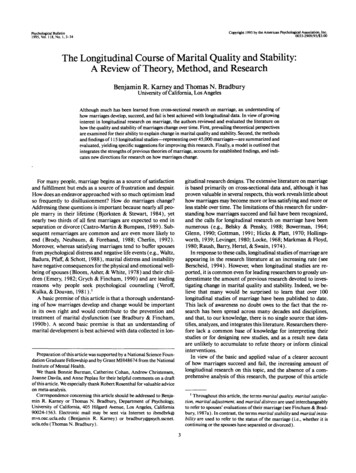
Canossi et al. BMC Nephrology(2022) 23:51Page 7 of 20Fig. 3 Profile of the transcript levels (log2-ΔCT) of the three molecular markers in the two groups of aTCMR-free and aTCMR-positive KTRs(mean SD) in comparison to pre-transplant values. Histogram log values: baseline, 15 days, 60 days, one year and rejection time. There were nosignificant differences between KTRs with and without TCMR within 1 year after transplantation concerning FOXP3 and the flCTLA-4 isoforms. OnlysolCTLA-4 levels showed a different trend after transplantation, with a significant higher transcript levels fifteen days after transplantation in caseswith aTCMR (log 0.365, IQR -0.073-0.648, vs. -0.070, IQR -0.440-0.280, p 0.04)clinical data influenced the onset of aTCMR, such asthe use of everolimus (aTCMR 29.4% vs. aTCMRfree 9.7%, p 0.048, OR 3.869, 95%CI 1.051–14.231), induction type (protection of basiliximab: 72.7%vs. 94.9%, p 0.038 OR 0.144), HLA-MMs (3.8 1.4 vs.3.0 1.2, p 0.050), immunosuppression switch (54.5%vs. 16.7%, p 0.010, OR 6.000), as reported in Table 2.We evaluated then the time-dependent risk for aTCMRof molecular targets and clinical parameters by usingunivariate and multivariate Cox regression analysesand we found out a significant positive relation withthymoglobuline induction (HR 6.749 p 0.041) andeverolimus use (HR 7.017, p 0.007) and a trendto increased risk from the solCTLA-4 expression at15 days (HR 3.905, p 0.057, Table 3). Consideringonly recipients treated with Mycophelolic acid (Fig. 4),the risk for aTCMR of solCTLA-4 at 15d was significantly predictive for the time-dependent risk (p 0.038HR 13.94 95%CI: 1.157–167.87). The receiver operatingcharacteristic curve (ROC) analysis confirmed that15-day solCTLA-4 showed good diagnostic ability ofaTCMR (AUC 0.749, 95%CI:0.634–0.843 p 0.020)considering the whole KTR population and, with theexclusion of patients treated with everolimus, displayedthis molecule like a more accurate biomarker for acuterejection (AUC 0.894, 95% CI:0.791–0.957, p 0.001Fig. 5). A cut-off value 0.13 predicted aTCMR with asensitivity of 100.0% and a specificity of 71.2%flCTLA‑4, solCTLA‑4 and FOXP3 mRNA expression levelsin KTRs developing de novo DSATwenty-three KTRs in total (25.8%) developed DSA aftertransplantation. By examining the trend of the expression of the three candidate biomarkers up to 1 year incorrelation with the de novo DSA development (Fig. 6),we found out a different time-dependent trend for solCTLA-4 molecule between two groups of patients,which decreased after 15 days from transplantation but
Canossi et al. BMC Nephrology(2022) 23:51Page 8 of 20Table 2 Comparison of immunological biomarkers (log 2-DCT), demographic and clinical parameters in the two groups of patientswith aTCMR within 1 year (n 11) or stable transplant (n 78)VARIABLEaTCMR (n 11)aTCMR-free (n 78)P valuea1.580 (1.410-1.670)1.585 (1.370-1.760)0.909a1.150 (0.718-1.675)1.260 (0.950-1,510)0.999a1.345 (1.003-1.648)1.180 (0,940-1,390)0.284a1.320 (1.030-1.420)1.350 (1,095-1,423)0.776a0.910 (0.730-0.980)0.810(0.600-1.008)0.586a0.655 (0.010-1.093)0.570 (0.340-0.740)0.691a0.585 (0.320-1.020)0.630 (0.440-0.870)0.999a0.870 (0.740-1.260)0.730 (0.508-0.863)0.210a0.320 (0.060-0.590)0.235 (0.035-0.443)0.376a0.365 (-0.073-0.648)-0.070 (-0.440-0.280)0.043a0.120 (-0.170-0.230)0.155 (-0.190-0.363)0.539a0.070 (-0.530-0.670)0.110 (0.060-0.500)0.9991.000FOXP3, baselineFOXP3, 15dFOXP3, 60dFOXP3, 1yflCTLA-4 baselineflCTLA-4 15dflCTLA-4 60dflCTLA-4 1ysolCTLA-4 baselinesolCTLA-4 15dsolCTLA-4 60dsolCTLA4 1yOR Recipient gender (%):-males8/11 (72.7)57/78 (73.1)-females3/11 (27.3)21/78 (26.9)Donor gender (%):-males6/11 (54.5)53/78 (67.9)-females5/11 (45.5)25/78 (32.1)b54.7 14.352.2 11.10.372b51.8 20.450.8 15.30.7471.000Recipient ageDonor age0.498Donor type (%):-brain-dead donors11/11 (100)73/78 (93.6)-living donors0/11 (0)5/78 (6.4)4/11 (36.4)28/78 (35.9)1.0000.0380.1440.0483.869Delayed graft function (%)Induction (%):-Basiliximab8/11 (72.7)74/78 (94.9)-Anti-thymocyte globulin3/17 (27.3)4/78 (5.1)Proliferation signal inhibitor (%):-Everolimus-Mycophenolic acid5/17 (29.4)7/72 (9.7)12/17 (70.6)65/72 (90.3)Calcineurin inhibitor (%):-Cyclosporine2/11 (18.2)12/78 (15.4)-Tacrolimus9/11 (81.8)66/78 (84.6)3.8 1.43.0 1.20.050-Class I2/11 (18.2)34/78 (43.6)0.188-Class IIbHLA Mismatches (MM)PRA n (%)0.6822/11 (18.2)25/78 (32.1)0.493b51.5 26.654.7 36.10.963b717.0 218.60.212b48.0 16.5617.9 269.443.4 12.10.416Previous transplants (%)1/11 (9.1)5/78 (6.4)0.558Time on RRT (months)CIT (min)WIT (min)Maintenance therapy change % 6/11 (54.5)13/78 (16.7)0.010CMV reactivation (%)17/78 (21.8)0.131a5/11 (45.5)(median interquartiles), b (mean SD)6.000
Canossi et al. BMC Nephrology(2022) 23:51Page 9 of 20Table 3 Univariate and multivariate Cox regression analyses for the risk of aTCMR after kidney transplantationVARIABLEMultivariate analysisaUnivariate analysis-2ln likelihood: 46.938HR95% CIPHR95% CIP——————BaselineMembrane CTLA41.1780.366—3.7880.784Soluble 30.565At 15 daysMembrane CTLA41.0530.321—3.4570.932———Soluble 7FOXP30.6980.202—2.4080.569———At 60 daysMembrane CTLA42.5370.480—13.4040.273———Soluble 68—21.7150.074———At 365 daysMembrane CTLA41.8980.160—22.4800.611———Soluble 95—5.8950.783———Recipient age1.0070.963—1.0530.758———Donor age0.9990.969—1.0310.972———Recipient gender1.1280.363—3.5060.835———Donor gender0.9300.337—2.5670.889———Type of dialysis0.5750.185—1.7900.340———Dialysis duration0.7520.398—1.4240.382———CMV us transplant1.4660.973—2.2100.067———HLA mismatch1.2290.885—1.7070.219———CIT (min)0.7990.251—2.5440.704———WIT (min)1.0000.998—1.0020.859———Type of donor1.0300.992—1.0690.120———Type of 041Chronic use ofsteroids0.6670.213—2.0930.488———CNI (tacrolimus �PSI (mTOR 4-28.7250.007Immunosuppres‑sion eutic CNIlevel at 15 ic CNIlevel at 60 ��2.1140.561———a2Model summary: χ (1) 15.901, p 0.001. Covariates initially introduced in the multivariable model and then elided were: soluble CTLA4 at 15 days, FOXP3 at 60daysAbbreviations: CI confidence intervals, CIT cold ischemia time, CMV cytomegalovirus, CNI calcineurin inhibitor, DGF delayed graft function, HLA human leukocytesantigens, HR hazard ratio, PRA panel-reactive antibodies, mTORi mammalian target of rapamycin inhibitor, PSI proliferation signal inhibitor, WIT warm ischemia time
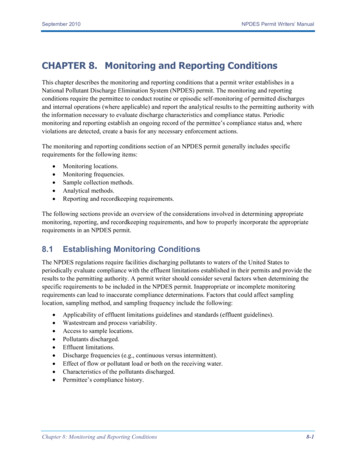
Canossi et al. BMC Nephrology(2022) 23:51Page 10 of 20Fig. 4 Profile of solCTLA-4 transcripts (mean SD) as a function of acute cellular rejection in patients receiving mycophenolic acid. * ACRKTRs: 0.210 0.127 vs. ACR-free KTRs: -0.147 0.07, p 0.013, at 15 days after transplantation. ****Baseline ACR-free KTRs: 0.174 0.052 vs.15 days: -0.147 0.069, p 0.001. Healthy controls: 0.582 0.047. The solCTLA-4 expression in the group of patients without rejection wassig
tool to detect is desirable to oer a simpler monitoring of kidney transplant recipients (KTRs). The purpose of our study was to examine, in peripheral blood before and after transplantation, the expression patterns of regulatory T cell (Treg)-related genes: the forkhead box P3 (FOXP3) and the two CTLA-4 isoforms (full-length and soluble) to predict