Transcription
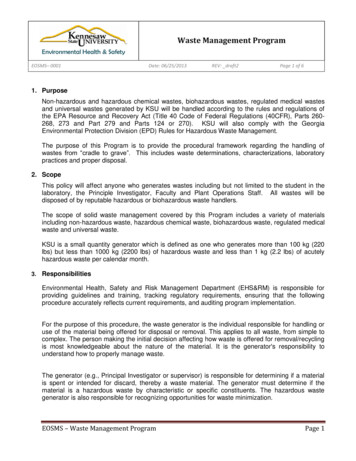
Table 1Effluent Data - January 2005 to December 2006Fitchburg East WWTF - MA 0100986DateRollingAnnual Ave.Flow, MGDBOD,ave. mo.,mg/lDaily Max.Flow, MGDBOD,max. daily,mg/lTSS,ave. mo.,mg/lTSS,max daily,mg/lTRC,max. daily,mg/lFecalColiform,ave. mo.,cfu/100 mlFecalColiform,max daily,cfu/100 7.612/069.410.420.99143.62921.520506.87.6
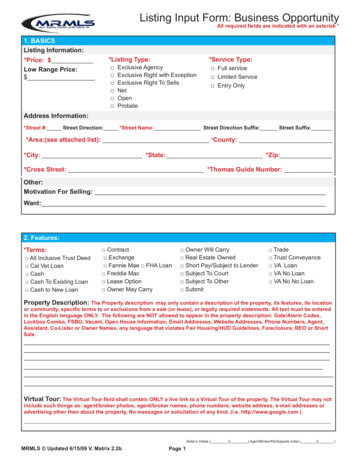
Table 2Effluent Data - January 2005 to December 2006Fitchburg East WWTF - MA 0100986DatePhosphorus,ave. mo., mg/lCopper,ave. mo.,ug/lAluminum,ave. mo.,mg/lLead,ave. mo,mg/l1/051.8616.2 100---2/050.9110.8 1003/051.07 104/051.685/051DissolvedOxygen,mg/lAmmonia,ave. mo.,mg/lCeriadaphnia WETAmmonia,max. daily,mg/lAcuteChronicPimephales ---------- 100 5.0--------- 10025 10050 10 100------------------------0.9 10 100---6.65.17.8------------6/050.9113 1005.06.02.575.95 100100 .6715 100---6.00.791.46------------9/050.7521 100165.80.741.96 100100 10010010/050.5319 100---6.12.35.0------------11/050.35 10 100------------------------12/050.6814 10024------ 100100 498.32 100------------------------3/060.9927.0170 5.0--------- 10046 1001004/061.3725.0 100------------------------5/060.97 10 100---6.01.63.8------------6/060.50 10 1005.05.52.24.163.246 100257/060.49 10 100---6.00.570.6------------8/060.4823.0 100---5.70.560.56------------9/060.6216.9 1005.05.90.560.56 100100 10010010/060.5111.0 100---6.00.92.2------------11/060.7311.0 100--------------------- 10 100---------------------12/060.68Notes:1— - no sampling required
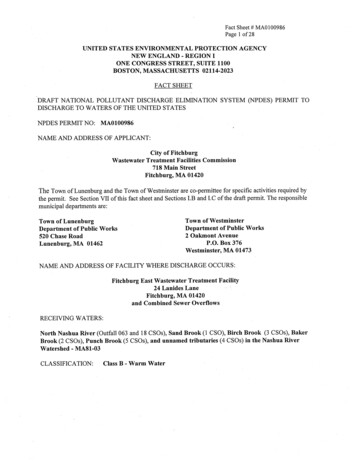
Table 3Cu - East Fitchburg (Lognormal distribution, ND)Daily Maximum Limit Derivation (some measurements detection limit)10.02.786503.34798248Detection Limit** u y Avg of Nat. Log of daily Discharge (mg/L) Σ (y i - u )2 k number of daily samples r number of non-detects σy estimated variance (Σ[(yi - u y ) ]) / (k-r-1) 220.22320σy standard deviation squareδ number of nondetect values/number of samples z z-score[(0.99-δ)/(1-δ)] 2root σy 0.472440.333330.985002.170091z-score of (from z-score calculator at zCalc.html)Daily Max Limit exp (u y z-score*σy )Daily Max Limit 45.23 ug/l(Log normal distribution, 99th percentile)Average Monthly Limit Derivation (some measurements detection limit)Number of samples per month***, n 1.00E(x) Daily Avg δD (1-δ) exp(u y 0.5 σy ) 215.42641V(x) Daily Variance (1-δ)exp(2u y σy )[exp(σy )-(1-δ)] δ(1-δ)D[D-2exp(u y 0.5σy )] 69.57899222A V(x)/[n(E(x)-δ D) ] n216.12378552B -[δ D (1-δ )]/(E(x)-δ D) n 2nn2-0.151954555C (2δ D)/(E(x)-δ D)nn0.55127952σn2 Monthly Average variance ln{(1-δn)[1 A B C]}2.45806σn Monthly Average standard deviation σn2 (0.5) 1.56782nnu n n-day monthly average ln[(E(x)-δ D)/(1-δ )] - 0.5σn2 z z-score[(0.99-δ)/(1-δ)]z-score 1.669070.925001.439531Monthly Average Limit exp (u n z-score*σn)Monthly Avg Limit 50.70 ug/l(Log normal distribution, 95th percentile of average monthly values)**Assumed detection limit 10.0, which was the detection limit for the majority of the tests which returned ND.*** Assumed number of samples per month 1 since this was the minimum sample number per month.
Table 3 Cu - East Fitchburg (Lognormal distribution, ND) Daily Maximum Limit Derivation (some measurements detection limit) Detection Limit** 10.0 uy Avg of Nat. Log of daily Discharge (mg/L) 2.78650 Σ (yi - u) 2 3.34798 k number of daily samples 24 r number of non-detects 8 σy 2 estimated variance (Σ[(y i - uy) 2]) / (k-r-1) 0.22320 σy standard deviation square .