Transcription
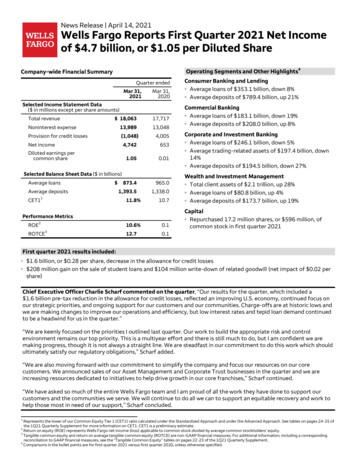
News Release April 14, 2021Wells Fargo Reports First Quarter 2021 Net Incomeof 4.7 billion, or 1.05 per Diluted ShareOperating Segments and Other HighlightsCompany-wide Financial SummaryQuarter endedMar 31,2021Mar 31,2020Selected Income Statement Data( in millions except per share amounts)Total revenue 18,06317,717Noninterest expense13,98913,048Provision for credit losses(1,048)4,005Net ted earnings percommon shareSelected Balance Sheet Data ( in billions)Average loans Average deposits111.8%CET110.7Performance Metrics2ROE3ROTCE10.6%0.112.70.14Consumer Banking and Lending Average loans of 353.1 billion, down 8% Average deposits of 789.4 billion, up 21%Commercial Banking Average loans of 183.1 billion, down 19% Average deposits of 208.0 billion, up 8%Corporate and Investment Banking Average loans of 246.1 billion, down 5% Average trading-related assets of 197.4 billion, down14% Average deposits of 194.5 billion, down 27%Wealth and Investment Management Total client assets of 2.1 trillion, up 28% Average loans of 80.8 billion, up 4% Average deposits of 173.7 billion, up 19%Capital Repurchased 17.2 million shares, or 596 million, ofcommon stock in first quarter 2021First quarter 2021 results included: 1.6 billion, or 0.28 per share, decrease in the allowance for credit losses 208 million gain on the sale of student loans and 104 million write-down of related goodwill (net impact of 0.02 pershare)Chief Executive Officer Charlie Scharf commented on the quarter, “Our results for the quarter, which included a 1.6 billion pre-tax reduction in the allowance for credit losses, reflected an improving U.S. economy, continued focus onour strategic priorities, and ongoing support for our customers and our communities. Charge-offs are at historic lows andwe are making changes to improve our operations and efficiency, but low interest rates and tepid loan demand continuedto be a headwind for us in the quarter.”“We are keenly focused on the priorities I outlined last quarter. Our work to build the appropriate risk and controlenvironment remains our top priority. This is a multiyear effort and there is still much to do, but I am confident we aremaking progress, though it is not always a straight line. We are steadfast in our commitment to do this work which shouldultimately satisfy our regulatory obligations,” Scharf added.“We are also moving forward with our commitment to simplify the company and focus our resources on our corecustomers. We announced sales of our Asset Management and Corporate Trust businesses in the quarter and we areincreasing resources dedicated to initiatives to help drive growth in our core franchises,” Scharf continued.“We have asked so much of the entire Wells Fargo team and I am proud of all the work they have done to support ourcustomers and the communities we serve. We will continue to do all we can to support an equitable recovery and work tohelp those most in need of our support,” Scharf concluded.1Represents the lower of our Common Equity Tier 1 (CET1) ratio calculated under the Standardized Approach and under the Advanced Approach. See tables on pages 24-25 ofthe 1Q21 Quarterly Supplement for more information on CET1. CET1 is a preliminary estimate.Return on equity (ROE) represents Wells Fargo net income (loss) applicable to common stock divided by average common stockholders’ equity.3Tangible common equity and return on average tangible common equity (ROTCE) are non-GAAP financial measures. For additional information, including a correspondingreconciliation to GAAP financial measures, see the “Tangible Common Equity” tables on pages 22-23 of the 1Q21 Quarterly Supplement.4Comparisons in the bullet points are for first quarter 2021 versus first quarter 2020, unless otherwise specified.2
Financial results reported in this document are preliminary. Final financial results and other disclosures will be reported in our Quarterly Report on Form 10-Q forthe quarter ended March 31, 2021, and may differ materially from the results and disclosures in this document due to, among other things, the completion offinal review procedures, the occurrence of subsequent events, or the discovery of additional information.Selected Company-wide Financial InformationMar 31, 2021% Change fromQuarter endedDec 31,2020Mar 31,2020Dec 31,2020Mar 06317,92517,71712523584941(10)(44)Mar 31,2021Earnings ( in millions except per share amounts) Net interest incomeNoninterest incomeTotal revenueNet charge-offs45(1,571)(763)3,064NMNMProvision for credit losses(1,048)(179)4,005NMNMNoninterest 992653586261.050.640.0164NM(3)(9)Change in the allowance for credit lossesIncome tax expenseWells Fargo net income Diluted earnings per common share7Balance Sheet Data (average) ( in billions)Loans873.4899.7965.0Deposits 1(1)Financial RatiosReturn on assets (ROA)0.99 %0.620.13Return on equity (ROE)10.66.40.1Return on average tangible common equity (ROTCE) (a)12.77.70.17783742.052.132.58Efficiency ratio (b)Net interest margin on a taxable-equivalent basisNM – Not meaningful(a) Tangible common equity and return on average tangible common equity are non-GAAP financial measures. For additional information, including a corresponding reconciliation to GAAP financialmeasures, see the “Tangible Common Equity” tables on pages 22-23 of the 1Q21 Quarterly Supplement.(b)The efficiency ratio is noninterest expense divided by total revenue (net interest income and noninterest income).First Quarter 2021 vs. First Quarter 2020 Net interest income decreased 22%, primarily due to the impact of lower interest rates, which drove a repricing of thebalance sheet, lower loan balances primarily due to soft demand and elevated prepayments, as well as unfavorable hedgeineffectiveness accounting results, and higher mortgage-backed securities premium amortization Noninterest income increased 45%, as first quarter 2020 included securities impairments and lower deferredcompensation plan investment results primarily due to lower market valuations driven by the COVID-19 pandemic. Firstquarter 2021 included stronger mortgage production results, improved trading and higher investment banking fees, andhigher asset-based fees in Wealth and Investment Management, partially offset by lower gains on loan sales and lowerdeposit fees in Consumer and Small Business Banking Noninterest expense increased 7%, as first quarter 2020 included the impact of lower deferred compensation planexpense. First quarter 2021 included higher incentive and revenue-related compensation, including the impact of highermarket valuations on stock-based compensation, which was partially offset by lower operating losses and efficiencyinitiatives to reduce spend on consultants and contractors Provision for credit losses decreased 5.1 billion. First quarter 2021 included a 1.6 billion decrease in the allowance forcredit losses due to continued improvements in the economic environment and lower net charge-offs, while first quarter2020 included a 3.1 billion increase in the allowance for credit losses-2-
Selected Company-wide Capital and Liquidity InformationQuarter endedMar 31,2021( in billions)Dec 31,2020Mar 31,2020Capital:188.3185.9183.3Common stockholders’ equity167.1164.8162.7Tangible common equity (a)139.0136.9134.8 Total equityCET1 (b)11.8 %11.610.7Total loss absorbing capacity (TLAC) (c)25.225.723.3127133121Liquidity:LCR (d)(a)(b)(c)(d)Tangible common equity and return on average tangible common equity are non-GAAP financial measures. For additional information, including a corresponding reconciliation to GAAP financialmeasures, see the “Tangible Common Equity” tables on pages 22-23 of the 1Q21 Quarterly Supplement.Represents the lower of our Common Equity Tier 1 (CET1) ratio calculated under the Standardized Approach and under the Advanced Approach. See tables on pages 24-25 of the 1Q21 QuarterlySupplement for more information on CET1. CET1 is a preliminary estimate.TLAC is a preliminary estimate.Liquidity coverage ratio (LCR) is calculated as high-quality liquid assets divided by projected net cash outflows, as each is defined under the LCR rule. LCR is a preliminary estimate.Selected Company-wide Credit InformationQuarter endedMar 31,2021( in millions)Net charge-offs Net loan charge-offs as a % of average total loans (annualized) Total nonaccrual loans Total nonperforming assets5235849410.260.388,7286,1568,0558,1950.95 %As a % of total loansAllowance for credit losses for loans As a % of total loansMar 31,20200.24 %0.93 %As a % of total loansDec 31,202018,0432.09 st Quarter 2021 vs. Fourth Quarter 2020 Net loan charge-offs remained low in both our commercial and consumer portfolios. Commercial net loan charge-offs asa percentage of average loans was 0.13% (annualized), down from 0.26%, while the consumer net loan charge-off ratewas 0.37% (annualized), up from 0.26% Nonperforming assets decreased 8%. Nonaccrual loans decreased 673 million primarily due to decreases in the energy,commercial real estate, and residential mortgage portfolios-3-
Business Segment PerformanceConsumer Banking and Lending offers diversified financial products and services for consumers and small businesses withannual sales generally up to 5 million. These financial products and services include checking and savings accounts, creditand debit cards, as well as home, auto, personal, and small business lending.Selected Financial InformationQuarter endedMar 31, 2021% Change fromMar 31,2021Dec 31,2020Mar 31,2020Dec 31,2020Mar 31,20204,5504,7014,861(3)%(6)Home Lending2,2271,9951,8761219Credit Card1,3461,3721,375(2)(2)Auto403403380—6Personal 569NMNM6,2676,4416,257(3) 2,1041,364618 353.1373.9382.6(6)(8)789.4763.2652.7321Earnings (in millions) Consumer and Small Business BankingConsumer Lending:Total revenue(419)Provision for credit lossesNoninterest expenseNet income54—240Average balances (in billions)LoansDepositsNM – Not meaningfulFirst Quarter 2021 vs. First Quarter 2020 Revenue was flat Consumer and Small Business Banking was down 6% primarily due to the impact of lower interest rates and lowerdeposit-related fees due to higher average checking account balances and higher COVID-19 related fee waivers Home Lending was up 19% as higher retail mortgage originations and a higher gain on sale margin were partially offsetby lower gains on loan portfolio sales and lower net interest income primarily driven by lower loan balances Credit Card was down 2% primarily driven by lower balances on elevated payment rates Auto was up 6% on higher net interest income, while Personal Lending was down 18% driven by lower loan balances Noninterest expense was flat as higher revenue-related expense in Home Lending and investments in operations andtechnology were offset by lower operating losses and lower branch staffing expense due to efficiency initiatives, as wellas a decline in advertising expense-4-
Commercial Banking provides financial solutions to private, family owned and certain public companies. Products andservices include banking and credit products across multiple industry sectors and municipalities, secured lending and leaseproducts, and treasury management. In March 2021, we announced an agreement to sell our Corporate Trust Servicesbusiness and expect to move the business from the Commercial Banking operating segment to Corporate in secondquarter 2021.Selected Financial InformationQuarter endedMar 31,2021Dec 31,2020Mar 31,2020Mar 31, 2021% Change fromDec 31,2020Mar 31,20201%(20)Earnings (in millions)1,1591,1491,455Asset-Based Lending and 2,3882,502(8)(12)691,041NMNM1,7661,6901,69744 63747335462 183.1190.9224.9(4)(19)208.0203.6193.528 Middle Market BankingTotal revenue(399)Provision for credit lossesNoninterest expenseNet income (loss)(176)Average balances (in billions)LoansDepositsNM – Not meaningfulFirst Quarter 2021 vs. First Quarter 2020 Revenue decreased 12% Middle Market Banking was down 20% primarily due to the impact of lower interest rates, as well as lower loanbalances due to reduced client demand and line utilization Asset-Based Lending and Leasing was up 7% as first quarter 2020 included equity securities impairments primarily dueto lower market valuations. This was partially offset by lower net interest income in first quarter 2021 from lower loanbalances on reduced demand and line utilization Noninterest expense increased 4% primarily driven by higher technology expense, partially offset by lower headcountand consulting expense related to efficiency initiatives-5-
Corporate and Investment Banking delivers a suite of capital markets, banking and financial products and services tocorporate, commercial real estate, government and institutional clients globally. Products and services include corporatebanking, investment banking, treasury management, commercial real estate lending and servicing, equity and fixed incomesolutions, as well as sales, trading, and research capabilities.Selected Financial InformationQuarter endedMar 31,2021Mar 31, 2021% Change fromDec 31,2020Mar 31,2020Dec 31,2020Mar 31,2020453424457370384498(4)(26)Earnings (in millions)Banking:Lending Treasury Management and PaymentsInvestment BankingTotal BankingCommercial Real kets:Fixed Income, Currencies, and Commodities (FICC)EquitiesCredit Adjustment (CVA/DVA) and Other36Total Markets1,432Other21Total 61,125NMNM1,8331,7981,8702(2) 1,57484129287 246.1239.8258.23(5)194.5205.8266.2(5)(27)Provision for credit losses(284)Noninterest expenseNet income(67)1,016439Average balances (in billions)LoansDepositsNM – Not meaningfulFirst Quarter 2021 vs. First Quarter 2020 Revenue increased 7% Banking was down 6% primarily driven by the impact of lower interest rates and lower deposit balances predominantlydue to actions taken to manage under the asset cap, partially offset by higher advisory fees and equity and debtorigination fees Commercial Real Estate was up 5% primarily driven by higher commercial mortgage-backed securities gain on salemargins and improved results in the low income housing business, partially offset by the impact of lower interest rates Markets was up 19% on increased client demand for asset-backed finance products, other credit products andmunicipal bonds, partially offset by lower demand for rates products and lower revenue in equities and commodities Noninterest expense decreased 2% primarily driven by lower operating losses, partially offset by higher revenue-relatedcompensation-6-
Wealth and Investment Management provides personalized wealth management, investment and retirement productsand services to clients across U.S.-based businesses including Wells Fargo Advisors and The Private Bank. We serve clients’brokerage needs, and deliver financial planning, private banking, credit and fiduciary services to high-net worth and ultrahigh-net worth individuals and families. In February 2021, we announced an agreement to sell Wells Fargo AssetManagement and moved the business from the Wealth and Investment Management operating segment to Corporate.Prior period balances have been revised to conform with the current period presentation.Selected Financial InformationQuarter endedMar 31,2021Dec 31,2020Mar 31, 2021% Change fromMar 31,2020Dec 31,2020Mar 31,2020(8)%(22)Earnings (in millions)657714838Noninterest income2,8872,7332,4326Total revenue3,5443,4473,27038NM914(18)(8)28 Net interest income(43)Provision for credit lossesNoninterest expenseNet income Total client assets (in 13198NMAverage balances (in billions)Loans Deposits80.880.177.914173.7169.8145.4219NM – Not meaningfulFirst Quarter 2021 vs. First Quarter 2020 Revenue increased 8%, as first quarter 2021 included higher asset-based fees, partially offset by lower net interestincome as a result of lower interest rates. Additionally, first quarter 2020 included lower deferred compensation planinvestment results Noninterest expense increased 14%, as first quarter 2021 included higher revenue-related compensation. Additionally,first quarter 2020 included lower deferred compensation plan expense Total client assets increased 28%, primarily driven by higher market valuations-7-
Corporate includes corporate treasury and enterprise functions, net of allocations (including funds transfer pricing, capital,liquidity and certain expenses), in support of the reportable operating segments, as well as our investment portfolio andaffiliated venture capital and private equity partnerships. Corporate also includes certain lines of business thatmanagement has determined are no longer consistent with the long-term strategic goals of the Company, including ourstudent loan and rail car leasing businesses, as well as results for previously divested businesses. In February 2021, weannounced an agreement to sell Wells Fargo Asset Management and moved the business from the Wealth and InvestmentManagement operating segment to Corporate. Prior period balances have been revised to conform with the current periodpresentation.Selected Financial InformationMar 31, 2021% Change fromQuarter endedMar 31,2021Dec 31,2020Mar 31,2020Dec 31,2020Mar 31,2020819Earnings (in millions) Net interest incomeNoninterest incomeTotal 27262112(63)567(48)93(534)104101(430)97Provision for credit losses1,095Noninterest expenseNet income (loss) 8(272)(781)2,103(196)NM – Not meaningfulFirst Quarter 2021 vs. First Quarter 2020 Revenue increased 27% Net interest income was down primarily due to the impact of lower interest rates and unfavorable hedgeineffectiveness accounting results Noninterest income was up, as first quarter 2020 included equity securities impairments in our affiliated venturecapital and private equity partnerships and lower deferred compensation plan investment results. First quarter 2021included a gain on the sale of student loans Noninterest expense increased 93%, as first quarter 2020 included lower deferred compensation plan expense. Firstquarter 2021 included higher stock-based compensation on higher market valuations and a 104 million write-down ofgoodwill associated with the sale of student loansConference CallThe Company will host a live conference call on Wednesday, April 14, at 7:00 a.m. PT (10:00 a.m. ET). You may listen to thecall by dialing 866-872-5161 (U.S. and Canada) or 440-424-4922 (International). The call will also be available online ons/quarterly-earnings/ andhttps://edge.media-server.com/mmc/p/9wej5fnq.A replay of the conference call will be available from approximately 11:00 a.m. PT (2:00 p.m. ET) on Wednesday,April 14 through Wednesday, April 28. Please dial 855-859-2056 (U.S. and Canada) or 404-537-3406 (International) andenter Conference ID: 3298001. The replay will also be available online ons/quarterly-earnings/ -
Forward-Looking StatementsThis document contains forward-looking statements. In addition, we may make forward-looking statements in our otherdocuments filed or furnished with the Securities and Exchange Commission, and our management may make forwardlooking statements orally to analysts, investors, representatives of the media and others. Forward-looking statements canbe identified by words such as “anticipates,” “intends,” “plans,” “seeks,” “believes,” “estimates,” “expects,” “target,”“projects,” “outlook,” “forecast,” “will,” “may,” “could,” “should,” “can” and similar references to future periods. In particular,forward-looking statements include, but are not limited to, statements we make about: (i) the future operating or financialperformance of the Company, including our outlook for future growth; (ii) our noninterest expense and efficiency ratio;(iii) future credit quality and performance, including our expectations regarding future loan losses, our allowance for creditlosses, and the economic scenarios considered to develop the allowance; (iv) our expectations regarding net interestincome and net interest margin; (v) loan growth or the reduction or mitigation of risk in our loan portfolios; (vi) futurecapital or liquidity levels, ratios or targets; (vii) the performance of our mortgage business and any related exposures;(viii) the expected outcome and impact of legal, regulatory and legislative developments, as well as our expectationsregarding compliance therewith; (ix) future common stock dividends, common share repurchases and other uses of capital;(x) our targeted range for return on assets, return on equity, and return on tangible common equity; (xi) expectationsregarding our effective income tax rate; (xii) the outcome of contingencies, such as legal proceedings; (xiii) environmental,social and governance related goals or commitments; and (xiv) the Company’s plans, objectives and strategies.Forward-looking statements are not based on historical facts but instead represent our current expectations andassumptions regarding our business, the economy and other future conditions. Because forward-looking statementsrelate to the future, they are subject to inherent uncertainties, risks and changes in circumstances that are difficult topredict. Our actual results may differ materially from those contemplated by the forward-looking statements. We cautionyou, therefore, against relying on any of these forward-looking statements. They are neither statements of historical factnor guarantees or assurances of future performance. While there is no assurance that any list of risks and uncertainties orrisk factors is complete, important factors that could cause actual results to differ materially from those in the forwardlooking statements include the following, without limitation: current and future economic and market conditions, including the effects of declines in housing prices, highunemployment rates, U.S. fiscal debt, budget and tax matters, geopolitical matters, and any slowdown in globaleconomic growth;the effect of the COVID-19 pandemic, including on our credit quality and business operations, as well as its impact ongeneral economic and financial market conditions;our capital and liquidity requirements (including under regulatory capital standards, such as the Basel III capitalstandards) and our ability to generate capital internally or raise capital on favorable terms;current, pending or future legislation or regulation that could have a negative effect on our revenue and businesses,including rules and regulations relating to bank products and financial services;developments in our mortgage banking business, including the extent of the success of our mortgage loanmodification efforts, the amount of mortgage loan repurchase demands that we receive, any negative effects relatingto our mortgage servicing, loan modification or foreclosure practices, and the effects of regulatory or judicialrequirements or guidance impacting our mortgage banking business and any changes in industry standards;our ability to realize any efficiency ratio or expense target as part of our expense management initiatives, including as aresult of business and economic cyclicality, seasonality, changes in our business composition and operatingenvironment, growth in our businesses and/or acquisitions, and unexpected expenses relating to, among other things,litigation and regulatory matters;the effect of the current interest rate environment or changes in interest rates or in the level or composition of ourassets or liabilities on our net interest income, net interest margin and our mortgage originations, mortgage servicingrights and mortgage loans held for sale;significant turbulence or a disruption in the capital or financial markets, which could result in, among other things,reduced investor demand for mortgage loans, a reduction in the availability of funding or increased funding costs, anddeclines in asset values and/or recognition of impairments of securities held in our debt securities and equity securitiesportfolios;the effect of a fall in stock market prices on our investment banking business and our fee income from our brokerageand wealth management businesses;negative effects from the retail banking sales practices matter and from other instances where customers may haveexperienced financial harm, including on our legal, operational and compliance costs, our ability to engage in certainbusiness activities or offer certain products or services, our ability to keep and attract customers, our ability to attractand retain qualified employees, and our reputation;-9-
resolution of regulatory matters, litigation, or other legal actions, which may result in, among other things, additionalcosts, fines, penalties, restrictions on our business activities, reputational harm, or other adverse consequences;a failure in or breach of our operational or security systems or infrastructure, or those of our third-party vendors orother service providers, including as a result of cyber attacks;the effect of changes in the level of checking or savings account deposits on our funding costs and net interest margin;fiscal and monetary policies of the Federal Reserve Board;changes to U.S. tax guidance and regulations, as well as the effect of discrete items on our effective income tax rate;our ability to develop and execute effective business plans and strategies; andthe other risk factors and uncertainties described under “Risk Factors” in our Annual Report on Form 10-K for the yearended December 31, 2020.In addition to the above factors, we also caution that the amount and timing of any future common stock dividends orrepurchases will depend on the earnings, cash requirements and financial condition of the Company, market conditions,capital requirements (including under Basel capital standards), common stock issuance requirements, applicable law andregulations (including federal securities laws and federal banking regulations), and other factors deemed relevant by theCompany’s Board of Directors, and may be subject to regulatory approval or conditions.For more information about factors that could cause actual results to differ materially from our expectations, refer to ourreports filed with the Securities and Exchange Commission, including the discussion under “Risk Factors” in our AnnualReport on Form 10-K for the year ended December 31, 2020, as filed with the Securities and Exchange Commission and5available on its website at www.sec.gov .Any forward-looking statement made by us speaks only as of the date on which it is made. Factors or events that couldcause our actual results to differ may emerge from time to time, and it is not possible for us to predict all of them. Weundertake no obligation to publicly update any forward-looking statement, whether as a result of new information, futuredevelopments or otherwise, except as may be required by law.Forward-looking Non-GAAP Financial Measures. From time to time management may discuss forward-looking non-GAAPfinancial measures, such as forward-looking estimates or targets for return on average tangible common equity. We areunable to provide a reconciliation of forward-looking non-GAAP financial measures to their most directly comparableGAAP financial measures because we are unable to provide, without unreasonable effort, a meaningful or accuratecalculation or estimation of amounts that would be necessary for the reconciliation due to the complexity and inherentdifficulty in forecasting and quantifying future amounts or when they may occur. Such unavailable information could besignificant to future results.5We do not control this website. Wells Fargo has provided this link for your convenience, but does not endorse and is not responsible for the content,links, privacy policy, or security policy of this website.-10-
About Wells FargoWells Fargo & Company (NYSE: WFC) is a leading financial services company that has approximately 1.9 trillion in assetsand proudly serves one in three U.S. households and more than 10% of all middle market companies and small businessesin the U.S. We provide a diversified set of banking, investment and mortgage products and services, as well as consumerand commercial finance, through our four reportable operating segments: Consumer Banking and Lending, CommercialBanking, Corporate and Investment Banking, and Wealth and Investment Management. Wells Fargo ranked No. 30 onFortune’s 2020 rankings of America’s largest corporations. In the communities we serve, the company focuses its socialimpact on building a sustainable, inclusive future for all by supporting housing affordability, small business growth,financial health and a low-carbon economy.Contact InformationMediaPeter Gilchrist, or RelationsJohn M. Campbell, 415-396-0523john.m.campbell@wellsfargo.com###-11-
apercentageof average loans was 0.13% (annualized),down from 0.26%, while the consumer net loan charge-off rate was0.37% (annualized),up from 0.26% Nonperformingassets decreased 8%. Nonaccrual loans decreased 673 million primarily due to decreases in the energy, commercialreal estate, and residential mortgage portfolios -3-