Transcription
Health Workforce in Nevada Report 2017UNR Med Health Policy ReportHealth Workforce Supply in Nevada2017 EditionTabor Griswold, PhD, John Packham, PhD,Christopher Marchand, MPH, Laima Etchegoyhen, MPH,and Troy Jorgensen, BSMarch 2017Office of Statewide InitiativesUniversity of Nevada, Reno School of Medicinehttp://www.med.unr.edu/statewideOffice of Statewide Initiatives
Health Workforce in Nevada Report 2017.Office of Statewide Initiatives
Health Workforce in Nevada Report 2017Health Workforce Supply in Nevada2017 EditionOverviewHealth Workforce Supply in Nevada – 2017 Edition, provides current data on the supply of physicians,nurses, and other health care workers in Nevada. This report, prepared by the Office of StatewideInitiatives at the University of Nevada, Reno School of Medicine, is designed to provide informationabout health workforce trends to help inform health industry, educators, state and local policymakers,and other health stakeholders about the reallocation of resources needed to meet state workforcedevelopment needs and to improve the health of all Nevadans. This chart book adopts a broad view ofthe jobs or occupations that make up the health workforce – in other words, it contains information onhealth professionals providing direct patient care services in hospitals and ambulatory care settings, aswell as data on a wide range of administrative and non-clinical jobs in health care industries and othersectors of the state’s economy. Figure 1 summarizes the composition of Nevada’s current healthworkforce. Currently, the state’s health care workforce consists of 135,390 total jobs or 11.0 percent ofthe state’s workforce.Health workforce supply refers to the number of personnel working or available to work in health caresettings in Nevada. The term “supply” typically incorporates the economic notion of an individual’swillingness to work for a particular level of compensation. Most of the data on health workforce supplycontained in this report are headcounts of licensed professionals residing in Nevada utilizing dataroutinely collected by state agencies charged with licensing and regulating health care professionals. Assuch, the report relies on the number of licensed health professionals as a general indicator ofworkforce supply. Thus, at best, licensed headcounts are an imperfect measure of supply, sincelicensed health care practitioners may be semiretired or working part time, may practice in anotherstate, and/or may be engaged in other professional activities, including nonclinical or administrativework. Ideally, the most accurate measure of health workforce supply would incorporate the precisenumber of employed personnel based on an enumeration of full- and part-time health care workers inthe state who are engaged in clinical or patient care activities.Health Workforce Supply in Nevada details recent trends on the supply of health care workers utilizingdata collected by agencies and boards in the State of Nevada charged with licensing and regulatinghealth professionals. It provides trend data on changes in the number of licensees, as well as change inthe per capita number of licensed health professionals over the past decade. It also contains currentinformation on the regions of the state designated as Health Professional Shortage Areas (HPSAs) bythe Federal Health Resources and Services Administration (HRSA), and the number of Nevadansresiding in primary care, mental health, and dental HPSAs. The geographical maldistribution of healthprofessionals is a fundamental feature of health workforce shortages in Nevada.Health Workforce Supply in Nevada – 2017 EditionOffice of Statewide Initiatives1
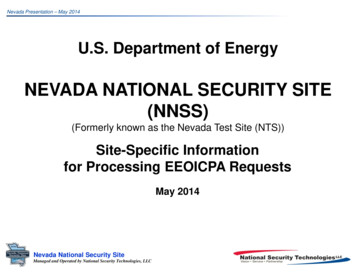
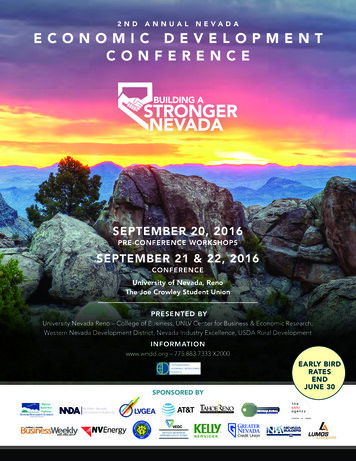
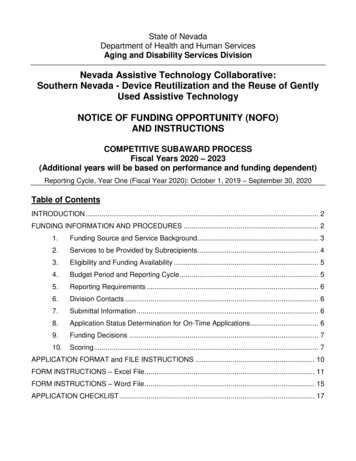
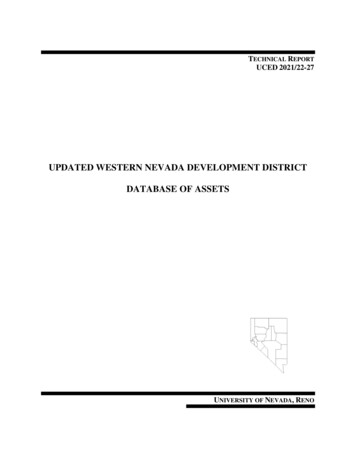
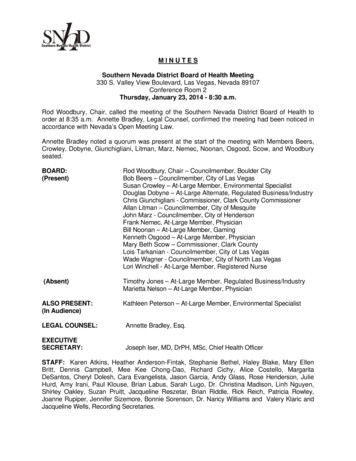
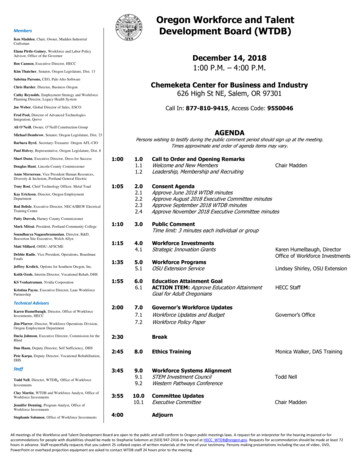
Health Workforce in Nevada Report 2017Key Findings on Health Workforce Supply in NevadaTables 1 through 6 of the report details recent trends on the supply of health care workers utilizingdata collected by agencies and boards in the State of Nevada charged with licensing and regulatinghealth professionals. This section of the report provides trend data on changes in the number oflicensees, as well as change in the per capita number of licensed health professionals over the pastdecade. A common feature of licensure trends over the past decade has been substantial growth in thenumber of licensees for most health professions, yet modest, if little, growth in the number of licensedhealth professionals per capita. For example, from 2006 to 2016, the number of licensed allopathicphysicians (MDs) grew, from 4,062 to 5,092, or by 1,030 (25.4%). However, the number of licensedMDs per 100,000 only increased by 19.1 percent during the same period due to steady populationgrowth. This “treading water” trend typifies medicine and most of the licensure data presented in thissection and helps explain why Nevada’s poor health workforce rankings among U.S. states do notchange appreciably from year to year, despite the fact that the number of licensees in most fields hasgrown over the past ten years. Noteworthy exceptions include advanced practitioners of nursing(APNs) and physician assistants (PAs) who have experienced both strong numerical and per capitagrowth over the past decade. In addition to highlighting the “treading water” phenomenon of stronggrowth in the number of licensees being offset by modest per capita gains, these tables reveal thatsome health professions have actually witnessed a net decline in the number of licensees per 100,000population, including per capita drops in the number of addictions counselors, dental hygienists,emergency medical services, and medical laboratory directors and technologists.Tables 7 and 8 summarize Nevada’s health workforce rankings among U.S. states. Physician data usedin Tables 7 are from 2010-2014 American Medical Association Physician Masterfiles (Copyright). NonFederal physicians’ data are used in this report. Primary care data includes both MD and DO data fromGeneral Family Medicine, General Practice, General Internal Medicine and General Pediatrics andsubspecialties within these specialties are excluded. Total patient care and patient care primary caresubset includes both MD and DO data from office based and hospital based full-time staff includingresidents. Physicians aged 75 and over are excluded. Data for individual specialties of Anesthesiology,Emergency Medicine, Family Medicine, General Practice, Internal Medicine, General Surgery, OB-Gyn,Orthopedic Surgery, Pediatrics, Physical Medicine/Rehab, and Psychiatry include both MD and DOphysicians. Overall categories of Medical Specialties and Surgical Specialties is only MD data.The data contained in this section of the report reveals physician workforce shortages across mostmedical specialties, as well as poor rankings across a wide range of health professions in Nevada.Despite recent improvement in the number of licensed health professionals, Nevada’s healthworkforce rankings have not changed appreciably over the past two decades. Noteworthy rankingsinclude the number of physicians per capita (Nevada is ranked 48th among U.S. states), primary carephysicians (50th), registered nurses (48th), psychiatrists (47th), and psychologists (38th). Equallytroubling, Nevada ranks poorly across most medical and surgical specialties, including general surgery(50st), orthopedic surgery (51st), family medicine/general practice (47th), and pediatrics (48th).Exceptions to these trends include dentists (Nevada’s rank is 32nd among US states), physicians inHealth Workforce Supply in Nevada – 2017 EditionOffice of Statewide Initiatives2
Health Workforce in Nevada Report 2017emergency medicine (38th), internal medicine (30th), anesthesiology (23rd), plastic surgery (26th),colorectal surgery (39th), physical medicine and rehab (25th), forensic pathology (12th), and physicianassistants in clinical practice (38th).One of the most striking features of Table 8 is that the non-physician health professions listed possessa per capita number lower than the national average or number of professionals per 100,000population. While these figures beg the larger question of what is the appropriate or desired numberof health professionals in Nevada, it is abundantly clear that Nevada’s health workforce supply fallswell short of national averages for most of the key professions needed to ensure access to basicprimary, preventive, and specialty services. These deficits will be compounded by an aging health careworkforce and new demands for medical services generated by population growth, population aging,and insurance coverage expansions over the past four or five years. The data in this table are from theArea Health Resource File and are aggregated from multiple sources: national licensure files, NationalProvider Identification (CMS), Bureau of Labor Statistics, and the American Community Survey. Somedata may reflect full-time workforce per capita rather than licensure per capita.A key determinant of health workforce supply in Nevada is the capacity of public and private highereducation institutions in the state to produce graduates for specific health care occupations who areprepared for licensure in their respective fields. Tables 9 and 10 provide information on medical,nursing, and other health professions graduates in Nevada utilizing the most currently available data(Academic Year 2014-2015) from the Integrated Postsecondary Data System (IPEDS).Table 9 provides a snapshot of public and private higher education health care program capacity inNevada for a selected number of occupations in medicine and primary care, nursing, oral health,pharmacy, mental health, and allied health. These data illustrate a couple of general features of highereducation capacity in Nevada. First, the output or number of completions for most health careoccupations is modest with respect to any measure of recent or projected job demand. Second, changeor growth in capacity in most programs has been modest over the past six year years. Even in thoseprograms, such as nursing and pharmacy, that have substantially increased their respective number ofcompletions over the past six years, it is unclear whether there is sufficient capacity to meet theanticipated growth in demand that will occur with an aging population and insurance coverageexpansions that will take place in Nevada over the next decade.Table 10 highlights higher education completion rates for the most recent academic year (2014-2015)by race, ethnicity, and gender. Comparing nursing graduates by gender, 80.2% of registered nursegraduates were female whereas 92.3% of the nurse practitioner graduates were male. In terms ofracial and ethnic diversity among graduates as compared to the general population, white and Asianstudents are over-represented, as compared to non-white and Latino population groups. Among theprofessions listed in Table 10, physical therapists (PT) were the least diverse with 73.4% of PTgraduates being white.Health Workforce Supply in Nevada – 2017 EditionOffice of Statewide Initiatives3
Health Workforce in Nevada Report 2017Table 11 and 12 highlight significant differences in the geographic distribution of health professionalsin Nevada and thus point to the magnitude and scope of health workforce shortages across regions ofthe state. Urban counties include Carson City, Clark and Washoe Counties. Rural counties refer to theremaining fourteen counties in Nevada. In general, urban areas of the state possess higher per capitalevels of licensed health professionals – particularly medical and surgical specialists – than sparselypopulated and isolated rural and frontier regions of the state. Nonetheless, in a state alreadycharacterized by health workforce deficits compared to other states in the region and nation, severeshortages of primary care and basic ancillary health professionals exist across many regions of thestate.Table 11 highlights important differences between the state’s three urban counties and fourteen ruraland frontier counties in terms of the current number of licensed health professionals per 100,000population. Shaded cells indicate the region of the state with the lowest per capita number of healthprofessionals. With few exceptions, the per capita number of licensed health care workers issignificantly lower in rural versus urban counties, including medicine and primary care, registered andlicensed practical nursing, dentists and hygienists, pharmacy, and most licensed mental health andallied health professions. Rural and frontier counties possess a much smaller number of allopathic andosteopathic physicians and non-physician primary care providers per capita – deficits affecting theclinical capacity of rural safety net providers already at a competitive disadvantage versus urbanfacilities in terms of their ability to recruit and retain health professionals.Table 12 provides a summary of the estimated population in Nevada who reside in Health ProfessionalShortage Areas (HPSAs) by county of residence and type of HPSA. Currently, 34.4 percent of the stateor an estimated 982,117 Nevadans live in a primary care HPSA. Over half of the state’s rural andfrontier population live in primary care HPSAs as compared to just over one-third of the state’s 2.6million urban residents. In 2017, an estimated 143,821 rural residents and 775,735 urban residents inNevada lived in a dental HPSA. While dental workforce shortages are less severe than primary care andmental health workforce shortages, 31.7 percent of the state’s population continue to reside in dentalhealth shortage areas and 8 out of 14 of the state’s rural and frontier counties are entire-county dentalHPSAs. Finally, Table 12 highlights the scope and severity of the state’s mental health workforceshortages. Currently, the entire population in 16 of the 17 counties in Nevada resides in a mental HPSA,including all rural and frontier regions of the state and both urban counties of northern Nevada.Maps 1 through 9 highlight geographic variation in the per capita number of health professionals inNevada. This section of the chart book includes current information on regions of the state designatedas Health Professional Shortage Areas (HPSA) by the federal Health Resources and ServicesAdministration (HRSA), including the number of Nevadans residing in primary care, mental health, anddental HPSAs. The geographical maldistribution of health professionals is a fundamental feature ofhealth workforce shortages in Nevada. Maps 1 through 3 highlight the extent of primary care shortagesacross most regions of the state, the absence of shortage designations in suburban census tracts ofClark County and urban regions of northern Nevada, and the presence of primary care shortage areasin the urban core of both Clark and Washoe Counties. Maps 4 through 6 depict the comparatively lessHealth Workforce Supply in Nevada – 2017 EditionOffice of Statewide Initiatives4
Health Workforce in Nevada Report 2017severe, yet extensive regions of the state designated as dental HPSAs, the absence of dental shortagedesignations in suburban census tracts of Clark County and urban regions of northern Nevada as wasthe case with primary care HPSAs, and the presence of dental shortage areas in the urban core orcentral census tracts of both Clark and Washoe Counties. Finally, the current geographic distributionof mental HPSAs are highlighted in stark detail in maps 7 through 9 for the entire state of Nevada, aswell as urban census tracts in Clark County and northern Nevada.Health Workforce Supply in Nevada – 2017 EditionOffice of Statewide Initiatives5
Health Workforce in Nevada Report 2017Figure 2: Number of Licensed Allopathic Physicians (MDs)per 100,000 Population in Nevada – 2006 to ural andFrontierNevada –Total020062008201020122014Figure 3: Number of Licensed Registered Nurses (RNs)per 100,000 Population in Nevada – 2006 to rbanSouth504.0Rural andFrontier612.5582.7UrbanNorth424.3Nevada –Total2000200620082010Health Workforce Supply in Nevada – 2017 Edition2012Office of Statewide Initiatives201420166
Health Workforce in Nevada Report 2017Table 1: Licensed Physicians and Physician Assistants in NevadaLicensed Health Professionals200620082010201220142016Change– 2006to 2016NumberAllopathic Physicians c Physicians (DOs)448461497536595688240Allopathic Physician Assistants c Physicians (MDs)154.9159.1168.5171.3171.4173.919.1Osteopathic Physicians (DOs)17.116.818.419.520.923.56.4Allopathic Physician Assistants 51.7Osteopathic Physician Assistants (PAs)Number per 100,000 PopulationOsteopathic Physician Assistants (PAs)Sources: Nevada State Board of Medical Examiners (2006, 2008, 2010, 2012, 2014, 2016), Nevada State Board of Osteopathic Medicine (2006,2008, 2010, 2012, 2014, 2016), Nevada State Board of Nursing (2006, 2008, 2010, 2012, 2014, 2016), Nevada State Demographer’s Office(2006, 2008, 2010, 2012, 2014, 2016).Table 2: Licensed Nurses in NevadaLicensed Health Professionals2006Change– 2006to d Nurses (RNs)Advanced Practitioners of Nursing (APNs)Licensed Practical Nurses (LPNs)Registered Nurse Anesthetists (CRNAs)RNs with EMS 9104.7108.01.0Registered Nurse Anesthetists (CRNAs)2.92.62.82.73.03.20.4RNs with EMS 62.6276.5277.854.6Certified Nursing Assistants (CNAs)Number per 100,000 PopulationRegistered Nurses (RNs)Advanced Practitioners of Nursing (APNs)Licensed Practical Nurses (LPNs)Certified Nursing Assistants (CNAs)Source: Nevada State Board of Nursing (2004, 2006, 2008, 2010, 2012, 2014), Nevada State Demographer’s Office (2004, 2006, 2008, 2010,2012, 2014).Health Workforce Supply in Nevada – 2017 EditionOffice of Statewide Initiatives7
Health Workforce in Nevada Report 2017Figure 4: Number of Licensed Advanced Practitioners of Nursing (APNs) andPhysician Assistants (PAs) per 100,000 Population in Nevada – 2006 to 010201220142016Figure 5: Number of Alcohol, Drug, and Gambling (ADG) Counselors, LicensedClinical Social Workers (LCSWs), Psychologists, and Psychiatrists per 100,000Population in Nevada – 2006 to 2016605040200845.048.4ADG 2Health Workforce Supply in Nevada – 2017 Edition2014Office of Statewide InitiativesPsychologistsPsychiatrists20168
Health Workforce in Nevada Report 2017Table 3: Licensed Mental and Behavioral Health Professionals in NevadaLicensed Health Professionals201220142016Change– 2006to 2016200620082010Alcohol, Drug, and Gambling Counselors–1,2331,3061,2631,2771,224-9Clinical Professional Counselors––2847–9971Licensed Clinical Social Workers 216913919518219038–31133436837339079Alcohol, Drug, and Gambling Counselors–45.048.445.943.442.1-3.2Clinical Professional Counselors––1.01.7–3.42.3Licensed Clinical Social Workers (LSCWs)–19.819.921.721.323.84.0Marriage and Family .50.5–11.412.413.413.213.32.0NumberMarriage and Family TherapistsPsychiatristsPsychologistsNumber per 100,000 PopulationPsychiatristsPsychologistsSource: Nevada State Board of Medical Examiners (2006, 2008, 2010, 2012, 2014, 2016), Nevada State Board of Psychological Examiners (2008,2010, 2012, 2014), State of Nevada Board of Examiners for Marriage & Family Therapists and Clinical Professional Counselors (2010,2012, 2014), State of Nevada Board of Examiners for Social Workers (2008, 2010, 2012, 2014), Nevada State Board of Examiners forAlcohol, Drug, and Gambling Counselors (2008, 2012, 2014), Nevada State Demographer’s Office (2008, 2010, 2012, 2014, 2016).Health Workforce Supply in Nevada – 2017 EditionOffice of Statewide Initiatives9
Health Workforce in Nevada Report 2017Figure 6: Number Licensed Dentistsper 100,000 Population in Nevada – 2006 to 4030Urban South39.327.1Urban NorthRural andFrontier2010Nevada – Total020068070602010201220142016Figure 7: Number Licensed Pharmacistsper 100,000 Population in Nevada – 2006 to 201610090200891.576.376.274.679.878.678.479.9Urban South79.673.7Urban North504039.837.740.038.742.241.5Rural andFrontier302010Nevada – Total0200620082010Health Workforce Supply in Nevada – 2017 Edition2012Office of Statewide Initiatives2014201610
Health Workforce in Nevada Report 2017Table 4: Licensed Dentists and Dental Hygienists in NevadaLicensed Health Professionals200620082010201220142016Change– 2006to 4.554.953.732.0Registered Dental Hygienists (RDHs)37.036.237.537.237.035.7-1.4Registered Dental Hygienists (RDHs)Number per 100,000 PopulationSource: Nevada State Board of Dental Examiners (2004, 2006, 2008, 2010, 2012, 2014, 2016). Nevada State Demographer’s Office (2004, 2006,2008, 2010, 2012, 2014, 2016).Table 5: Licensed Pharmacists and Pharmacy Technicians in NevadaLicensed Health Professionals200620082010201220142016Change– 2006to 2399Pharmacy 1.589.8Number per 100,000 PopulationPharmacistsPharmacy TechniciansSource: Nevada State Board of Pharmacy (2004, 2006, 2008, 2010, 2012, 2014, 2016). Nevada State Demographer’s Office (2004, 2006, 2008,2010, 2012, 2014, 2016).Health Workforce Supply in Nevada – 2017 EditionOffice of Statewide Initiatives11
Health Workforce in Nevada Report 2017Figure 8: Number of Dispensing Opticians, Dispensing Optician Apprentices, andOptometrists per 100,000 Population in Nevada – 2006 to 10201220142016Figure 9: Number of Occupational Therapists (OTs), Physical Therapists (PTs), andRespiratory Therapists (RTs) per 100,000 Population in Nevada – 2006 to 200620082010Health Workforce Supply in Nevada – 2017 Edition2012Office of Statewide Initiatives2014201612
Health Workforce in Nevada Report 2017Table 6: Licensed Allied Health Professionals in NevadaLicensed Health Professionals200620082010201220142016Change– 2006to 2016NumberAudiologistsChiropractorsDispensing OpticiansDispensing Optician ApprenticesEMS – Emergency RespondersEMS – Emergency Medical Technicians (EMTs)EMS – Advanced EMTsEMS – ParamedicsMedical Laboratory TechnologistsMedical Laboratory TechniciansMedical Laboratory AssistantsMedical Laboratory DirectorsOccupational Therapists (OTs)OptometristsPhysical Therapists (PTs)Physical Therapy Assistants (PTAs)PodiatristsRespiratory TherapistsSpeech Language 9924328711736014827561515Number per 100,000 PopulationAudiologistsChiropractorsDispensing OpticiansDispensing Optician ApprenticesEMS – First RespondersEMS – Emergency Medical Technicians (EMTs)EMS – Advanced EMTsEMS – ParamedicsMedical Laboratory TechnologistsMedical Laboratory TechniciansMedical Laboratory AssistantsMedical Laboratory DirectorsOccupational Therapists (OTs)OptometristsPhysical Therapists (PTs)*Physical Therapy Assistants (PTAs)PodiatristsRespiratory TherapistsSpeech Language .60.615.816.6Source: Nevada Board of Examiners for Audiology and Speech Pathology (2006, 2008, 2010,2012, 2014, 2016), Chiropractic Physicians’ Board of Nevada(2004, 2006, 2008, 2010, 2012, 201, 2016), Nevada Department of Health and Human Services, Nevada State Health Division (2006, 2008, 20102012, 2014, 2016), Emergency Medical Services & Trauma System, Southern Nevada Health District (2006, 2008, 2010, 2012, 2014, 2016),Nevada Board of Dispensing Opticians (2006, 2008, 2010, 2012, 2014, 2016), Nevada State Board of Optometry (2006, 2008, 2010, 2012, 2014,2016), Nevada State Board of Podiatry (2006, 2008, 2010, 2012, 2014, 2016), Nevada State Board of Medical Examiners (2006, 2008, 2010,2012, 2014, 2016), Nevada Board of Examiners for Audiology and Speech Pathology (2006, 2008, 2010, 2012, 2014, 2016). Bureau of HealthCare Quality & Compliance, Nevada State Health Division (2006, 2008, 2010, 2012, 2014, 2016), Nevada State Board of Physical Therapy (2006,2008, 2010, 2012, 2014), Nevada State Demographer’s Office (2006, 2008, 2010, 2012, 2014,2016). Data marked with an asterisk (*) are themost current available (2014).Health Workforce Supply in Nevada – 2017 EditionOffice of Statewide Initiatives13
Health Workforce in Nevada Report 2017Figure 10: State Health Workforce RankingsNumber of Licensees per 100,000 Population in Nevada117.4105.910075Nevada Rank: 47th46.035.550Nevada Rank: 30thNevada30.916.825Top U.S. StateBottom U.S. State0General/Family Practice (MD & DO)Internal Medicine (MD & DO)Source: Area Health Resources File (2017). More information available at http://ahrf.hrsa.gov/Figure 11: State Health Workforce RankingsNumber of Licensees per 100,000 Population in Nevada10075502566.5Top U.S. StateNevada Rank:Nevada Rank: 48th11.08.651stNevadaBottom U.S. State14.95.85.80Pediatrics (MD & DO)Orthopedic Surgery (MD & DO)Source: Area Health Resources File (2016). More information available at http://ahrf.hrsa.gov/Health Workforce Supply in Nevada – 2017 EditionOffice of Statewide Initiatives14
Health Workforce in Nevada Report 2017Table 7: State Health Workforce Rankings – Number of Physicians with an Active Licenseper 100,000 Population in Nevada and the United StatesLicensed PhysiciansNumber per 100,000 PopulationNevadaRankNevadaRateTop U.S.StateU.S.AverageBottomU.S. StateMedicine and Primary CarePhysicians (MDs & DOs)Patient Care Physicians (Active MDs & DOs)Patient Care Physicians (MDs & DOs)Patient Care Primary Care Physicians (MDs & DOs)Primary Care Physicians (MDs & DOs)Residents and Fellows in ACGME-Accredited ProgramResidents and Fellows in ACGME-Accredited Primary CarePhysicians in Medical SpecialtiesPhysicians in Surgical .5223.2188.4180.058.185.52.01.941.135.2Physicians in Allergy and ImmunologyPhysicians in Anesthesiology (MDs & DOs)Physicians in Cardiovascular DiseasePhysicians in Child PsychologyPhysicians in Colon/Rectal SurgeryPhysicians in DermatologyPhysicians in Diagnostic RadiologyPhysicians in Emergency Medicine (MDs & DOs)Physicians in Forensic PathologyPhysicians in GastroenterologyPhysicians in General Surgery (MDs & DOs)Physicians in General/Family Practice (MDs & DOs)Physicians in Internal Medicine (MDs & DOs)Physicians in NeurologyPhysicians in Neurological SurgeryPhysicians in Obstetrics and Gynecology (MDs &DOs)Physicians in OphthalmologyPhysicians in Orthopedic Surgery (MDs and DOs)Physicians in OtolaryngologyPhysicians in PathologyPhysicians in Pediatrics (MDs & DOs)Physicians in Physical Medicine & Rehab (MDs & DOs)Physicians in Plastic SurgeryPhysicians in Pulmonary DiseasePhysicians in Psychiatry (MDs & DOs)Physicians in RadiologyPhysicians in Radiological OncologyPhysicians in Thoracic SurgeryPhysicians in e: Health Resources and Services Agency. Area Health Resources File (2017).Notes: All physician data is for allopathic physicians unless otherwise noted. All data is for 2014 unless otherwise noted.Health Workforce Supply in Nevada – 2017 EditionOffice of Statewide Initiatives15
Health Workforce in Nevada Report 2017.Figure 12: State Health Workforce RankingsNumber of Licensees per 100,000 Population in Nevada146.5140120100Top U.S. State75.080Nevada Rank: 38thNevada Rank: 51st6039.640NevadaBottom U.S. State39.626.0205.60Advanced Practice RNsPhysician Assistants (in clinical practice)Source: Area Health Resources File (2017). More information available at http://ahrf.hrsa.gov/Figure 13: State Health Workforce RankingsNumber of Licensees per 100,000 Population in Nevada227.4200150Top U.S. StateNevada1005048.4Nevada Rank: 47Nevada Rank: 38ththBott
Health Workforce Supply in Nevada - 2017 Edition 3 . emergency medicine (38th), internal medicine (3 0th), anesthesiology (23rd), plastic surgery (26th), colorectal surgery (39th), physical medicine and rehab (25th), forensic patholo gy (12th), and physician assistants in clinical practice (38th). One of the most striking features of Table 8 is that the non-physician health professions .