Transcription
Issuesin Guaglianone,Teacher Education,Spring2009Curtis L.MaggiePayne,Gary W. Kinsey, & Robin Chiero129Teaching Performance Assessment:A Comparative Study of Implementation and Impactamongst California State University CampusesCurtis L. GuaglianoneCalifornia State University, BakersfieldMaggie PayneCalifornia State University, ChicoGary W. KinseyCalifornia State Polytechnic University, Pomona& Robin ChieroCalStateTEACH, California State University, FresnoConcerns about teacher competency have existed since the beginnings of public education in the nineteenth century (Arends, 2006).While research clearly indicates that teacher quality is a critical factorimpacting student achievement in schools, how best to define and measure teacher quality is still widely debated. Amid the increasing callsfor teacher accountability have come challenges to teacher preparationprograms to demonstrate their effectiveness, resulting in a variety ofreforms to create more rigorous preparation, certification, and licensing. (Darling-Hammond, Pacheco, Michelli, LePage, Hammerness, &Youngs, 2005; Goldhaber, 2002; Pecheone & Chung, 2006).In California, a substantial transformation of teacher preparationwas launched by the 1998 passage of Senate Bill 2042, which created newCurtis L. Guaglianone is the assistant to the Provost for Program Development at California State University, Bakersfield, Bakersfield, California;Maggie Payne is the associate dean of the College of Communication andEducation at California State University, Chico, Chico, California; GaryW. Kinsey is the interim associate dean of the College of Education atCalifornia State Polytechnic University, Pomona, Pomona, California;and Robin Chiero is the regional director of CalStateTEACH at CaliforniaState University, Fresno, Fresno, California.Volume 18, Number 1, Spring 2009
130Teaching Performance Assessmentstandards for subject matter preparation, professional preparation andinduction, and which included the requirement for teacher preparationprograms to institute “systematic and psychometrically sound teachingassessments. . . to confirm the quality of the teaching workforce and increase public confidence in teachers, teaching and teacher preparation”(Sandy, 2006, p. 17).Purpose of the StudyThis article is based on the perceptions of California State Universityadministrators and provides a comparative study of the challenges andbenefits resulting from the implementation of the teaching performanceassessment requirement of SB 2042 standards 19-21 on the CaliforniaState University (CSU) campuses. With 23 campuses and almost 450,000students, the CSU system is the largest and most diverse universitysystem in the country, and it produces 55% of California’s teacher education graduates each year.Assessing Pre-Service TeachersAlthough examinations for pre-service teachers are not new, traditional teacher licensure tests, which typically focus on basic skills, subjectmatter knowledge and pedagogical knowledge, have been criticized foroversimplification of teaching; failure to measure candidates’ abilityto synthesize subject matter, students, and context to make decisions;weakness regarding predictive validity; and adverse impact on minorities(Porter, Youngs & Odden, 2001; Goldhaber, 2002; Pecheone & Chung,2006). A further concern as program administrators begin to connectteacher quality at the pre-service level to student achievement is reflected in standard 1 of the National Council for Accreditation of TeacherEducation (NCATE), which requires that candidates demonstrate theability to assess student learning and use the results to inform instruction (Mitchell, Allen & Ehrenburg, 2006).The concerns about forced response tests and the need to addressthe increasing emphasis on external accountability have led to thedevelopment of standards-based performance assessments in teachereducation (Arends, 2006). Darling-Hammond and Snyder (2000) suggestthat there are positive side effects to the use of authentic performanceassessments that incorporate the teaching context. Among these effectsis their potential for influencing teachers’ and their students’ learning.In examining pre-service teachers’ experiences with the PerformanceAssessment for California Teachers, for example, Chung (2008) indicatedthat in addition to expanding their teaching knowledge and skills, theIssues in Teacher Education
Curtis L. Guaglianone, Maggie Payne, Gary W. Kinsey, & Robin Chiero131candidates’ teaching was impacted by “(1) a shift from concern withteacher activities, activity structures, or student engagement to a greaterconcern with student learning; and (2) increased awareness of the needfor strategies to reach English learners” (p. 17). Other positive side effectsof authentic performance assessments suggested by Darling-Hammondand Snyder (2000) include their use for program improvement andtheir potential for increasing collaboration and communication amongthose involved in the preparation of teachers, both in the higher education institution and in the P-12 schools. California’s requirement thateach candidate pass a Teaching Performance Assessment is consistentwith recent trends suggesting that performance assessments that arecontextualized in the field more adequately judge beginning teacherpedagogical competence (Pecheone & Chung, 2006).A major consideration in the implementation of performance assessments, however, is their cost. Porter, Youngs, and Odden (2001)reviewed a variety of performance assessments developed and adoptedduring the late 1990s and concluded that the implementation of suchassessments is an expensive proposition. Main factors in the cost ofimplementation include the development or purchase of an assessmentsystem; training assessors; administering the assessment; and scoringthe assessments. As examples, they stated that the high cost of implementing Praxis III resulted in the development of a modified version,Pathwise. In addition, they cited the 1997 implementation of BEST inConnecticut, which cost the state 3.6 million. Indeed, the implementation of the California teaching performance assessment was initiallyput on hold for three years pending the provision of adequate fundingresources. Although state-funding support has still not materialized,the decision was made to go forward with mandated implementationin 2008-09. While the performance assessment is generally seen as arigorous measure demonstrating a high level of teacher preparation forlicensure, as Sandy (2006) warns, “the absence of a firm commitmentfrom the state to support and sustain this work will undermine its effectiveness and limit its impact over time” (p. 17).Overview of the California Teaching Performance AssessmentSenate Bill 2042 required all teacher candidates to pass an assessment of teaching performance in order to earn a preliminary MultipleSubject (elementary) or Single Subject (secondary) Teaching Credential.This assessment of teaching performance is designed to measure thecandidate’s knowledge and skills in relation to California’s TeachingPerformance Expectations (TPEs). The Teaching Performance AssessVolume 18, Number 1, Spring 2009
132Teaching Performance Assessmentment (TPA) model of the California Commission on Teacher Credentialing (CCTC) is the CalTPA, which was developed in collaboration withprofessional educators and the Educational Testing Service (ETS). Whilestate law requires that teacher preparation programs implement an approved teaching performance assessment, program sponsors have beenallowed to develop alternative TPA models for approval by the Commission. Two additional models have received approval: the PerformanceAssessment for California Teachers (PACT), which was developed byStanford University and a consortium of public and private universities, and Fresno Assessment of Student Teachers (FAST), which wasdeveloped by California State University, Fresno, and is approved solelyfor its use (CTC, 2008).While differences exist between these models, each is a comprehensiveassessment comprised of multiple tasks that require teacher candidatesto demonstrate the proficiencies delineated in the TPEs in a classroomsetting. These proficiencies include understanding students and the schoolcontext; effective planning of instruction and assessment; adaptation ofinstruction and assessment for students with special needs, includingEnglish learners; use of assessments to monitor student learning andinform instruction; and reflection on professional practice. CalTPA andPACT also require a video of the candidate working with students in theclassroom. All three of these models are in use by campuses in the CSUsystem. Of the 22 CSU campuses with teacher preparation programs,twelve use CalTPA, nine use PACT, and one uses FAST.Standards 19-21 of the Multiple and Single Subject Program Standards govern the administration of the teaching performance assessment.These standards require that each TPA be administered for validity,accuracy, and fairness. This includes ensuring “strong consistency ofscoring among assessors” and monitoring of scoring and results to “ensure equitable treatment of candidates.” In addition, each TPA mustbe evaluated by qualified educators who have been selected accordingto established criteria and undergone structured training, calibration,and re-calibration processes. Lastly, the standards require programs toannually commit “sufficient resources, expertise, and effort to its planning, coordination and implementation.” Each campus is responsible fordocumenting the administration, scoring, and reporting of the assessment in accordance with state accreditation procedures.Following assessment, candidates receive performance informationthat is clear and detailed enough to (a) serve as a useful basis for theirIndividual Induction Plans developed within an approved InductionProgram, or (b) guide them in study and practice as they prepare forreassessment as needed. Individual results of the assessment are usedIssues in Teacher Education
Curtis L. Guaglianone, Maggie Payne, Gary W. Kinsey, & Robin Chiero133as one basis for recommending candidates for Preliminary TeachingCredentials, and aggregated assessment results are used in appropriateways to improve programs.Methodology of the StudyThe deans and associate deans of education from 22 CSU campusesacross the state meet quarterly to conduct system-wide business, collaborate on important initiatives, and forge a strategic direction for collegesand schools of education throughout the system. A main topic of the summer 2008 meeting was the implementation of the California TeachingPerformance Assessment (TPA). It became clear during discussions of thistopic that each of the 22 campuses had different understandings of theprotocol for implementation; plans for application of the standards; andchallenges in funding, support, collaboration, and achievement of goals.Both among and within the three similar models there were variationsin implementation plans. The concerns resulting from this disparity inresponses to the implementation mandate resulted in the convening ofa task force to develop a comparative study of campus practices relatedto the TPA. Representatives from four southern California and fournorthern California campuses agreed to meet together to carry out thisstudy. Task force members represented expertise in each of the threeTPA models.In fall 2008, the task force met via conference calls to develop andrefine items for a twenty-two-question survey. The survey was sent todeans of education at the 22 campuses with teacher preparation programs.CalStateTEACH, a CSU statewide, fully online preparation program forelementary sachool teachers was not included in this survey.The campuseshad two weeks to complete the survey and return it for comparison. Thetask force requested that individuals most knowledgeable about the TPAon each campus should write the responses. Associate deans completedmost surveys, with others completed by either the dean, the TPA coordinator, or the assessment coordinator. Of the 22 campuses, 19 returnedthe survey. The surveys were completed electronically and the responsesaggregated for each item. The task force was then provided a Web link toview the results, and a sub-committee of the task force analyzed the dataand summarized the findings. A report on the findings was presented atthe fall 2008 meeting of the CSU deans and associate deans.The survey questions fell within nine clusters: (1) number of students and tasks by TPA type; (2) staffing; (3) training and scoring; (4)technology support; (5) remediation/resubmission; (6) costs and funding; (7) collaboration; (8) lessons learned; and (9) next steps. The list ofVolume 18, Number 1, Spring 2009
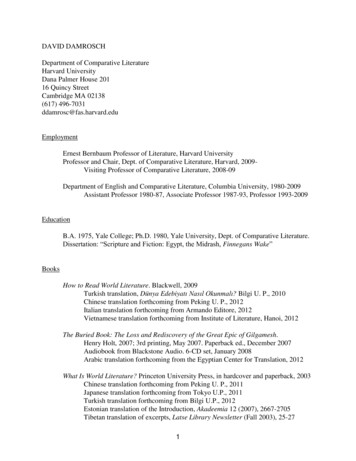
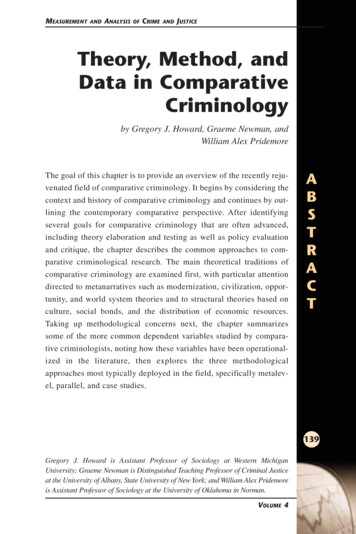
134Teaching Performance AssessmentTable 1CSU Teaching Performance Assessment SurveyClusterSurvey Item1234567891. Projected number of students in your programs for 2008/09.2. Number of Tasks that you will score during AY 2008/09.3. Do you have or plan to have someone assigned with responsibilityfor TPA/PACT coordination?4. Do you have or plan to have one or more individual(s) assignedto assist the TPA/PACT Coordinator including anticipatedclassification, time base, and primary responsibilities?5. Do you have or plan to have someone who serves as overallAssessment Coordinator with responsibilities beyond TPA/PACTcoordination including classification, time base, and primary responsibilities?6. Do you have other coordination time that is assigned to TPAimplantation, advising, assessing, etc.?7. Do you, or do you intend to, pay a stipend for the participationof those who become trained TPA Assessors/PACT scorers?8. What are your current thoughts (plans?) about compensation forassessors/scorers? Is scoring of TPA tasks/PACT Teaching eventspart of faculty workload?9. How many trainers of assessors will you need during AY 2008/09?10. How many scorers will you need during AY 2008/09?11. How much is the stipend you pay for assessing TPAs?12. Is there a particular software package or portfolio system youare using to manage TPA data?13. How are you handling equipment costs (digital cameras,tripods, microphones)?14. Have you made any projection regarding your costs and sourcesof funding related to remediation and resubmission? If so, pleasedescribe your current projections or considerations.15. What are the additional assignments and costs associated withTechnical Assistance Meetings, Consortia Meetings, Training ortrainers Meetings, etc.?16. What are your sources of funding related to TPA implementation?17. Other costs, concerns, commitments resulting from TPAs?18. Has the TPA implementation been an impetus for additionalcollaboration with P-12 or with other campuses?19. What have you discovered or learned during the pilot regardinghow performance assessment benefits your candidates, program,and faculty?20. What “next steps” could the Education Deans’ group take thatwould be most helpful to you as you prepare to begin theimplementatin this year?21. What other information, if any, would you like to have fromother campuses that might help you with planning, structuring,staffing, and/or implementing?22. Please explain any above item that you feel may need furtherexplanation due to unique circumstances on your campus.Issues in Teacher Education
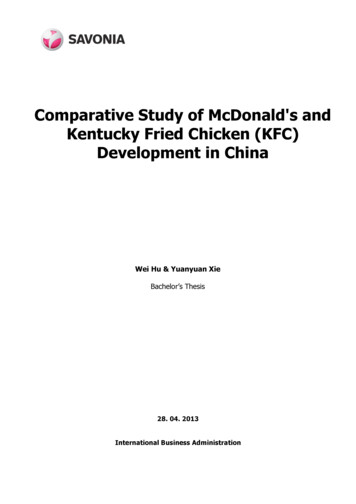
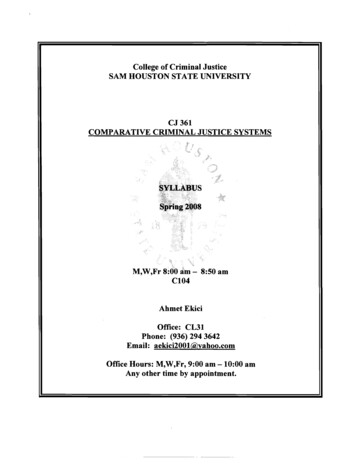
Curtis L. Guaglianone, Maggie Payne, Gary W. Kinsey, & Robin Chiero135survey questions is presented in Table 1. The campuses had two weeksto complete the survey and return it for comparison.It is important to keep in mind that the questions were of a speculative nature. Although many campuses had piloted or conducted portions of the assessment prior to July 2008, full implementation was notrequired until academic year 2008-09. Therefore, the data and narrativeresponses requested in the survey were in many instances projectionsand estimations. The fact that these numbers were estimates and thatsome policy decisions were still undetermined may have discouragedresponses to some questions and may account for the failure of threecampuses to return the survey.Limitations of the StudyAs previously mentioned, data gathered were of a somewhatspeculative nature. The implementation of the TPA was mandated forcandidates beginning their credential programs after July 1, 2008, soin many cases, campuses had not yet fully implemented. In addition,although there was a high response rate (19 of 22 campuses, or 86%),three campuses were not included in the data. Their responses wouldhave provided a more complete picture of projected implementation.FindingsFor purposes of this discussion, the clusters of responses are organizedinto two categories: challenges and benefits. Because of the concernsabout the lack of earmarked state funding support for implementationof the teaching performance assessment, challenges refer to any aspectsof implementation that are associated with costs. Benefits refer to thoseresults of the assessment implementation that relate to the positiveeffects of authentic, context-based teaching performance assessments.ChallengesEach of the campuses was asked to indicate the number of candidatesenrolled in their elementary and secondary programs in the 2008-09implementation year. Of the 22 campuses surveyed, 19 responded. Theresults are presented by total number of candidates in ascending orderin Table 2.The size of the CSU teacher preparation programs varies widely,from fewer than 100 candidates to over 2000. This variation createssignificant differences in how implementation of the teaching performance assessment will impact campuses in terms of demands on fiscaland human resources. It is important to note that the numbers in TableVolume 18, Number 1, Spring 2009
136Teaching Performance AssessmentTable 2Number of Candidates per Respondent Campus,Unduplicated Count in Ascending OrderCampusTotalMultiple Subject Single Subject(Elementary)(Secondary)HumboldtChannel IslandsSan Luis ObispoChicoSacramentoSan DiegoDominguez HillsSan FranciscoSan MarcosEast BayStanislausPomonaLos AngelesNorthridgeSan BernardinoFullertonBakersfieldFresnoLong 5012832182 reflect total numbers of candidates enrolled in programs, not all ofwhom will complete the assessment in 2008-09. In addition, as this is aheadcount, it does not reflect the number of teaching performance assessment tasks to be scored. The California TPA and FAST models arecomposed of four separate tasks, while PACT has one comprehensiveteaching event completed by all candidates with three additional teaching tasks for Multiple Subject (elementary) candidates. For all of themodels, there is an additional requirement for random double scoringof a percentage of the tasks to insure inter-rater reliability.StaffingA major concern in the implementation of the teaching performanceassessment is how to provide adequate oversight and management ofthe many related responsibilities. All 19 of the campuses that respondedto the survey indicated that they had or planned to have a person assigned responsibility for TPA coordination, although only 18 campusesIssues in Teacher Education
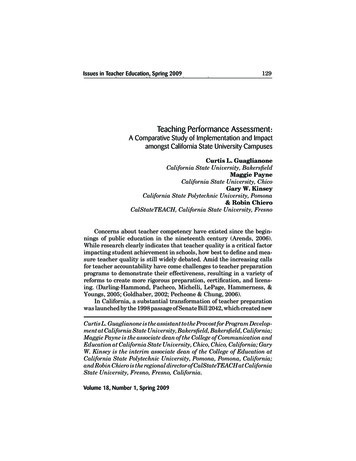
Curtis L. Guaglianone, Maggie Payne, Gary W. Kinsey, & Robin Chiero137provided information about that role. A summary of their responses isprovided in Table 3.Of the campuses responding, the largest number (9) indicated thatthis role was assigned to a tenure-track faculty member. Five of thecampuses indicated that an administrator, typically an associate dean,fulfilled this role, while the remaining four campuses indicated that thisrole had been assigned to a part-time, non-tenure-track faculty member.For tenure-track faculty in this role, assigned time for TPA coordination varied from a one-course reduction to a full-time assignment. Inone case, an additional summer stipend was included. Administratorsfulfilling this role typically estimated that they devoted 18 to 20 hoursper week to TPA coordination, while part-time faculty typically receiveda one-course assignment for this work. While smaller programs weremore likely to assign this role to an administrator, and mid-size to largeprograms were more likely to use a tenure-track faculty member, parttime faculty fulfilled this role for mid-size programs as well as for thelarger programs, and an associate dean fulfilled the role in the largestprogram in the CSU system. The impact of the size of the program indetermining how to assign this role is, therefore, unclear. Certainly concerns for cost effectiveness may play a role, as part-time faculty time isless costly. If an average salary for an associate professor is 75,000, forexample, there would be an average cost of .58 FTE per campus equalto 43,500 per campus and 957,000 for the 22 campus CSU System.Nevertheless, competing concerns for consistency and longevity mayexplain the greater use of tenure-track faculty and administrators.Among the responsibilities identified for this position in the surveyresponses were the following: work with programs to integrate preparation for and completion of teaching performance assessment tasks into curriculumas appropriate; ensure accessibility to information regarding the teachingperformance assessment for students, faculty, and scorers;Table 3TPA Coordinator AssignmentsTPA CoordinatorNumber of Campuses(N 18)Assigned TimeTenure-track facultyLecturerAdministrator9 (50%)4 (22.2%)5 (27.8%).25-1.0 of workload1-1.5 course release18-20 hours per weekVolume 18, Number 1, Spring 2009
138Teaching Performance Assessment create, manage, and monitor TPA budget; manage the consent process, especially for videotaping; manage equipment, including purchase, maintenance, andcheckout; work with programs to ensure an adequate supply of qualifiedtrainers and scorers; coordinate local training, calibration, and re-calibration activities; report scores to candidates; coordinate remediation process; maintain ongoing communication with TPA external coordinators; coordinate use of the electronic platform; and assist with analysis of data and preparation of reports forinternal and external review.In the survey, the campuses were also asked if they had or plannedto have one or more individuals assigned to assist the TPA Coordinator.Of the 18 campuses that responded, 16 (88.9%) responded affirmatively.Seven campuses (43.7%) indicated that they would assign a tenuretrack faculty member for this role, two campuses (12.5%) would assigna part-time faculty member, five campuses (31.3%) would assign a staffmember, and two campuses (12.5%) would assign student assistants.Calculations were made using an average professor’s salary of 75,000,an average staff salary of 35,000, and an average student salary of 23,400. The average cost per responding campus would be 11,316 percampus or a total of 248,952 for the CSU system.Another cost added to the accountability model for educator preparation is the need for academic unit assessment coordinators. Although thisposition is not related exclusively to teacher performance assessment, itclearly adds to the overall cost of operation and makes use of TPA data forperformance measures. Fourteen campuses reported having an assessmentcoordinator. Assigned time ranged from .25 to 1.0 FTE. The cost associatedwith the 14 campuses, with the same values as the above paragraph, is anaverage of 48,750 per campus and 1,072,500 for the CSU system.Scoring the AssessmentsSeveral of the survey questions focused on plans for training scorers and scoring the assessments. The question regarding stipends forIssues in Teacher Education
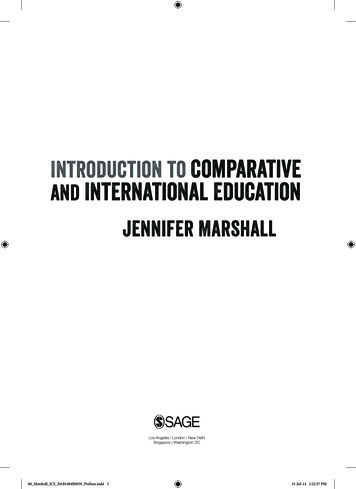
Curtis L. Guaglianone, Maggie Payne, Gary W. Kinsey, & Robin Chiero139training to become an assessor or scorer was not clear, and only fivecampuses responded to this question directly. One campus did not offer compensation for training, one campus paid 91 per day, and threeother campuses paid 100, 150, or 200 per day. There was an averageof 24.5 assessors/scorers needed per responding campus. Given thesecampus responses, an average cost per campus for scorer training at thesame average pay rates listed above would cause responding campusesto realize an average cost of 13,440. That means that the CSU systemmight pay 282,240 to train TPA assessors/scorers.The campuses were also asked who the scorers would be and whetherand how they would be compensated. Among the groups identified aspotential scorers were tenure-track faculty, lecturers, university supervisors, retired teachers and administrators, teachers, and districtand county office personnel. The plans for compensating scorers aresummarized in Table 4.For both the CalTPA and the PACT campuses, paying a stipendwas the most common approach to compensating scorers, and there wassome variation in the amounts of the stipends. CalTPA campuses paidsmaller amounts for the first three tasks of the assessment and typicallytwice as much for the more comprehensive fourth task. Consideringthe scoring as part of a faculty member’s workload was less commonfor PACT campuses than for CalTPA campuses or the FAST campus.This is likely due to the structure of the latter two assessments as fourseparate tasks that are more easily embedded in course work, as opposedTable 4Compensation for Scoring by Assessment ModelCompensation PlanNumber of CampusesAmount of CompensationCalTPAPart of workload3 (33.3%)Stipend6 (66.7%)Assigned time0 (0%)N/ATasks 1-3 25- 40 each,Task 4 50- 80N/APACT1 (11.1%)Part of workloadStipend4 (44.4%)Assigned time2 (22.2%)To be determined2 (22.2%)N/A 50- 100 per Teaching Event1 unit per 5-7Teaching EventsTBDFASTPart of workloadN/A1 (100%)Volume 18, Number 1, Spring 2009
140Teaching Performance Assessmentto the single comprehensive teaching event in the PACT assessment,which can take as much as three hours or more to score. Using a unit ofassigned time as compensation for scoring was less common, yet usedby a few campuses. At standard replacement rate, even at seven teaching events per unit, this approach is over twice as costly as the higheststipend amount considered.To understand the magnitude of the scoring costs, it must be understood that for the CalTPA campuses responding, the number of tasksto be scored, at four tasks per candidate, ranged from 410 to over 3,000tasks. For the PACT campuses, the number of teaching events to bescored ranged from 165 to 367. An average cost to CalTPA campuses is 100 per candidate. The average cost per for PACT campuses is 106per candidate. If there were an average of 501 candidates per campus(see Table 2), the cost per campus would be 103 per candidate, equalto a total of 51,603. Including 10% double scoring brings that total to 56,763. Multiplying that amount by 22 campuses comes to an overallCSU System cost of 1,248,786.Ongoing training, calibration, and professional development areessential components to the reliability of the assessment scoring. Sevencampuses did not report a specific plan for addressing these components,and the FAST campus provided in-house professional development related to the TPA. Of the nine campuses reporting that they were sendingor planning to send faculty for ongoing professional development, costamounts ranged from 3000 to 12,000. An average cost of 7,013 percampus should be projected. The CSU System would then realize a costof 154,286 per year to provide professional development for TeacherPerformance Assessment scorers.Remediation/ResubmissionFor candidates who do not pass the TPA, credential programs arerequired to provide procedures for double scoring, appeal, remediation,and resubmission. Survey respondents estimated that 4-10% of candidateswould be required to resubmit all or part of the assessment. Some campusesallow for one resubmission, while others reported that two resubmissionswere allowed in order for candidates to improve their scores. Plans foraddressing this requirement varied among campuses, but, in general,double scoring and resubmission were monitored and implemented bythe TPA coordinator with faculty involvement in the remediation.Some campuses reported that remediation would be provided throughstudent teaching seminars or courses dedicated to assessment preparation or through referral to a qualified faculty member. Four campusesindicated that candidates not passing all or part of the assessment wouldIssues in Teacher Education
Curtis L. Guaglianone, Maggie Payne, Gary W. Kinsey, & Robin Chiero141be required to enroll in an additional course through extension or continuing education. The fee for the course would cover both remediationand the cost of scoring the resubmission. One campus reported that incases where the entire PACT Teaching Event needed to be repeated,candidates would be required to re-enroll in student teaching in thesubsequent semester.Technology SupportAnother major cost of TPA implementation at CSU campuses is thetechnology, software, and related support needed. The management ofTPA data from required tasks, teaching events, or other assessmentsrequires a mechanism to easily manage and track submissions, assessment scoring, and evaluator comments. A variety of software packagesand portfolio systems are available for this purpose, and campuses wereasked to indicate what they were utilizing.TaskStream was the electronic portfolio system selected by 12 of the19 CSU campuses. Two other comprehensive assessment and reportingtools, TK-20 and LiveText, are each used by one of the CSU campuses.Of the five remaining campuses surveyed, two were using variations ofTaskStream integrated with other tracking tools, two were using locallydeveloped portfolio and data management systems, and one was stillevaluating available products. The commercial systems generally involvea
Subject (elementary) or Single Subject (secondary) Teaching Credential. This assessment of teaching performance is designed to measure the candidate's knowledge and skills in relation to California's Teaching . developed by California State University, Fresno, and is approved solely for its use (CTC, 2008).