Transcription
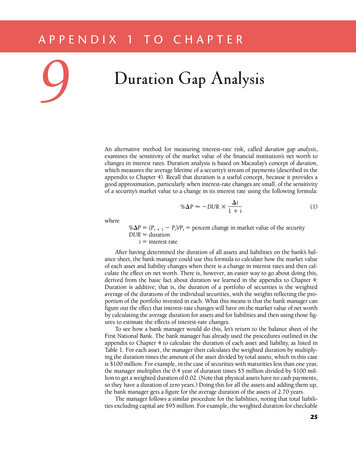
APPENDIX 1 TO CHAPTER9Duration Gap AnalysisAn alternative method for measuring interest-rate risk, called duration gap analysis,examines the sensitivity of the market value of the financial institution’s net worth tochanges in interest rates. Duration analysis is based on Macaulay’s concept of duration,which measures the average lifetime of a security’s stream of payments (described in theappendix to Chapter 4). Recall that duration is a useful concept, because it provides agood approximation, particularly when interest-rate changes are small, of the sensitivityof a security’s market value to a change in its interest rate using the following formula:%DP 2DUR 3Di11i(1)where%DP 5 (Pt 1 1 2 Pt)/Pt 5 percent change in market value of the securityDUR 5 durationi 5 interest rateAfter having determined the duration of all assets and liabilities on the bank’s balance sheet, the bank manager could use this formula to calculate how the market valueof each asset and liability changes when there is a change in interest rates and then calculate the effect on net worth. There is, however, an easier way to go about doing this,derived from the basic fact about duration we learned in the appendix to Chapter 4:Duration is additive; that is, the duration of a portfolio of securities is the weightedaverage of the durations of the individual securities, with the weights reflecting the proportion of the portfolio invested in each. What this means is that the bank manager canfigure out the effect that interest-rate changes will have on the market value of net worthby calculating the average duration for assets and for liabilities and then using those figures to estimate the effects of interest-rate changes.To see how a bank manager would do this, let’s return to the balance sheet of theFirst National Bank. The bank manager has already used the procedures outlined in theappendix to Chapter 4 to calculate the duration of each asset and liability, as listed inTable 1. For each asset, the manager then calculates the weighted duration by multiplying the duration times the amount of the asset divided by total assets, which in this caseis 100 million. For example, in the case of securities with maturities less than one year,the manager multiplies the 0.4 year of duration times 5 million divided by 100 million to get a weighted duration of 0.02. (Note that physical assets have no cash payments,so they have a duration of zero years.) Doing this for all the assets and adding them up,the bank manager gets a figure for the average duration of the assets of 2.70 years.The manager follows a similar procedure for the liabilities, noting that total liabilities excluding capital are 95 million. For example, the weighted duration for checkable25
26Appendix 1 to Chapter 9TABLE 1Duration of the First National Bank’s Assets and LiabilitiesAssetsReserves and cash itemsSecuritiesLess than 1 year1 to 2 yearsGreater than 2 yearsResidential mortgagesVariable-rateFixed-rate (30-year)Commercial loansLess than 1 year1 to 2 yearsGreater than 2 yearsPhysical capitalAverage durationLiabilitiesCheckable depositsMoney market deposit accountsSavings depositsCDsVariable-rateLess than 1 year1 to 2 yearsGreater than 2 yearsFed fundsBorrowingsLess than 1 year1 to 2 yearsGreater than 2 yearsAverage durationAmount( 102550.71.44.00.00.110.141.000. 0 0 .00.050.030.060.140.0010550.31.33.10.030.070. 1 6 1.03deposits is determined by multiplying the 2.0-year duration by 15 million divided by 95 million to get 0.32. Adding up these weighted durations, the manager obtains anaverage duration of liabilities of 1.03 years.APPLICATIONEXAMPLE 1: Duration Gap AnalysisThe bank manager wants to know what happens when interest rates rise from 10% to11%. The total asset value is 100 million, and the total liability value is 95 million.Use Equation 1 to calculate the change in the market value of the assets and liabilities.
Duration Gap Analysis27SolutionWith a total asset value of 100 million, the market value of assets falls by 2.5 million( 100 million 3 0.025 5 2.5 million):%D P 5 2DUR 3whereDi11iDUR 5 duration5 2.70Di 5 change in interest rate 5 0.11 2 0.10 5 0.01i 5 interest rate5 0.10Thus:%D P 22.70 30.015 20.025 5 22.5%1 1 0.10With total liabilities of 95 million, the market value of liabilities falls by 0.9 million( 95 million 3 0.009 5 2 0.9 million):%D P 2DUR 3whereDi11iDUR 5 duration5 1.03Di 5 change in interest rate 5 0.11 2 0.10 5 0.01i 5 interest rate5 0.10Thus:%D P 21.03 30.015 20.009 5 20.9%1 1 0.10The result is that the net worth of the bank would decline by 1.6 million (2 2.5million 2 (2 0.9 million) 5 2 2.5 million 1 0.9 million 5 2 1.6 million).The bank manager could have gotten to the answer even more quickly by calculating what is called a duration gap, which is defined as follows:DURgap 5 DURa 2 awhereAPPLICATIONL3 DUR lbA(2)DURa 5 average duration of assetsDURl 5 average duration of liabilitiesL 5 market value of liabilitiesA 5 market value of assetsEXAMPLE 2: Duration Gap AnalysisBased on the information provided in Example 1, use Equation 2 to determine the duration gap for First National Bank.
28Appendix 1 to Chapter 9SolutionThe duration gap for First National Bank is 1.72 years:DURgap 5 DURa 2 awhereL3 DUR lbADURa 5 average duration of assets 5 2.70L 5 market value of liabilities5 95A 5 market value of assets5 100DURl 5 average duration of liabilities 5 1.03Thus:DURgap 5 2.70 2 a953 1.03b 5 1.72 years100To estimate what will happen if interest rates change, the bank manager uses theDURgap calculation in Equation 1 to obtain the change in the market value of net worthas a percentage of total assets. In other words, the change in the market value of networth as a percentage of assets is calculated as:DiDNW 2DURgap 3A11iAPPLICATION(3)EXAMPLE 3: Duration Gap AnalysisWhat is the change in the market value of net worth as a percentage of assets if interestrates rise from 10% to 11%? (Use Equation 3.)SolutionA rise in interest rates from 10% to 11% would lead to a change in the market value ofnet worth as a percentage of assets of 21.6%:DNWDi5 2DURgap 3A11iwhereDURgap 5 duration gap5 1.72Di 5 change in interest rate 5 0.11 2 0.10 5 0.01i 5 interest rate5 0.10Thus:DNW0.015 21.72 35 20.016 5 21.6%A1 1 0.10With assets totaling 100 million, Example 3 indicates a fall in the market value ofnet worth of 1.6 million, which is the same figure that we found in Example 1.
Duration Gap Analysis29As our examples make clear, both income gap analysis and duration gap analysisindicate that the First National Bank will suffer from a rise in interest rates. Indeed, inthis example, we have seen that a rise in interest rates from 10% to 11% will cause themarket value of net worth to fall by 1.6 million, which is one-third the initial amountof bank capital. Thus the bank manager realizes that the bank faces substantial interestrate risk because a rise in interest rates could cause it to lose a lot of its capital. Clearly,income gap analysis and duration gap analysis are useful tools for telling a financialinstitution manager the institution’s degree of exposure to interest-rate risk.STUDY GUIDETo make sure that you understand income gap and duration gap analysis, you shouldbe able to verify that if interest rates fall from 10% to 5%, the First National Bank willfind its income increasing and the market value of its net worth rising.Example of a Nonbanking Financial InstitutionSo far we have focused on an example involving a banking institution that has borrowedshort and lent long so that when interest rates rise, both income and the net worth ofthe institution fall. It is important to recognize that income and duration gap analysisapplies equally to other financial institutions. Furthermore, it is important for you tosee that some financial institutions have income and duration gaps that are opposite insign to those of banks, so that when interest rates rise, both income and net worth riserather than fall. To get a more complete picture of income and duration gap analysis, letus look at a nonbank financial institution, the Friendly Finance Company, which specializes in making consumer loans.The Friendly Finance Company has the following balance sheet:Friendly Finance CompanyAssetsCash and deposits 3 millionSecuritiesLess than 1 year 5 million1 to 2 years 1 millionGreater than 2 years 1 millionConsumer loansLess than 1 year 50 million1 to 2 years 20 millionGreater than 2 years 15 millionPhysical capital 5 millionTotal 100 millionLiabilitiesCommercial paper 40 millionBank loansLess than 1 year 3 million1 to 2 years 2 millionGreater than 2 years 5 millionLong-term bonds andother long-term debt 40 millionCapital 10 millionTotal 100 millionThe manager of the Friendly Finance Company calculates the rate-sensitive assetsto be equal to the 5 million of securities with maturities less than one year plus the
30Appendix 1 to Chapter 9 50 million of consumer loans with maturities of less than one year, for a total of 55million of rate-sensitive assets. The manager then calculates the rate-sensitive liabilitiesto be equal to the 40 million of commercial paper, all of which has a maturity of lessthan one year, plus the 3 million of bank loans maturing in less than a year, for a totalof 43 million. The calculation of the income gap is then:GAP 5 RSA 2 RSL 5 55 million 2 43 million 5 12 millionTo calculate the effect on income if interest rates rise by 1%, the manager multiplies theGAP of 12 million times the change in the interest rate to get the following:D I 5 GAP 3 Di 5 12 million 3 1% 5 120,000Thus the manager finds that the finance company’s income will rise by 120,000 wheninterest rates rise by 1%. The reason that the company has benefited from the interestrate rise, in contrast to the First National Bank, whose profits suffer from the rise ininterest rates, is that the Friendly Finance Company has a positive income gap becauseit has more rate-sensitive assets than liabilities.Like the bank manager, the manager of the Friendly Finance Company is also interested in what happens to the market value of the net worth of the company when interest rates rise by 1%. So the manager calculates the weighted duration of each item inthe balance sheet, adds them up as in Table 2, and obtains a duration for the assets of1.16 years and for the liabilities, 2.77 years. The duration gap is then calculated to be:DURgap 5 DURa 2 aL903 DUR lb 5 1.16 2 a3 2.77b 5 21.33 yearsA100Since the Friendly Finance Company has a negative duration gap, the manager realizesthat a rise in interest rates by 1 percentage point from 10% to 11% will increase themarket value of net worth of the firm. The manager checks this by calculating thechange in the market value of net worth as a percentage of assets:DNW 5 2DURgap 3Di0.015 2(21.33) 35 0.012 5 1.2%11i1 1 0.10With assets of 100 million, this calculation indicates that net worth will rise in marketvalue by 1.2 million.Even though the income and duration gap analysis indicates that the FriendlyFinance Company gains from a rise in interest rates, the manager realizes that if interest rates go in the other direction, the company will suffer a fall in income and marketvalue of net worth. Thus the finance company manager, like the bank manager, realizesthat the institution is subject to substantial interest-rate risk.Some Problems with Income and Duration Gap AnalysisAlthough you might think that income and duration gap analysis is complicatedenough, further complications make a financial institution manager’s job even harder.One assumption that we have been using in our discussion of income and durationgap analysis is that when the level of interest rates changes, interest rates on all maturities change by exactly the same amount. That is the same as saying that we conductedour analysis under the assumption that the slope of the yield curve remains unchanged.Indeed, the situation is even worse for duration gap analysis, because the duration gap
Duration Gap AnalysisTABLE 231Duration of the Friendly Finance Company’s Assets and LiabilitiesAssetsCash and depositsSecuritiesLess than 1 year1 to 2 yearsGreater than 2 yearsConsumer loansLess than 1 year1 to 2 yearsGreater than 2 yearsPhysical capitalAverage durationLiabilitiesCommercial paperBank loansLess than 1 year1 to 2 yearsGreater than 2 yearsLong-term bonds and otherlong-term debtAverage durationAmount( 250.300.450. 0 0 1.16400.20.093250.31.63.50.010.040.19405.52. 4 4 2.77is calculated assuming that interest rates for all maturities are the same—in other words,the yield curve is assumed to be flat. As our discussion of the term structure of interestrates in Chapter 6 indicated, however, the yield curve is not flat, and the slope of theyield curve fluctuates and has a tendency to change when the level of the interest ratechanges. Thus to get a truly accurate assessment of interest-rate risk, a financial institution manager has to assess what might happen to the slope of the yield curve whenthe level of the interest rate changes and then take this information into account whenassessing interest-rate risk. In addition, duration gap analysis is based on the approximation in Equation 1 and thus only works well for small changes in interest rates.A problem with income gap analysis is that, as we have seen, the financial institution manager must make estimates of the proportion of supposedly fixed-rate assets andliabilities that may be rate-sensitive. This involves estimates of the likelihood of prepayment of loans or customer shifts out of deposits when interest rates change. Suchguesses are not easy to make, and as a result, the financial institution manager’s estimates of income gaps may not be very accurate. A similar problem occurs in calculating durations of assets and liabilities, because many of the cash payments are uncertain.Thus the estimate of the duration gap might not be accurate either.
32Appendix 1 to Chapter 9Do these problems mean that managers of banks and other financial institutionsshould give up on gap analysis as a tool for measuring interest-rate risk? Financial institutions do use more sophisticated approaches to measuring interest-rate risk, such asscenario analysis and value-at-risk analysis, which make greater use of computers tomore accurately measure changes in prices of assets when interest rates change. Incomeand duration gap analyses, however, still provide simple frameworks to help financialinstitution managers to get a first assessment of interest-rate risk, and they are thus useful tools in the financial institution manager’s toolkit.APPLICATIONStrategies for Managing Interest-Rate RiskOnce financial institution managers have done the duration and income gap analysis fortheir institutions, they must decide which alternative strategies to pursue. If the manager of the First National Bank firmly believes that interest rates will fall in the future,he or she may be willing to take no action knowing that the bank has more rate-sensitive liabilities than rate-sensitive assets, and so will benefit from the expected interestrate decline. However, the bank manager also realizes that the First National Bank issubject to substantial interest-rate risk, because there is always a possibility that interestrates will rise rather than fall, and as we have seen, this outcome could bankrupt thebank. The manager might try to shorten the duration of the bank’s assets to increase theirrate sensitivity either by purchasing assets of shorter maturity or by converting fixed-rateloans into adjustable-rate loans. Alternatively, the bank manager could lengthen theduration of the liabilities. With these adjustments to the bank’s assets and liabilities, thebank would be less affected by interest-rate swings.For example, the bank manager might decide to eliminate the income gap byincreasing the amount of rate-sensitive assets to 49.5 million to equal the 49.5 million of rate-sensitive liabilities. Or the manager could reduce rate-sensitive liabilities to 32 million so that they equal rate-sensitive assets. In either case, the income gap wouldnow be zero, so a change in interest rates would have no effect on bank profits in thecoming year.Alternatively, the bank manager might decide to immunize the market value of thebank’s net worth completely from interest-rate risk by adjusting assets and liabilities sothat the duration gap is equal to zero. To do this, the manager can set DURgap equal tozero in Equation 2 and solve for DURa:DURa 5L953 DURl 53 1.03 5 0.98A100These calculations reveal that the manager should reduce the average duration of thebank’s assets to 0.98 year. To check that the duration gap is set equal to zero, the calculation is:DURgap 5 0.98 2 a953 1.03b 5 0100In this case, as in Equation 3, the market value of net worth would remain unchangedwhen interest rates change. Alternatively, the bank manager could calculate the value of
Duration Gap Analysis33the duration of the liabilities that would produce a duration gap of zero. To do thiswould involve setting DURgap equal to zero in Equation 2 and solving for DURl:DURl 5 DURa 3A1005 2.70 35 2.84L95This calculation reveals that the interest-rate risk could also be eliminated by increasing the average duration of the bank’s liabilities to 2.84 years. The manager againchecks that the duration gap is set equal to zero by calculating:DURgap 5 2.70 2 a953 2.84b 5 0100STUDY GUIDETo see if you understand how a financial institution manager can protect income andnet worth from interest-rate risk, first calculate how the Friendly Finance Companymight change the amount of its rate-sensitive assets or its rate-sensitive liabilities toeliminate the income gap. You should find that the income gap can be eliminatedeither by reducing the amount of rate-sensitive assets to 43 million or by raising theamount of rate-sensitive liabilities to 55 million. Also do the calculations to determinewhat modifications to the duration of the assets or liabilities would immunize the market value of Friendly Finance’s net worth from interest-rate risk. You should find thatinterest-rate risk would be eliminated if the duration of the assets were set to 2.49 yearsor if the duration of the liabilities were set to 1.29 years.One problem with eliminating a financial institution’s interest-rate risk by alteringthe balance sheet is that doing so might be very costly in the short run. The financialinstitution may be locked into assets and liabilities of particular durations because of itsfield of expertise. Fortunately, recently developed financial instruments, such as financial futures, options, and interest-rate swaps, help financial institutions manage theirinterest-rate risk without requiring them to rearrange their balance sheets.
Solution The duration gap for First National Bank is 1.72 years: where DUR a 5 average duration of assets 5 2.70 L 5 market value of liabilities 5 95 A 5 market value of assets 5 100 DUR l 5 average duration of liabilities 5 1.03 Thus: DUR gap 5 2.70 251.72 years To estimate what will happen if interest rates change, the bank manager uses the