Transcription
ADAPT TCD: An Ontology-Based Context AwareApproach for Contextual SuggestionMostafa BayomiSéamus LawlessADAPT Centre, Knowledge and Data Engineering Group,School of Computer Science and Statistics, Trinity College Dublin, d.ieAbstract. In this paper we give an overview of the participation of the ADAPTCentre, Trinity College Dublin, Ireland, in both phases of the TREC 2016 Contextual Suggestion Track. We present our ontology-based approach that consistsof three models that are based on an ontology that was extracted from the Foursquare category hierarchy. The three models are: User Model, Document Modeland Rule Model. In the User Model we build two models, one for each phase ofthe task, based upon the attractions that were rated in the user’s profile. The Document Model enriches documents with extra metadata from Foursquare and categories (concepts) from the ontology are attached to each document. The Rulemodel is used to tune the score for candidate suggestions based on how the context of the trip aligns with the rules in the model. The results of our submittedruns, in both phases, demonstrate the effectiveness of the proposed methods.1IntroductionIn TREC 2016, we participate in both phases of the Contextual Suggestion track1. Thetrack goal is to provide a venue for the evaluation of systems that are able to makesuggestions for a particular person (based upon their profile) in a particular context [2].This year the track consists of two phases. In Phase 1 we were provided with 495 userprofiles. Each profile consists of attractions and the user’s opinion regarding them. Auser could rate an attraction from 0 (strongly uninterested) to 4 (strongly interested).Items are labelled as -1 if the user didn’t provide a rating. Additionally, a user’s profilehas information about the context of the trip that they are about to take. Informationsuch as the Group they are travelling with (alone, friends, family, other), the trip Season(summer, winter, autumn, spring), the trip Type (holiday, business, other), and the tripDuration (night out, day trip, weekend, longer).This year the organisers released a fixed set of candidate suggestions for 272 contexts, each context representing a city in the United States. The candidate suggestionsset consists of approximately 1.2 million candidate text/trec-2016
The first phase of the task required participants to provide a ranked list of up to 50suggested attractions for the user to visit, from the provided set of attractions, tailoredto each user based on his/her profile. In Phase 1, unlike previous years, we were notasked to setup a live server that could listen to requests from users, rather, we wereprovided with profiles and the suggestion process was to be completed offline.In Phase 2 (the batch phase), for each provided user profile and contextual preferences, we were asked to rank sets of candidate attractions that had been suggested during the first phase.In the following we describe our proposed approach for both Phase 1 and Phase 2,and then discuss our submitted runs along with the results achieved.2Proposed ApproachOur approach is based on three models: User Model, Document Model and RuleModel. The three models are based on an ontology that was built from the Foursquarecategory hierarchy2.The ontology is considered the central point of our approach. In the DocumentModel we enrich the provided documents and identify the set of classes from the ontology that a document belongs to (see Section 2.2). The Rule Model consists of contextspecific rules, and penalises documents that are instances of classes that don’t matchthese rules (see Section 2.3). In the User Model we suggest and rank the candidatedocuments based on their semantic and tag similarity scores with the user model (Sections 3 & 4).2.1Building The OntologyAn ontology is a formal naming and definition of the types, properties, and interrelationships of the entities that exist for a particular domain. It describes individuals (instances), classes (concepts), attributes, and relations. In our approach we used an ontology to model the users and the attractions. We exploited the Foursquare category hierarchy to build this ontology.The Foursquare category hierarchy is a hierarchy that represents Foursquare categories and the relations between them. For example, “American Restaurant” is a category in the hierarchy that is a child of the “Food” category. Each attraction in Foursquare belongs to one or more of these categories. Hence, we considered a category asa class in the ontology and the attractions that belong to that category as instances ofthat ee
2.2Document ModelThe first step in our approach is to model documents (attractions) and enrich them. Theorganisers released a set of approximately 1.2 million candidate suggestions situatedacross 272 context cities. Each candidate attraction has an attraction ID, a context cityID, a title, and a URL.Some of the provided attractions’ URLs are the attraction’s home page. The homepage of an attraction is expected to contain content that is highly relevant to the attraction. This means that the content of the web page should only be related to what thisattraction is, or what this attraction serves (in the case where the attraction is a restaurant), and this page should not contain any information about users’ ratings or opinionsabout that attraction. Hence, we leveraged Foursquare to enrich the attractions andmodel them.For each attraction, we started by querying its title and location against the Foursquare website3. The Foursquare search returns a list of attractions that are sorted basedon their relevance to the query. We select the first (most relevant) attraction from thatlist.In some cases, the selected attraction is not the actual attraction that we are lookingfor. This is usually due to one of three reasons:1- The attraction that we are looking for is not in Foursquare and thus Foursquaresearch returns any available attractions for the location that was given in thequery.2- The original title of the attraction in the TREC dataset, which we used to generate a query, is not formatted in a manner suited for use as a query on Foursquare. For example, the title is too long or is the description of the attraction.3- The original title of the attraction in the TREC dataset is not correct for theattraction. For example, the attraction could be a profile page for someone onFacebook and the title is for a coffee house.Hence, we apply a filter process to check if the attraction returned from Foursquareis, in fact, the attraction that we are looking for. We measure the lexical overlap betweenthe attraction’s original title (from the TREC dataset) and the returned attraction’s title(from Foursquare). If the lexical overlap score between the two titles exceeds a predefined threshold, the returned attraction is considered to be a correct match and we useit in the next step. If the overlap score is under the threshold, we ignore that attractionand do not include it in the final dataset. The threshold was set based on the length ofthe attraction’s original title after removing common words.After retrieving the attraction’s page from Foursquare we start to parse and extractvaluable information such as:3https://foursquare.com/
a) List of categories (e.g. American Restaurant, Park, Museum).b) Average users’ rating.c) List of tags4 (e.g. “good for a quick meal”, “clean”, “good for families”).d) Users’ rating count (number of users who rated this attraction).e) Users’ review count (number of users who gave a review for this attraction).The list of categories identifies to which category (or set of categories) an attractionbelongs. As we mentioned before, we consider a category as a class in our ontology.This class will be used to measure the semantic similarity between an attraction and theuser model (see Section 4.2).We extract users’ rating and review counts to be used in the inter-ranking processbetween attractions. The intuition behind using those counts is: if an attraction a hasbeen rated by 500 users and attraction b has been rated by 3 users, this means that a ismore credible than b even if b has a rate higher than a. The same applies for the reviewcount as well.2.3Rule ModelThe Rule Model consists of rules that identify the relevance of an attraction to the context of the trip using the class (or classes) that the attraction is an instance of. The tripcontext comprises: the Group that a user is travelling with (alone, friends, family,other), the trip Season (summer, winter, autumn, spring), the trip Type (holiday, business, other), and the trip Duration (night out, day trip, weekend, longer). Each of theseproperties has a set of classes in the ontology that are not suitable for that property. Forexample, the “beach” class is of less relevance when a trip has a Season of “winter”.If at least one of the classes that the attraction is an instance of violates at least onerule in the model, then this attraction is ignored (in Phase 1) or given a lower rank (inPhase 2). For example, consider a user for whom the “Museum” class is listed as oneof their favourite classes in the user model. This user’s trip has a Duration of “nightout”. Since a museum is typically not suitable for a night out, in the rule model the“Museum” category is incompatible with the “night out” trip Duration. Hence, all attractions that are instances of “Museum” are ignored (or given lower rank) and are notselected by our approach even if the user has a preference for museums in her/his usermodel.4Foursquare tags are keywords extracted from users’ reviews
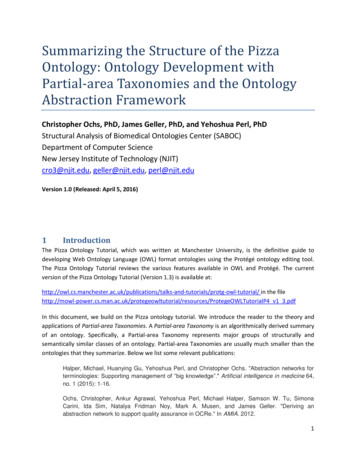
3Phase 13.1User ModellingIn Phase 1, we model the users based on the positively rated attractions in the user’sprofile. A different strategy was taken in Phase 2 (see section 4.1). The positively ratedattractions are those that have got a rating of either 3 or 4 by the user. The user modelwas built as follows:1- For each user and for each attraction we create an index of all the classes (e.g.American Restaurant), based on Foursquare data, that the user has rated positively along with the tag set tc that were found on that attraction’s page onFoursquare.2- We compute the count per class and merge all the tags into one list. The tagsare then added to the positive user model.3- By having all positive classes, we compute the percentage of each class in thepositive model. For example, “American Restaurant” class represents 31% ofthe classes in the positive model.Figure 1 shows a sample of a user’s positive model.For a given place p where a user is travelling to, we start to select the documentsthat match the classes in the positive model. Then we eliminate the documents thatbelong to a class that violates at least one rule in the rule model. As the target for thisphase is to return a list of up to 50 ranked suggestions, we mapped the class percentagein the user model to 50 and represented it as a number, say x. Then we start to selectthe top x attractions of this class from the retrieved documents after ranking them.Ranking between documents of the same class is achieved based on four features:1- The average users’ rating.2- The users’ rating count.3- The users’ review count.4- The tag similarity measure between a document’s tags set td and the classes’tags set tc (see Section 4.3).For example, for a given class c, say “American Restaurant”, in the user model, weselect all documents that are instances of this class (Dc) and eliminate documents thatare also instances of classes that violate rules in the rule model (Dc'). Then we rank theremaining documents based on the aforementioned features. Suppose that class makesup 32% of the classes in the positive user model - 32% of 50 is 16. Hence, we selectthe top 16 documents of the final set.After we select all documents for all classes in the user model, according to theirpercentage, we start to rank the documents based on the first three of the features mentioned before and return the final ranked list. The notion behind not including the tagssimilarity measure in ranking the documents in the final list is that these documents arenot instances of the same class (category), which means that they have different sets oftags. For example, documents that are instances of class “Gym” have completely different tags than documents that are instances of class “Japanese Restaurant”.
{"id" : 1,."positive model" : [{"class" : "American Restaurant","count" : 6,"percentage" : 31,"tagCloud" : ["ghost bar","shrimp","good for dates",.]},{"class" : "Art Museum","count" : 3,"percentage" : 15,tagCloud" : ["museums","free admission",.]}Figure 1. A sample of Phase 1 positive user model3.2Not Enough AttractionsFor some profiles and for some places, it is possible that the number of attractions belonging to a specific class, in a specific city do not meet the required number. For example, for a specific profile and a specific city, suppose that the required number ofattractions that are instances of the “American Restaurant” class is 16. However, in thatcity, there are only 10 attractions with type “American Restaurant”. In this instance, wesupplement the list to make up for the shortfall using two different approaches (for twodifferent runs):a) For the first run, we compensate for the shortfall by getting more attractionsfrom the other classes in the user model. For example, the “American Restaurant” class has only 10 attractions in the city and the required number is 16.The other classes in the user model e.g. “Museum, Chinese Restaurant, etc.”have more attractions than what are required by the user model. We combinethe remaining, overflow attractions from the other classes into a list. We thenrank them based on the aforementioned criteria. Finally we then source themissing 6 attractions from the top of the ranked overflow list.b) For the second run, we compensate for the shortfall for a specific class bylooking, in the ontology, for the class that has the highest ontological similarity
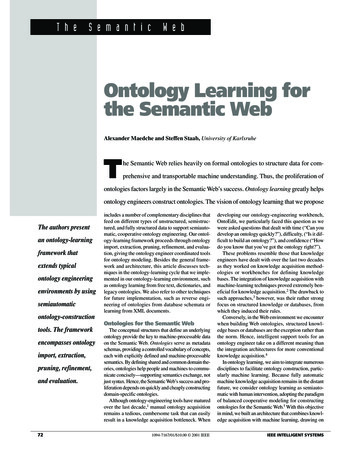
to that class (see Section 4.2). For example, the “New American Restaurant”class is considered the highest ontologically similar class to the “AmericanRestaurant” class. We then retrieve the attractions that belong to that class,rank them and select the number that we require.4Phase 2In Phase 2, we used the same Document Model (Section 2.2) and Rule Model (Section 2.3) but we followed a different strategy to build the user model. The followingsub-sections demonstrate how the Phase 2 user model was built.4.1User ModellingFor a given user (U), we build two user models: a positive model (Upos) and a negativemodel (Uneg). The positive model is built based on the positively rated attractions in theuser’s profile (attractions that were given a rating of either 3 or 4 by the user) and thenegative model is built based on the negatively rated attractions in the user’s profile(attractions that were given a rating of either 0 or 1 by the user).In this phase, we do not compute the count per class, instead, we just collect thedocuments’ classes and their tags in each model. Figure 2 illustrates what the usermodel looks like in Phase 2.Both user models (positive and negative) may have classes in common, i.e. the usercould have positively rated an attraction that is an instance of “American Restaurant”and have negatively rated another attraction that is also an instance of “American Restaurant”. This is why we harvest the tag list from Foursquare. This list of tags is considered an indication of why the user has given a positive or negative rating for thatattraction. Furthermore, the negative model could have some classes that are not in thepositive model, which in turn means that these classes are not preferable for that user.Hence, we add these classes to the rule model to give a lower rank to documents thatare instances of these classes along with the classes that are already in the rule model.After modelling the user profile and modelling the candidate suggestions, we dividethese candidate suggestions into three groups:Group 1: Working URLs and do not violate rules.Group 2: Working URLs and violate rules.Group 3: Not working URLs.While checking the URLs of the candidate suggestions, it was noted that somewere not working, hence, we put these documents, for each profile, in one group (Group3) and move this group to the end of the final ranked list. Group 1 contains the documents that have working URLs and their classes do not violate any rule in the rulemodel while Group 2 contains the documents that have working URLs but their classesviolate at least one of the rules in the rule model.
{"id" : 1,."positive model" : [{"doc id" : "TRECCS-00007296-382","classes" : ["Burrito Place", "Mexican Restaurant"],"tagCloud" : [ "burritos","good for a quick meal","salsa roja",.]},"negative model" : [{"doc id" : "TRECCS-00007296-382","classes" : "Café","tagCloud" : [ "oatmeal","banana nut""corned beef",.]}].Figure 2. A sample of Phase 2 user models4.2Ontology-Based Semantic SimilarityOur approach is based upon the ontological similarity between a document and all thedocuments in the user’s positive profile Upos. i.e. for a given document d, the semanticsimilarity between that document and the user’s positive model is the summation ofweighted semantic similarity scores between the document’s class set and the class setof every document in the positive model.Semantic similarity has been widely used in many research fields such as Information Retrieval [3] and Text Segmentation [1]. Ontology-based similarity can beclassified into three main approaches: Edge-counting, Feature-based and InformationContent (IC) based approaches. In our approach, we rely on an Edge-counting approachproposed by Wu and Palmer [5] as its performance is deemed better than other methods[4].The principle behind Wu and Palmer’s similarity computation is based on the edgecounting method, whereby the similarity of two concepts is defined by how closely theyare related in the hierarchy, i.e., their structural relations. Given two concepts c1 andc2, the conceptual similarity between them is:
ConSim (c1, c2) 2*N / (N1 N2) Where N is the distance between the closest common ancestor (CS) of c1 and c2 andthe hierarchy root, and N1 and N2 are the distances between the hierarchy root on onehand and c1 and c2 on the other hand respectively.The similarity between two documents can be defined as a summation of weightedsimilarities between pairs of classes in each of the documents. Given two documentsd1 and d2, where d1 is a document in the candidate suggestions set and d2 is a documentin the user’s positive model, the similarity between the two documents is:𝑚 𝑑𝑜𝑐𝑆𝑖𝑚(𝑑1, 𝑑2) 𝑖 1𝑛 𝑗 1 𝐶𝑜𝑛𝑆𝑖𝑚(𝑐𝑖 , 𝑐𝑗 )𝑚 𝑛 2 Where m and n are the two sets of classes that d1 and d2 have respectively.As mentioned above, the semantic similarity between one of the candidate suggestion documents and the user’s positive model can be defined as a summation ofweighted semantic similarity scores between the document’s class set and the class setof every document in the positive 𝑚(𝑑, 𝑈𝑝𝑜𝑠 ) 𝑑𝑜𝑐𝑆𝑖𝑚(𝑑, 𝑑𝑖) 3 𝑖 1Where D is the set of documents in the positive model.4.3Tags similarityThe list of tags associated with an attraction is the list of keywords extracted from theusers’ reviews about that attraction on Foursquare. These keywords (tags) are considered a representation of the “taste” of the attraction and depicts why a user has ratedthis attraction positively or negatively. For example, consider a user who has positivelyrated an attraction that has a list of tags that contains: “sushi bar, good for dates”. Thismeans that a candidate suggestion that has similar tags is deemed to be more preferableby the user. In our approach we use tag similarity as a factor in the ranking process. Wemeasure the lexical (word) overlap between an attraction’s tags list and the documents’tags list in the user’s positive model and add the score to the final ranking score.Consider d1 is a document in the candidate suggestion set and d2 is a document inthe user’s positive model, the similarity between the two documents is:𝑡𝑆𝑖𝑚(𝑑1, 𝑑2) 𝑁𝑜. 𝑜𝑓 𝑜𝑣𝑒𝑟𝑙𝑎𝑝𝑝𝑒𝑑 𝑤𝑜𝑟𝑑𝑠𝑥 𝑦Where x and y are the two sets of tags that d1 and d2 have respectively.The total tag similarity score of a candidate suggestion is: 4
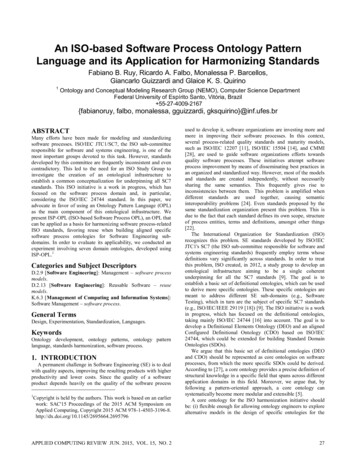
𝐷 5 𝑑𝑡𝑎𝑔𝑠𝑆𝑖𝑚 𝑡𝑆𝑖𝑚(𝑑, 𝑑𝑖)𝑖 1Where D is the set of documents in the positive model.4.4Ranking MethodologyFor each candidate suggestion in the user profile, we measure two similarity scores:1- Semantic Similarity (semanticSim)2- Tag Similarity (tagSim).The final ranking score is calculated as follows:dtotalSim dsemanticSim dtagSim drating 6 Where drating is the document’s rating on Foursquare.As mentioned above, we divided the candidate suggestions into three main groups:1- Working URLs and do not violate rules.2- Working URLs and violate rules.3- Not working URLs.We applied our ranking methodology separately for each group and then mergedthe groups, after ranking, into the afore-mentioned order to create the final list.5ResultsWe participated in the two phases of the Contextual Suggestion track. In Phase 1, wesubmitted two runs (see Section 3.2) and in Phase 2 we submitted 3 runs.This year, the Track organisers evaluated all submitted runs using three evaluationmetrics, namely, Reciprocal Rank, P@5 and ndcg@5.5.1Phase 1 ResultsIn this phase we submitted two runs:1- ADAPT TCD r1 (Section 3.2.a)2- ADAPT TCD r2 (Section 3.2.a)Table 1 reports the performance of our two submitted runs together with the TRECMedianRunsADAPT TCD r1ADAPT TCD r2TREC MedianReciprocal Rank0.57770.55120.5041P@50.40660.40980.3508Table 1. Results of our runs in Phase 1ndcg@50.26430.25950.2133
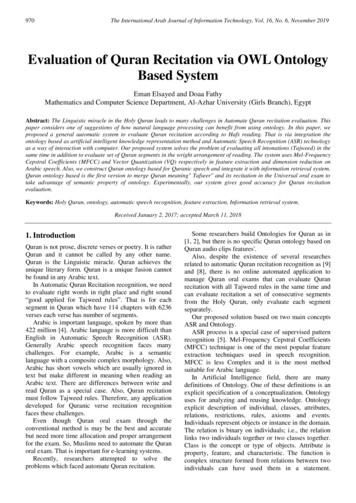
As the results show, our runs are competitive and perform above the TREC medianin both cases. In particular, the first run is the best of the two. Overall, the results forboth of our runs exhibit promising performance.5.2Phase 2 ResultsIn this phase we submitted three runs:1- ADAPT TCD br1: in this run, we measure the similarity between the candidate suggestions and the user positive model based on the semantic and tagsimilarity measures (see Section 4.4).2- ADAPT TCD br2: in this run we divided the positive user model into twopositive models: positive 4 contains the documents that received a rating of 4from the user. While positive 3 contains the documents with a rating of 3. Thesimilarity between every candidate suggestion and each positive profile attraction is measured. If the score of a candidate suggestion with positive 4 ishigher than with positive 3, it is placed in a group that is at the top of the finalranked list.3- ADAPT TCD br3: in this run we followed the same approach as the first runbut we did not measure the tag similarity between documents (see Section 4.3).The intuition behind this run is to assess the impact of tags on measuring therelatedness of a candidate suggestion to a user model.Table 2 reports the performance of our submitted runs in Phase 2 along with theTREC median.RunsADAPT TCD br1ADAPT TCD br2ADAPT TCD br3TREC MedianReciprocal .3931ndcg@50.27200.27200.26120.2562Table 2. Results of our runs in Phase 2The results show that the performance of our first two runs outperform the TREC median in two of the evaluation metrics (P@5 and ndcg@5).Also the results depict that the second run has the same performance as the first one.Which in turn means that dividing the user positive model into two models does notprovide any benefit in the ranking process.The third run has the lowest performance of the three runs (except in the ReciprocalRank metric), which means that the use of tag similarity (run1 & run2) has a positiveimpact on ranking performance.Overall, the results for the first two runs exhibit promising above-median performances, and hence merit further study in the future.
6Conclusion and Future WorkThis paper describes our participation in both phases of the TREC 2016 ContextualSuggestion track. We proposed an approach that consists of three models that are basedon an ontology that was extracted from the Foursquare category hierarchy. The UserModel is used to model users based upon their profiles, the Document Model is used tomodel documents and enrich them, and the Rule Model is used to tune the score forcandidate suggestions based upon the context of the trip and how it aligns with the rulesin the model. In the first phase we submitted two runs. The results exhibit a good performance where both runs outcome the TREC median. In the second phase we submitted three runs, and results also show that our approach for the second phase is promising.Moving forward, viable future work may involve:a) Adding some exceptions to the rule model: There could be an allowance madefor instances of a class which violate a rule, but have exceptionally high rankings within that city (or exceptionally high rating and review counts). For instance, a visitor to Sydney is likely to want to go see Bondi Beach, even if it iswinter time.b) Enhancing the user model in phase 1 by following the same strategy that wehave followed in phase 2 (Section 4.1).Acknowledgements.The ADAPT Centre for Digital Content Technology is funded under the SFI ResearchCentres Programme (Grant 13/RC/2106) and is co-funded under the European Regional Development Fund.7References[1]Bayomi, M., Levacher, K., Ghorab, M.R., and Lawless, S. OntoSeg: A NovelApproach to Text Segmentation Using Ontological Similarity. 2015 IEEEInternational Conference on Data Mining Workshop (ICDMW), (2015),[2]Dean-Hall, A., Clarke, C.L., Kamps, J., Thomas, P., Simone, N., andVoorhees, E. Overview of the TREC 2013 contextual suggestion track. 2013.[3]Hliaoutakis, Angelos (Technical University of Crete (TUC), G., Varelas,Giannis (Technical University of Crete (TUC), G., Voutsakis, E., Petrakis,G.M., E., and Milios, E. Information Retrieval by Semantic Similarity.International Journal on Semantic Web and Information Systems (IJSWIS) 2,3 (2006).[4]Lin, D. An information-theoretic definition of similarity. ICML, (1998), 296–304.[5]Wu, Z. and Palmer, M. Verbs Semantics and Lexical Selection. Proceedingsof the 32Nd Annual Meeting on Association for Computational Linguistics,Association for Computational Linguistics (1994), 133–138.
School of Computer Science and Statistics, Trinity College Dublin, Dublin, Ireland bayomim@tcd.ie seamus.lawless@scss.tcd.ie . the trip Type (holiday, business, other), and the trip Duration (night out, day trip, weekend, longer). This year the organisers released a fixed set of candidate suggestions for 272 con-texts, each context .