Transcription
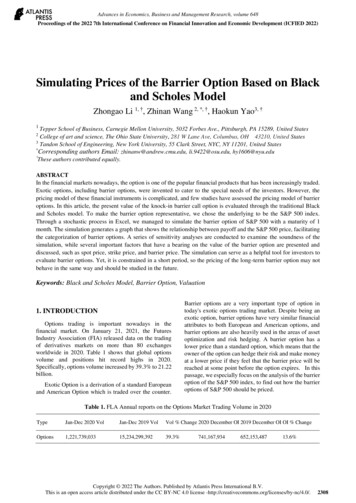
Advances in Economics, Business and Management Research, volume 648Proceedings of the 2022 7th International Conference on Financial Innovation and Economic Development (ICFIED 2022)Simulating Prices of the Barrier Option Based on Blackand Scholes ModelZhongao Li 1, †, Zhinan Wang 2, *, †, Haokun Yao3, †1Tepper School of Business, Carnegie Mellon University, 5032 Forbes Ave., Pittsburgh, PA 15289, United StatesCollege of art and science, The Ohio State University, 281 W Lane Ave, Columbus, OH 43210, United States3Tandon School of Engineering, New York University, 55 Clark Street, NYC, NY 11201, United States*Corresponding authors Email: zhinanw@andrew.cmu.edu, li.9422@osu.edu, hy1606@nyu.edu†These authors contributed equally.2ABSTRACTIn the financial markets nowadays, the option is one of the popular financial products that has been increasingly traded.Exotic options, including barrier options, were invented to cater to the special needs of the investors. However, thepricing model of these financial instruments is complicated, and few studies have assessed the pricing model of barrieroptions. In this article, the present value of the knock-in barrier call option is evaluated through the traditional Blackand Scholes model. To make the barrier option representative, we chose the underlying to be the S&P 500 index.Through a stochastic process in Excel, we managed to simulate the barrier option of S&P 500 with a maturity of 1month. The simulation generates a graph that shows the relationship between payoff and the S&P 500 price, facilitatingthe categorization of barrier options. A series of sensitivity analyses are conducted to examine the soundness of thesimulation, while several important factors that have a bearing on the value of the barrier option are presented anddiscussed, such as spot price, strike price, and barrier price. The simulation can serve as a helpful tool for investors toevaluate barrier options. Yet, it is constrained in a short period, so the pricing of the long-term barrier option may notbehave in the same way and should be studied in the future.Keywords: Black and Scholes Model, Barrier Option, Valuation1. INTRODUCTIONOptions trading is important nowadays in thefinancial market. On January 21, 2021, the FuturesIndustry Association (FIA) released data on the tradingof derivatives markets on more than 80 exchangesworldwide in 2020. Table 1 shows that global optionsvolume and positions hit record highs in 2020.Specifically, options volume increased by 39.3% to 21.22billion.Exotic Option is a derivation of a standard Europeanand American Option which is traded over the counter.Barrier options are a very important type of option intoday's exotic options trading market. Despite being anexotic option, barrier options have very similar financialattributes to both European and American options, andbarrier options are also heavily used in the areas of assetoptimization and risk hedging. A barrier option has alower price than a standard option, which means that theowner of the option can hedge their risk and make moneyat a lower price if they feel that the barrier price will bereached at some point before the option expires. In thispassage, we especially focus on the analysis of the barrieroption of the S&P 500 index, to find out how the barrieroptions of S&P 500 should be priced.Table 1. FLA Annual reports on the Options Market Trading Volume in 2020TypeJan-Dec 2020 VolJan-Dec 2019 VolVol % Change 2020 December OI 2019 December OI OI % 67,934652,153,48713.6%Copyright 2022 The Authors. Published by Atlantis Press International B.V.This is an open access article distributed under the CC BY-NC 4.0 license 08
Advances in Economics, Business and Management Research, volume 648In our article, we cited a total of 11 articles related tothe topics of our article to increase credibility. For thepricing of options and corporate liabilities, it talks aboutthe Black and Scholes model of option pricing as awidely used mathematical method to the valuation ofoptions. Under the assumption that the market cannot bepredicted, we can use the model to simulate the price ofthe barrier options [1]. In The trouble with stock options,the article states that The number of options keptincreasing and option grants in S&P 500 firms reached 119 billion in 2000, but critics of options often claimthat traditional options are economically insufficient dueto their costs. However, the emergence of exotic optionsmay resolve some of the problems. Barrier options, forexample, can be issued at a relatively lower price [2]. InMispricing in the Black-Scholes model: an exploratoryanalysis, it shows that despite the Black and Scholesmodel of pricing lacking accuracy in many scenarios,some studies have shown that it can perform a predictionof at-the-money options well. Therefore, for the precisionof the simulation of the barrier option in this article, itwas set to be an at-the-money option, whereas otherstrike prices are discussed in the sensitivity analysis [3].In Comparison of Black Scholes and Heston Models forpricing index options, it indicates that another flaw of theBlack and Scholes model is the decreasing accuracywhen the time to maturity becomes shorter. This problemshould be considered as a limitation of the simulation inthis article, since simulating a longer time to maturity willconsume a significant amount of computing power inExcel for a path-dependent option [4]. In Pricing andhedging barrier options, “European options are asignificant financial product. Barrier options, in turn, areEuropean options with a barrier constraint. The investormay pay less buying the barrier option obtaining the sameresult as that of the European option whenever the barrieris not breached. Otherwise, the option's payoff cancels.”Therefore, we can use the B-S model for the valuation ofthe barrier options [5]. The article Conditioning on OneStep Survival for Barrier Option Simulations uses thespecial structure of barrier options to develop a variancereduction technique, which is suitable for generalsimulation problems with similar structures. We usemeasured changes at each step of the simulation to reducethe variance due to the possibility of crossing obstacleson each monitoring date. This method helps us reduce theerror in the experiment [6]. In Pricing external barrieroptions under a stochastic volatility model, “The mainreasons why barrier options have become so popular arethat they have resilience and low premiums comparedwith vanilla options. Barrier options are extinguished(knock-out options) or activated (knock-in options) whenthe value of the barrier variable hits a certain level eitherfrom above (down-options) or below (up-options).” Thissupports the result of the graph we made [7]. The 2020annual trends in Futures and Options Trading providesthe data for the options trading volume [8]. In Pathdependency and path-creation perspectives on migrationtrajectories: The economic experiences of Vietnamesemigrants in Slovakia, demonstrates the definition of pathdependence is that the value of an option depends notonly on the price of the underlying asset but also on thepath that asset took during all or part of the life of theoption. In other words, "Path dependence exists when afeature of the economy (institution, technical standard,the pattern of economic development, etc.) is not basedon current conditions, but rather has been formed by asequence of past actions each leading to a distinctoutcome" [9]. In Standard & Poor's midcap 400 guide, itcompared to another index, Dow Jones Index, S&P 500included more companies from a wider variety ofindustries, so that the risk of S&P 500 is more diversified,and the change of index can show how the market isfluctuating more clearly. It is a daily snapshot of thefinancial health and activity of five hundred of the largestpublicly traded companies [10]. The article indicates thatthe investor can manage the volatility risk using optionssince the price of the options "depends on the volatilityof a given financial asset (a stock, a commodity, aninterest rate, etc.)" [11].While few studies applied the Black and Scholesmodel to analyze the present value of barrier options inExcel, we succeeded in running a day-to-day simulationof the price of S&P 500 to calculate the expected payoffof barrier options in different market paths. We found anapproach that is not only able to obtain an estimatedpresent value of a specific barrier option but also to beevaluated under certain parameters. These parameters areanalyzed in the sensitivity test, where we classified theeffect of the strike price, spot price, and barrier price onthe price of the barrier option. We also explore theintuitive ways to explain the advantages of the barrieroption over the standard European options in terms of thesimulation.Regarding the structure of this article, 4 sections arethe introduction of the definition of the barrier option, themethod of simulation, the discussion of the simulationand the sensitivity analysis, and the conclusion. First, theintroduction explains how the barrier option is defined,especially the one of simulation. Second, the details ofour simulation and the data used are presented in themethod. Third, the discussion section covers ourdeduction and analysis of the simulation. Lastly, theconclusion extracts the important insights of thediscussion and summarizes the limitations of this article.2. OPTIONS OF S&P 500 INDEX2.1. The basic idea of Standard & Poor's 500indexStandard & Poor’s are normally shorted as S&P500.It is an index developed and maintained by a companynamed S&P Dow Jones Indices LLC. It is an averagerecord of the U.S. stock market from 1957 onwards,2309
Advances in Economics, Business and Management Research, volume 648looking at 500 public companies in the United States.Compared to another index, Dow Jones Index, S&P 500included more companies from a wider variety ofindustries, so that the risk of the S&P 500 is morediversified, and the change of index can show how themarket is fluctuating more clearly. It is a daily snapshotof the financial health and activity of five hundred of thelargest publicly traded companies, including health care,information technology, materials, real estate, financials,energy, etc. Well-known companies included in thisindex are Apple, 3M, Boeing, IBM, Intel, etc.2.2. The basic idea of OptionsAn option is a derivative contract in which the buyerpays a sum of money to the seller or the writer andreceives the right to either buy or sell an underlying assetat a fixed price either on a specific expiration date, whichis a European option or at any time before the expirationdate, which is the American option. There are two typesof basic options: call option and put option. The holderof the call option will have the right to buy an asset at theexercise price at the expiration date, and the holder of theput option will have the right to sell an asset at a specificexercise price at the expiration date. Options can betraded either on the floor or over the counter.Compared to the future, we should focus more herethat the options are giving the holder to have the right toexecute the power, which means the holder can alsodisregard such right. Although it is not needed to payextra money to hold a futures asset, while in the options,the holder needs to pay some extra money to own suchright.It is necessary to find out the appropriate amount ofmoney that the person needed to pay to hold a call or putoption. The key to pricing the derivatives of the financialmarket is fairness between the seller and buyer of thecontracts under a specific underlying asset. The priceneeds to ensure both sides have the same rights andinterests under a certain risk. The way to price the optionwill be introduced in the next section of this essay.Since the price is influenced by the risk of the assets,so the market can view the option not only as a derivateto earn money through increasing or decreasing the priceof the underlying asset. The investor can use the optionsprice as the measurement of the market risk. Investors areoften exposed to two types of market risk: directional riskand volatility risk. Directional risk can be hedged bybuying and selling futures contracts but buying andselling futures do not enable hedging of volatility risk.But in option pricing, the impact of market volatility onthe price of the underlying asset is considered, not justthe time factor and the market interest rate factor. So, wecan help manage the market risk, directional risk, andvolatility risk, faced by investors more effectivelythrough the price of options. For example, the investorcan manage the volatility risk using options since theprice of the options “depends on the volatility of a givenfinancial asset (a stock, a commodity, an interest rate,etc.)”The price of the option is low compared to the priceof the futures of the underlying assets. That's whyinvestors often think of options as insurance policies. Forexample, an investor who buys a pool of stocks and thenworries that the price of those stocks will drop sharply inthe future can buy a put option, which is like an insurancepolicy that costs a small amount of money and allows fora promptly stop loss if the stock drops.In addition to the price advantage, the flexibility ofthe options structure gives options a unique advantage.Through the combination of different expiration dates,different exercise prices, and buy-sell options, differentstrategies can be created to meet the different needs ofinvestors. Notable combinations include butterflyspreads, long straddle options, etc.Given such flexibility, investors find out that theytake more advantage of the options by adding someconditions, and then they become options what is knownas an exotic options.2.3. Basic Idea of Exotic OptionsExotic Options are more complicated than the normaloptions which people normally call plain vanilla products.This type of product arises for a variety of reasons,sometimes to meet the specific hedging needs of certaininvestors. Sometimes it is for tax, legal, and fundingreasons. There are also times when they are designed topredict the direction of financial markets for certainmarket variables.2.4. Types of Exotic OptionSome options will be introduced shortly here.2.4.1. Lookback OptionThe payoff of a lookback option is related to themaximum and minimum values reached by the priceduring the term of the option. The return on a floatinglookback call option is equal to the difference betweenthe final price of the underlying asset and the minimumprice of the underlying asset during the term of the option.The return on a floating put option is equal to thedifference between the highest price of the underlyingasset over the list price of the underlying asset during theterm of the option.2.4.2. Asian OptionThe return on an Asian option is related to thearithmetic average of the price of the underlying assetover the life of the option. The return on an average price2310
Advances in Economics, Business and Management Research, volume 648call option is 𝑚𝑎𝑥(0, 𝑆𝑎𝑣𝑒 𝑋), and the return on anaverage price put option is 𝑚𝑎𝑥(0, 𝑋 𝑆𝑎𝑣𝑒 ) , where𝑆𝑎𝑣𝑒 is the average of the underlying asset prices.2.4.3. Barrier OptionA barrier option depends on whether the price of theunderlying asset reaches a specific level within a specificA barrier option depends on whether the price of theunderlying asset reaches a specific level within a specifictime interval.A variety of different barrier options are often tradedin the over-the-counter market. Barrier options can bedivided into two categories: knock-out options andknock-in options. Knock-out options cease to exist whenthe price of the underlying asset reaches a certain level;knock-in options begin to exist when the price of theunderlying asset reaches a certain level.2.5. Reasons to choose the Barrier OptionBarrier Option has many advantages over other typesof options. The first advantage is the weak pathdependence. The definition of path dependence is that thevalue of an option depends not only on the price of theunderlying asset but also on the path that asset tookduring all or part of the life of the option [12]. In otherwords, "Path dependence exists when a feature of theeconomy (institution, technical standard, a pattern ofeconomic development, etc.) is not based on currentconditions, but rather has been formed by a sequence ofpast actions each leading to a distinct outcome."Asian Option is a strong path dependence under suchdefinition. The reason weak path-dependent is moreadvantageous compared to the strong path-dependentoption is that the investors care about whether the barrieris reached, while they do not need any other informationabout the path. It is different from the Asian Option,which is a strong path-dependent option. In the Asianoption, we need to calculate the average price. In this case,the information of the path will become the newindependent variable. While in this Barrier option, wedon't need the price of every time point and we just needto know whether the barrier price is reached. If we usethe computer to do this simulation, the velocity can befaster, and more energy can be saved.Another advantage is the price advantage. Accordingto the simulation, which is shown in Table 2, and Fig.1here shows the price of the barrier option under the samestrike price and expiration time of a certain underlyingasset can be much cheaper. So, this option is reallyattractive to a person who believes that the barrier pricewill be achieved!Figure 1 Comparison of Price of Barrier knock-in Priceand European Call OptionTable 2. Comparison of Price of Barrier knock-in Priceand European Call OptionStrike Price, BarrierinPrice, knockOptionEuropeanCalloption Price, .071172.3090384,471.3757.760167.793336What’s more, the option is a kind of financialderivative caring about volitivity. Normally, people willhave exact opinions toward the market. If one believesthat the price will not reach a certain point (Barrier Price)and he wants to get the return as a normal European callbut doesn't want to pay for all the possibilities, then hewill probably buy the knock-out barrier option since theprice is much lower. The closer the barrier price with thespot price, the more probably that the option will beknocked out. The cheaper will be the option. (Good in thenon-volatile market)Same idea on the knock-in price: The higher thebarrier price, the cheaper the option. (Good in a volatilemarket)2311
Advances in Economics, Business and Management Research, volume 648Table 4. Data used to find out the one-year standarddeviation of return2.6. Source of DataThe following sections of the article will talk abouthow the option will be analyzed quantitively. The paperuses the data from Yahoo Finance. The data from YahooFinance include Spot Price. The volatility and interestrate of return are achieved by regression of the futures ofthe S&P 500 index. Table 3 shows such progression.Table 3. Data used for the Progression of achieving δ.Time to Maturity/ yrPrice of S&P 500 Futures, 1/64390.002/54382.252/3437214365.257/64356We use those data to simulate the 𝛿, the dividend rateby linear regression using excel. Fig.2 shows the graph ofsuch simulation.4395.004390.00DateS&P 7.769592-4.97%2021/10/1438.6600042.55%With those data, with the help of excel, it can get thestandard deviation of return of the S&P 500 market is13%In conclusion, Table 4 shows the data that we used forsimulation. 𝑟 here is the risk-free interest, using FederalReserve Treasury Bills Rate, 𝛿 here is the dividend rateof S&P stock market. 𝑇 here is time to maturity of theassets. 𝜎 is the standard deviation of the return.4385.004380.004375.004370.00This article sets the strike price and the barrier pricerandomly to do the simulation.4365.004360.00Table 5. Data used for the simulation in the latter part.y 4395.8e-0.008x4355.004350.0001/211 1/2From the graph linear regression, according to theformula of pricing of the financial futures. 𝐹(0, 𝑇) hereis the price of the futures with the parameter, 𝑇, which isthe time to maturity of the futures. 𝑟 here is the interestrate of free risk. 𝛿 here is the dividend rate of the S&Pstock market.F 0,T S0 e(1)As we get 0.008 𝑟 𝛿 in the formula, wechoose treasury bill rate as 𝑟, the day we get thenumber of the free risk value is 0.001.Then we can get 𝛿 0.90% by the following step. 0.008 0.001 0.009 0.9%StrikeBarrierPricePricePrice4471.37 4471.37 4600Figure 2 Linear Regression of S&P 500 Futures r TSpot(2)Then we get 𝜎, the standard deviation of the returnby the following data. Table 4 shows the data that weused to find 𝜎.rδTσ0.12% 0.90% 0.08333 13%In this article, the research is about how the optionshould be priced and this essay is about the pricing of thebarrier price, mainly focused on how the option price ofthe barrier price is influenced by different prices like spotprice, strike price, and barrier price.3. METHOD AND RESULTThis part of the article will introduce the steps andresults of our simulation process. First, take a good lookat the basic data of our simulation. First of all, in oursimulation, the risk-free rate is 0.12%. According to theSP 500 data that we found on the Internet, the spot priceand strike price here are both set to 4471.37. The delta is0.9%. Because this simulation is simulating data for onemonth, the time to maturity is 1/12 and because there are22 trading days in a month, this simulation will simulate22 days of data. The volatility is 13%. We set the barrierprice to 4600. We simulated a total of 500 times.2312
Advances in Economics, Business and Management Research, volume 648The first step is to copy the simulated random numberso that we won't re-simulate the situation withoutentering new data. If each input will regenerate a new setof data, then this will cause errors in our simulation. Thiswill make our subsequent simulation more convenientand more accurate. The second step is to use the BlackScholes equation (1) to simulate 500 times of data. Whatwe need to pay attention to is that the spot price on thefirst day of simulation is our preset price 4471.37.However, our simulation did not use this preset price forthe whole simulation, but for the rest of the days, thestimulation used the data of the previous day like the spotprice. This is because every time we simulate the data ofa new day, if we only use the initial spot price, this willcause a lot of errors in our subsequent 21-day simulation,so in order to avoid errors, we need the previous day’sdata as the spot price.ST S0 e 122 T ZT4. SENSITIVITY ANALYSISTo understand the factors that will influence the priceof the barrier options, we carried out sensitivity analysisbased on the strike price, the spot price of S&P 500, andthe barrier price. The tests are all done in Excel with thedata table feature in What-if Analysis. We also evaluatedthe bearing of these factors theoretically so that we cancheck whether the approach of simulation is reasonable.4.1. Strike Price(3)The third and final step is graphing. We need to findthe value of 𝑆𝑇 . The logic of how we get the value of 𝑆𝑇is that if there is a value greater than the barrier price weset during the 22 days of our simulation, then we considerthe option to be activated, in other words, it is knockedin. After the knock-in occurs, subtract the strike pricefrom the price of the last day to get the payoff of thisoption. If there is no knock-in, then the payoff is 0. In thisway, the simulation can get the graph of payoff and stockprice. Graph 1 meets our expectations for the barrieroption. We can see that there is a period that exceeds thestrike price, but the payoff is still 0. This is becausealthough the price exceeds the strike price, the historicalprice does not exceed the barrier price, the payoff is still0. In the end, the gain of this barrier option we simulatedwas 57.7603. We believe that the value of the Barrier,strike price, and spot price are all factors that will affectour final simulation, so next, we conducted sensitivitytests on these three factors.Figure 4. Option price with a different strike priceThe sensitivity test between the barrier option priceand the strike price displays a negative linear correlationin Figure 4. Since we simulated a knock-in barrier calloption, we know that an increase in the strike price willresult in a decrease in the expected payoff and, in turn,the barrier option price. Thus, the result of the sensitivityis consistent with our theory of the barrier option. Wenotice that the linear correlation is perfect due to the fixedz-score numbers. The slope of the best-fit line isapproximately -0.30, which means that for every dollarincrease in the strike price, the barrier option price willdrop by 0.30 dollars.4.2. Spot PriceFigure 5. Option price with the different spot priceFigure 3. Payoff vs. Stock PriceAnother factor we tested was the spot price of S&P500. According to Figure 5, the test on spot pricedemonstrates an exponential positive correlation. The2313
Advances in Economics, Business and Management Research, volume 648option price starts from zero around the S&P price at 4,150. The exponentiality indicates that the option priceis more volatile than the spot price. As the spot priceincreases to more than 4,600, the correlation seems tobe linear. This change is similar to the relation betweenthe European option price and the spot price in Black andScholes' study. Therefore, we find that the sensitivity teston the spot price is within our expectations.4.3. Barrier PriceFigure 6. Option price with different Barrier priceThe last sensitivity test we have done was on thebarrier price. It is important to understand the effect ofthe barrier price because it is customizable and marks theingenuity of the derivative option. In Figure 6, we can seethat there is a point that separates the two segments ofdifferent relations. In the first half, the graph shows aconstant option price of around 68. The reason for theconstant price is that, when the barrier price is lower thanthe spot price, the contract of the barrier option will beimmediately executable. Therefore, if the barrier does notexceed the current price of the S&P 500 index, the barriercall option will always be identical to a standardEuropean option. On the other hand, when the barrierprice is above the spot price, there is an imperfectnegative linear correlation. With the increase of thebarrier, the option price drops gradually. In general,elevating the barrier will decrease the probability of theexecution of the option, reducing the expected payoff.Therefore, the trend matches our simulations. However,the impishness of the linear relationship needs furtherstudy.5. CONCLUSIONIn this article, the research is about how the optionshould be priced and this essay is about the pricing of thebarrier price, mainly focused on how the option price ofthe barrier price is influenced by different prices like spotprice, strike price, and barrier price. The data of theresearch is mainly extracted from Yahoo Finance,including spot prices. Volatility and returns wereobtained by regressing the S&P 500 futures. In this paper,the strike price and the barrier price are set randomly forsimulation.In our study, we adopt Black and Scholes' model onoption pricing to simulate the price of the knock-inbarrier call option of the S&P 500 index. We used Excelto generate a series of random z-score numbers tosimulate the market price of the S & P 500 index withina month of trading. Comparing the price at each tradingday with the barrier price, we determined the final payoffin each trial. Based on the lognormal equations, wemanage to derive the prices of the barrier option,providing insights for all the other types of barrier optionderivatives. Moreover, we categorize the expected payoffof the barrier option in graphs and conduct sensitivityanalysis to examine critical factors that quantitativelyaffect the price of the option. The results not only presentparameters that are useful for evaluating the barrieroption but also prove the robustness of our simulation.Equipped with the knowledge of our simulation,investors can grasp a more thorough understanding of thebarrier option and its advantage in lowering cost. Oursimulation on S&P 500 index barrier option epitomizespath-dependent options based on other financialinstruments. Similar approaches can be applied to thepricing of these options.We recognize that our simulation is still inadequate.For example, the time span of our simulation is not longenough. We only simulated one month's data. Thefinancial market is changing rapidly, and every month'smarket will be very different. Our one-month data maybe quite different from the actual situation, so it is notconvincing enough. In the future, we will try a longersimulation period, such as a one-year or three-yearsimulation. Longer simulation time also means that oursimulation will have higher accuracy. And, in futureresearch, we will also consider simulations of othermarkets, such as Nasdaq, or some foreign markets. Wewill try to find out the correlations and differencesbetween different markets through our simulations.REFERENCES[1]. Black, F., & Scholes, M. (1973). The pricing ofoptions and
options. In this article, the present value of the knock-in barrier call option is evaluated through the traditional Black and Scholes model. To make the barrier option representative, we chose the underlying to be the S&P 500 index. Through a stochastic process in Excel, we managed to simulate the barrier option of S&P 500 with a maturity of 1 .


