Transcription
Questions and Answers About:Status and Trends of Wetlands in the Conterminous United States 2004 to 2009I. BackgroundQuestion 1:Why are wetlands important?Answer:Wetlands provide a multitude of ecological, economic and social benefits. They provide habitatfor fish, wildlife, and a variety of plants. Wetlands are nurseries for many saltwater andfreshwater fishes and shellfish of commercial and recreational importance. Wetlands are alsoimportant landscape features because they hold and slowly release flood water and snow melt,recharge groundwater, act as filters to cleanse water of impurities, recycle nutrients, andprovide recreation and wildlife viewing opportunities for millions of people.Question 2:Why is the Fish and Wildlife Service determining the status and trends of the Nation’swetlands?Answer:The Fish and Wildlife Service is the principal Federal agency that provides information to thepublic on the extent and status of the Nation’s wetlands, Under the provisions of the EmergencyWetlands Resources Act (Public Law 99‐645), the Service is required to update wetland statusand trends studies of the Nation’s wetlands at ten year intervals and report to the Congress*. Todate, there have been five national reports on wetland status with this study being the latest. Aspecial five‐year report completed in 2005 was required by the President, so this report providesan update for the last five years.Question 3:Does this study include natural as well as human‐induced gains and losses?Answer:Yes. The study includes sampling and analysis of natural and human‐induced wetland anddeepwater habitat gains and losses in the conterminous United States between 2004 and 2009.Question 4:How are the wetlands data collected?Answer:For each sample plot, aerial imagery is analyzed and annotated in accordance with procedurespublished by the Fish and Wildlife Service. The results are compared with previous era imagery,and any changes were recorded. The differences between the data sets are analyzed and astatistical estimate of the change is produced. Field verification is done to confirm the findings.Question 5:What are the different types of wetlands included in the study?Answer:The three major kinds of wetlands or water bodies include: 1) freshwater (palustrine), 2)saltwater (marine or estuarine), 3) deepwater (lakes and other deepwater habitats). Foranalysis and reporting, these types of wetlands were further divided into subcategories such asfreshwater forested, freshwater emergent, estuarine and marine intertidal.*A five‐year report, required by Presidential Directive, was completed in 2005.1
Question 6:Are small sized wetlands included in the study?Answer:Yes. The minimum targeted delineation size for wetlands was one acre (0.40 ha). However,results from this and past status and trends studies indicate that the actual size of wetlandsdetected was smaller than the target and routinely included features of 0.1 acre (0.04 ha).Question 7:What was the level of field verification for this study?Answer:Field verification was completed for 898 (18 percent) of the sample plots distributed in 42States. Field work was done primarily as a quality control measure to verify that plotdelineations were correct. Verification involved field visits to a cross section of wetland types,geographic settings, and plots with different image types, scales, and dates. All field verificationwork took place between May 2009 and September 2010.Question 8: Where can supporting technical documentation be found?Answer:Supporting technical documentation, as well as previous iterations of wetlands status andtrends reports, can be found at: http://www.fws.gov/wetlands/StatusAndTrends/.II. Study FindingsQuestion 1:What are the major findings of the study?Answer:The study indicated that there were an estimated 110.1 million acres (44.6 million ha) ofwetlands in the conterminous United States in 2009. Nearly 95 percent of all wetlands werefreshwater and five percent were in the marine or estuarine (saltwater) systems. Although thelosses of 551,870 acres of wetlands exceeded the gains of 489,620, the change was notstatistically significant. The rate of wetland reestablishment increased by 17 percent from theprevious study period (1998 and 2004) and conversely, the wetland loss rate increased 140percent during the same time period. As a consequence, national wetland losses haveoutdistanced gains.Question 2:What were the observed changes in vegetated freshwater wetlands?Answer:All vegetated freshwater wetlands (forested, scrub/shrub, and emergent) experienced anaverage annual net loss of an estimated 41,200 acres, a 50% decline in the rate of loss from theprior five‐year study. The estimated net loss was 185,300 acres, with emergent and shrubwetlands experiencing a net gain while forested wetlands experienced a large loss.Question 3:What type of wetlands suffered the largest losses?Answer:Freshwater forested wetlands lost an estimated 633,100 acres, their largest losses since the1974 to 1985 time period.2
Question 4:Did estuarine wetlands change?Answer:Yes. Estuarine intertidal vegetated wetlands experienced a 110,900 acre loss. Salt marsheswere lost at 3 times the rate from the previous era. The majority of these losses, 83%, were todeepwater bay bottoms or open ocean through natural processes.Question 5:What caused the wetland changes?Answer:The reasons for the overall decline in wetland area were complex and potentially reflectedeconomic conditions, land use trends, changing wetland regulation and enforcement measures,conservation initiatives, the impacts of the 2005 hurricane season, and climatic changes. Therehave been a number of successes in conservation, protection, and reestablishment of wetlands.Wetland gains were due to agricultural conservation programs, wetland reestablishment andcreation involving partners, land retirement programs, and the creation of freshwater ponds.Question 6:Does the study provide information on wetland quality?Answer:No. This report did not draw conclusions regarding trends in the quality or condition of thenation’s wetlands. Rather, it provided data regarding trends in wetland extent and type, and itprovided baseline information to facilitate ongoing collaborative efforts to assess wetlandcondition. Further examination of wetland condition on the national level has been initiated bythe Environmental Protection Agency in conjunction with the Fish and Wildlife Service and otherFederal, State and Tribal partners.Question 7:What part of the United States experienced the greatest loss of wetlands?Answer:The southeast United States, primarily freshwater wetlands of the Atlantic and Gulf coastal plainand the Lower Mississippi River, experienced the greatest losses. Losses were also observed inthe Great Lakes States, the prairie pothole region, and in rapidly developing metropolitan areas.Question 8:Was there evidence of climate change effecting wetlands?Answer:Yes. Losses of estuarine emergent (salt marsh) and changes in marine and estuarine non‐vegetated wetlands reflected the impacts of coastal storms and relative sea level rise along thecoastlines of the Atlantic and Gulf of Mexico. The effects of sea level on wetlands are subject toconsiderable uncertainties. However, recent changes in non‐vegetated intertidal wetlands(beaches, bars and shoals) along the South Atlantic and Gulf of Mexico indicated considerableinstability and change. Coastal environments continue to face a variety of stressors that caninteract with climate‐related processes and potentially increase the vulnerability of coastalwetlands.In the freshwater systems, changes in climatic conditions that affect water conditions (wetter,drier) will have a substantial impact on species that utilize wetlands and other ecologicalservices wetlands provide, and will make efforts to reestablish wetlands more challenging. Thereport identified wetland types that most likely exhibited observable physical change due toclimate processes in this study.3
Question 9:Why is some silviculture considered a loss? Why isn’t it a conversion from onewetland type to another through forest management?Answer:Silviculture is the practice of establishing or growing forests. Many wetland forests areconsidered to be in silvicultural land use and remain as wetland. The loss of wetland tosilvicultural upland use involved drainage, ditching, filling or impoundment of water thatdestroyed wetland hydrology. Activities associated with silviculture such as drainage or filling toplant or promote tree growths, road construction for access to trees, construction of stagingareas for tree harvesting or loading may contribute to wetland loss.Question 10: How was the report peer reviewed?Answer:Peer review is one of the important procedures used to ensure that the quality of publishedinformation meets the standards of the agency and the scientific community. The use of atransparent process, coupled with the selection of qualified and independent peer reviewers,improves the quality of government science while promoting public confidence in the integrityof the government’s scientific products. Due to the technical complexities and of the WetlandsStatus and Trends project and the ramifications of the resultant report, the Service hasinstigated a series of technical oversight panels to review scientific configuration, data collectionand protocol issues, and an peer review process with select subject matter experts for thereport findings and conclusions. These panels include a Technical Review and Inspection Team,Statistical Oversight Panel, and External Expert Subject Matter Peer Reviewers.Peer review typically evaluates the study design, the quality of data collection procedures, therobustness of the methods employed, the appropriateness of data presentation and discussion,the extent to which the conclusions follow the analysis, and the strengths and limitations of theoverall product. The Service’s Peer Review Plan can be found lityPeerReviewPlan.pdf.III. Users of the InformationQuestion 1:Why is the Service’s status and trends data important?Answer:The wetland extent information presented in this report has important uses by resourcemanagers as they interpret the role that wetlands play on the national landscape. This studywas designed to supply scientific information to resource specialists and decision makers aboutwetlands resource trends and provide partner organizations with data to help guide decisionson wetland‐related issues such as reestablishment and enhancement, endangered specieshabitat availability, possible changes resulting from climatic change, strategic habitatconservation and ecosystem management planning. Wetland status and trends data continueto be used extensively by Federal, State, local and Tribal governments to develop wetlandconservation strategies and strategic management actions, and to validate performance towardhalting loss and reestablishing wetlands.4
Question 2:Why do we need wetland status and trends information?Answer:Status and trends information provides contemporary data about wetland loss and gains.Continued monitoring of wetland resources has been widely considered essential for identifyingchanges in the wetland community type and spatial extent, and guiding additional research ormanagement actions. This information combined with historical perspectives increases ourunderstanding of landscape patterns and processes.Up‐to‐date status and trends information is needed to periodically evaluate the efficacy ofexisting Federal programs and policies and identify national or regional wetland issues.Question 3:Who are the customers for the wetlands data and how do other agencies or outsidegroups use it?Answer:Wetlands status and trends data produced by the Fish and Wildlife Service is used widely insideand outside of the Federal government. The Service uses status and trends data and reports forits own resource priority setting. Other government agencies and private sector organizationsuse status and trends data for their analyses of government policy and for setting internalguidelines. There has been keen interest in the findings about wetland trends since theSupreme Court decisions in 2001 and 2006 that narrowed the interpretation of the scope ofwaters and wetlands protected by the Clean Water Act*. Previous information on wetlandtrends pre‐dated the 2006 Rapanos and Carabell decisions (Rapanos v. United States andCarabell v. United States) and changes in the wetland regulatory process. Several of the Stateshave used status and trends information in the establishment of policy and legislation designedto protect wetland resources.IV. Gulf Coast EventsQuestion 1:Does this study include wetland changes resulting from hurricanes along the GulfCoast since 2005?Answer:Yes. This study measured wetland trends in the conterminous United States between 2004 and2009. Since 2004, there have been several severe hurricanes that struck the coastline along theGulf of Mexico and these data afford an indication of wetland area changes sustained as a resultof those storms hitting coastal areas.Question 2:Does this study address the impacts of the Deepwater Horizon Oil Spill in the Gulf ofMexico in 2010?Answer:No. Data on any wetland losses resulting from the Deepwater Horizon oil spill are not includedin these results, although the incident served to highlight the ecological and economicimportance of these marine and estuarine resources.*The 1977 amendments, the Clean Water Act of 1977 [P.L. 95‐217]5
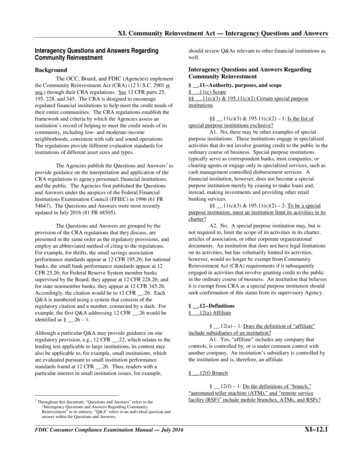
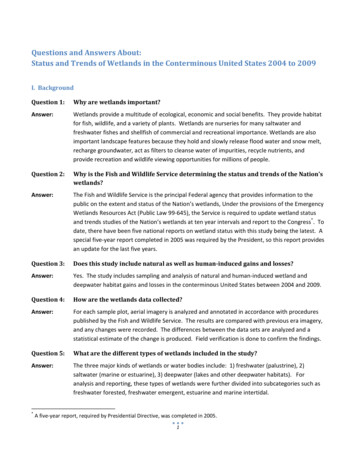
V. About Freshwater PondsQuestion 1:Why does FWS include ponds as wetland?Answer:The wetland classification system described by Cowardin et al. (1979) recognized ponds as animportant component of the aquatic ecosystem and included them within a larger system offreshwater wetlands. This classification system for wetlands is the agency standard as well asthe Federal Geographic Data Committee national standard for wetlands monitoring andreporting.Question 2:What does this study say about the increase in open water ponds?Answer:There was a net increase of 207,200 acres of freshwater ponds between 2004 and 2009, and thiscontributed a 3.2 percent increase in the extent of freshwater wetland ponds nationally. Pastpractices of replacing lost wetlands (of any type) with small permanent ponds has beendiscouraged. However, data from this study indicated that freshwater pond creationoutdistanced increases of most other wetland types (except freshwater emergent) and was stilla component of wetland reestablishment and creation strategies.Question 3:What is the issue with ponds?Answer:The increase in the number of ponds has raised issues regarding the ability of open waterwetlands to replace other natural wetlands. Currently, there is no clear consensus in scientificliterature about constructed ponds providing functional equivalency for lost wetlands.Freshwater ponds, like many other types of wetlands, have the potential to provide multipleecological functions as supported by a number of scientific studies. However, there are alsonumerous examples in the scientific literature that cited ponds as less desirable.Question 4:What additional information about open water ponds and pond types came from thisstudy?Answer:This study incorporated a method for further categorizing the physical characteristics andecological characteristics of freshwater ponds on the landscape. Additional descriptivecategories for freshwater ponds were included, and the information was intended to provideusers with additional insights about what types and how many ponds were created over time.These freshwater pond categories and the distribution of each type are shown below. Anestimated 83% of ponds created since 1998 have remained as open water.6
Aquaculturee4%Urban15%Faarm Ponds44%Natural31%Industrial6%Percent occcurrence of fresshwater pond types; 2009.nds and farm ponds increased in area wwhile aquacultture ponds annd ponds with naturalUrban poncharacterisstics declinedd since 2004. Although thee assessmentt of the qualittative aspectss of thesepond types was beyondd the scope of the study, t he report higghlighted issues regarding the typesds that have beenbreestablished or creaated.of wetlandQQuestion 5:Will creatted freshwaater ponds becomebvegeetated wetlaands?AAnswer:While the ultimate goal of constructting some opeen water wettlands is unknnown, this stuudy foundthat 83% ofo freshwater ponds present in the stat us and trendss survey in 19998 retained open‐water, ponnd‐like characcteristics in 20009.QQuestion 6:How doess the currennt Status andd Trends Reeport wetlannd delineation method (theCowardinn method) avoid includiing those poonds or otheer water ‐ orr wet‐featurres ofland that really do noot qualify ass?AAnswer:TStudy iis a scientific approach to monitor the nation’sThe Service’s Wetlands Status and Trendsua consisstent, biologiccal definition. Cowardin eet al. (1979) reecognized ponds as anwetlands usingimportant component ofo the aquaticc ecosystem aand included them within a larger systeem offreshwater wetlands. ThisT classificattion system ffor wetlands bbecame a Serrvice Standardd (1980)t Federal GeographicGDaata Committeee standard foor wetlands mmonitoring anndas well as thereporting (December(177, 1996).ed from the Sttatus and Treends study as non‐wetlandd include theWater feattures excludefollowing: Stock wateringwtankksSwimmming poolsIndusttrial waste pitts7
Stormwater drainsGarden ponds or fountains (Koi or Coy ponds)Water treatment facilitiesMunicipal or industrial water storage tanksSewage treatment facilities (other than wetlands filtration systems)Water cooling towers or tanksRoad culverts or ditchesOther “ephemeral” watersThe Service identifies wetlands and deepwater habitats primarily by the analysis of high altitudeimagery. The features listed above can be accurately and consistently identified by uniquegeometric shapes, size, geographic location and surrounding land use, and proximity toindustrial, municipal or residential structures. Wetland image analysts are responsible forecological integrity of the delineation process. These analysts are highly trained, skilled, andexperienced wetlands interpreters familiar with wetland ecology, classification, and ecologicalchange detection techniques.VI. Wetland Quantity and QualityQuestion 1:How will information on wetlands acreage trends be linked to wetland conditionassessment?Answer:The U.S. Environmental Protection Agency (EPA), in collaboration with States, Tribes, theService, and other Federal partners will conduct the first‐ever National Wetland ConditionAssessment (NWCA) in 2011. The NWCA is designed to build on the success of the Service’sWetland Status and Trends Report. Just as this report characterizes wetland acreage bycategory across the conterminous U.S., the NWCA will characterize wetland conditionnationwide for many of the same wetland classes. When paired together, the two efforts willprovide the public and government agencies with comparable, national information on wetlandquantity and quality. The wetland quantity information produced by this report provides dataon wetland acreage gained or lost annually, where the greatest gains and losses are occurring,and what wetland types are most vulnerable to loss. The NWCA will provide detailedinformation on wetland quality by wetland type and area of the country, providing additionalclarity into the implications of the acreage gains and losses.Question 2:How will the NWCA assess wetland quality?Answer:EPA in collaboration with committed Federal, State, Tribal and academic experts from across thecountry, developed standard methods for collecting wetland data and assessing wetlandcondition for the conterminous United States. Detailed information on the NWCA technicalapproach can be found in the documents urvey/.8
VI. Sampling and StatisticsQuestion 1:Why is a sampling approach used to account for wetland acreage?Answer:Wetlands are a scarce habitat type and their distribution is not uniform across the landscape.To conduct a comprehensive inventory would be prohibitively expensive. Consequently, theService is determining wetland acreage status by using a statistical sampling approach thatinvolves more than 5,000 plots, each four square miles in area.Question 2:Imagery used for this study ranged between 2004 and 2009. How were statisticalestimates constructed when the time period between observations was not fiveyears?Answer:Imagery dates for all sample plots were tracked by the statistical software measuring theamount of area change and difference in time between Time 1 and Time 2. Start and end dateswere normalized making the effective date of the study 2004 and 2009 with a 4.5 year meandifferential between target dates.Question 3:Previous Wetlands Status and Trends studies utilized 4,682 sample pots while thisstudy used 5,048 sample plots. Why the difference?Answer:This study was augmented by adding sample plots to form a coastal stratum along the Pacificcoast of Washington, Oregon, and California. Working in cooperation with the EPA and NOAA,this sampling stratum was incorporated as part of the national sampling effort to provideestimates of estuarine and marine wetlands not included in the original sample design andprovide a more complete estimate for these wetland types nationally. This was done inconjunction with the project manager and the project statisticians to ensure equitable spatialcoverage and retain sampling integrity.Question 4:This report shows an estimate of 110.1 million acres of wetlands in 2004, while 107.6million acres were reported in the previous report. Why is there a difference?Answer:The acre estimate from the previous report had a coefficient of variation of 2.8 percent. Theacre estimate from this report has a coefficient of variation of 2.7 percent. The differencebetween the two estimates is about 2.5 million acres which is less than the coefficient ofvariation of 2.9 million acres. We can speculate on the cause for the difference, but as long asthe estimates are within the statistical range of error ( or ‐ 2.9 million acres), the estimate isconsidered valid. The current report explains this difference.Question 5:Why are there differences between the National Resources Inventory (NRI)conducted by NRCS and the Wetlands Status and Trends Report from FWS?Answer:The FWS and the NRCS both collect data on wetland changes. Each agency has a differentmission and different legislative mandates. Each program has evolved with the assistance ofspatial sampling experts and resource specialists, and each has incorporated programmatic9
goals to collect the needed information requested by the respective agencies. This studysamples wetlands on all lands in the conterminous U.S. regardless of land ownership. NRIconcentrates on rural, non‐federal agricultural lands. There also are some other importantdifferences, including how sampling was conducted in coastal regions and temporal differencesin monitoring cycles.Question 6:What statistical reliability is provided with the area estimates?Answer:The Service has always tried to produce statistical estimates with the coefficient of variationassociated with those estimates in its Wetlands Status and Trends reports. For this study, theService generated statistical estimates and the coefficient of variation for each of thoseestimates.VII. Quick facts from the reportTotal number of all wetlands 110.1 million acres of wetlands. Freshwater wetlands 95 % or 104.3 million acresSaltwater 5% or 5.8 million acresWetlands compose 5.5 % of the surface of the conterminous U.S.Net loss 62,300* acres between 2004 to 2009 4.5 yearsAverage annual net loss 13,800* acresVIII. History of wetland change tracked by FWS1950s to 1974 458,000 acres average annual net loss1974 to 1984 290,000 acres average annual net loss1984 to 1998 59,000 acres average annual net loss1998 to 2004 32,000 acres average annual net gain2004 to 2009 13,800* acres average annual net lossSeptember 28, 2011*Not statistically significant.10
Question 8: Was there evidence of climate change effecting wetlands? Answer: Yes. Losses of estuarine emergent (salt marsh) and changes in marine and estuarine non‐ vegetated wetlands reflected the impacts of coastal storms and relative sea level rise along the coastlines of the Atlantic and Gulf of Mexico.