Transcription
COMPARISON OF LIFE CYCLE ASSESSMENTTOOLS FOR ROAD PAVEMENTINFRASTRUCTUREJoao Miguel Oliveira dos Santos, Senthilmurugan Thyagarajan, ElisabethKeijzer, Rocio Fernandez Flores, Gerardo FlintschTo cite this version:Joao Miguel Oliveira dos Santos, Senthilmurugan Thyagarajan, Elisabeth Keijzer, Rocio FernandezFlores, Gerardo Flintsch. COMPARISON OF LIFE CYCLE ASSESSMENT TOOLS FOR ROADPAVEMENT INFRASTRUCTURE. Transportation Research Record, SAGE Journal, 2017, 2646, pp28-38. 10.3141/2646-04 . hal-01651565 HAL Id: 1651565Submitted on 29 Nov 2017HAL is a multi-disciplinary open accessarchive for the deposit and dissemination of scientific research documents, whether they are published or not. The documents may come fromteaching and research institutions in France orabroad, or from public or private research centers.L’archive ouverte pluridisciplinaire HAL, estdestinée au dépôt et à la diffusion de documentsscientifiques de niveau recherche, publiés ou non,émanant des établissements d’enseignement et derecherche français ou étrangers, des laboratoirespublics ou privés.
COMPARISON OF LIFE CYCLE ASSESSMENT TOOLS FOR ROAD PAVEMENTINFRASTRUCTUREJoão Miguel Oliveira dos SantosMarie Curie Post Graduate Research FellowIFSTTAR, AME-EASERoute de Bouaye, CS4, F-44341 Bouguenais, FranceE-mail: joao.oliveira-dos-santos@ifsttar.frSenthilmurugan Thyagarajan (Corresponding author)Research Engineer, ESC Inc.Turner Fairbank Highway Research Center6300 Georgetown Pike, McLean, VA 22101Phone: (202) 493-3157Fax : (202) 493-3161E-mail: senthil.thyagarajan.ctr@dot.govElisabeth KeijzerResearcher, Climate, Air & SustainabilityTNO, Postbox 80015, 3508 TA UtrechtThe NetherlandsE-mail: elisabeth.keijzer@tno.nlRocío Fernández FloresACCIONA S.A. Corporate Division. Sustainability and CSR AreaAvda. Europa, 18, 28108 Alcobendas (Madrid)E-mail: rocio.fernandez.flores@acciona.comGerardo FlintschDirector, Center for Sustainable Transportation Infrastructure, VTTIProfessor, The Charles E. Via, Jr. Department of Civil & Environmental Engineering3500 Transportation Research Plaza, Blacksburg, VA 24061Phone: (540)-231-9748 / 231-1569Email: flintsch@vt.eduWord Count: 6,179 3 250 2 250 7,429Number of Tables: 3Number of Figures: 2Submission Date: February 28, 2017
Santos, Thyagarajan, Keijzer, Flores, and Flintsch2ABSTRACTRoad pavements have considerable environmental burdens associated with their initialconstruction, maintenance, and usage, which has led the pavement stakeholder community tocongregate efforts to better understand and mitigate these negative effects. Life cycle assessment(LCA) is a versatile methodology to quantify the effect of decisions regarding the selection ofresources and processes. However, there is a considerable variety of tools for conductingpavement LCA. The objective of this paper is to provide the pavement stakeholder communitywith insights on the potential differences in the life cycle impact assessment results of apavement by applying American and European LCA tools, namely PaLATE V2.2, VTTI/UCasphalt pavement LCA model, GaBi, DuboCalc, and ECORCE-M, to a Spanish pavementreconstruction project. Construction and maintenance life cycle stages were considered in thecomparison.Based on the impact assessment methods adopted by the different tools, the followingindicators and impact categories were analyzed: energy consumption, climate change,acidification, eutrophication, and photochemical ozone creation. The results of the case studyshowed that it is of crucial importance to develop (1) a standardized framework for performing aroad pavement LCA that can be adapted to various tools and (2) local databases of materials andprocesses that follow national and international standards.
Santos, Thyagarajan, Keijzer, Flores, and Flintsch3INTRODUCTIONRoad pavements have considerable environmental burdens associated with their construction,maintenance, and use. Concurrently, the environmental issues are becoming more relevant insocial and political contexts. This has led the pavement stakeholder community to congregateefforts to better understand and mitigate these negative effects.A “twining” activity was initiated in 2014 between the LCE4ROADS consortium (FP7European Union-funded project Grant Agreement nº 605748), led by ACCIONA, and the U.S.National Sustainable Pavements Consortium pooled fund effort, led by the Virginia Departmentof Transportation (VDOT), supported by the U.S. Federal Highway Administration (FHWA) andthree other state Departments of Transportation (DOTs), and managed by the Virginia TechTransportation Institute (VTTI). This cooperative initiative resulted from an arrangement signedin Washington on February 12, 2013, by the European Commission (EC) and the U.S. DOT thataims to foster collaboration on research, development, and technology transfer activities that areof mutual benefit. In particular, the main objective of this twining activity is to foster theexchange of knowledge across the Atlantic, finding synergies in research aimed at enhancingsustainability in pavements. The agreement focuses on the following aspects:(1)Life cycle assessment (LCA) methodologies and their applications to roadpavement construction and maintenance practices;(2)Life cycle cost analysis (LCCA) for pavements and integration of use phasemodels, including analysis of the influence of pavement deterioration on vehicle fuelconsumption and emissions and the interaction between pavement, environment, and humans;(3)Climate change (CC) adaptation measures for road infrastructures;(4)Product Category Rules (PCRs) and Environmental Product Declarations (EPDs);and(5)Implementation of strategies in terms of Green Public Procurement for roadinfrastructures.To improve the sustainability of road pavement infrastructure, road agencies andconstruction companies are adopting appropriate methodologies and tools to identify priorityareas for improvement. Thus, it is necessary to know the impact of pavements on theenvironment to develop and implement approaches and procedures that can produce the greatestgains in all aspects and dimensions of the system. LCA is a versatile methodology capable ofinforming decisions on resource and process selection to better understand, measure, and reducethe environmental impacts of a system (1).However, there is a considerable variety of tools for conducting pavement LCA, andthere are notable differences between them. Available tools cover different phases and processesof the pavement’s life cycle, take different environmental issues into account, and model withdistinct levels of accuracy within chosen functional units and system boundaries. They can beglobal, national, or even regional or local. They have also been developed for different purposes(e.g., research, consulting, and decision making), and their domain of applicability is tailored fordifferent phases of a project’s life cycle (e.g., planning, designing, construction, andmaintenance). Also distinct is the level of interaction they allow with the user. While some of thetools are “black boxes” in the sense that only the default processes and data can be used, othersallow users to use their own data, to choose the database that best match the features of the casestudy, or even to modify the existing datasets.
Santos, Thyagarajan, Keijzer, Flores, and Flintsch4ObjectivesThe main objective of this paper is to provide the pavement stakeholder community with insightson the potential differences in the life cycle impact assessment (LCIA) results of a pavementLCA by applying American and European LCA tools to a Spanish case study. As a consequenceof comparing the features of different tools and potential life cycle environmental impacts, thedifferences in datasets and life cycle inventory (LCI) will be analyzed as well. In order to avoidan excessive level of complexity, the number of tools considered in the study had to becontrolled. The tools selected were (1) PaLATE V2.2, (2) VTTI/UC asphalt pavement LCAmodel, (3) GaBi; (4) DuboCalc, and (5) ECORCE-M.BackgroundOver the last few years, many LCA tools have been developed for assisting decision makers inevaluating the environmental performance of their pavement-related decisions. The set ofpavement-specific LCA tools includes ROAD-RES (2), PaLATE V2.2 (3), UK asphalt pavementLCA model (4), ROADEO (5), CMS RIPT (6), PE-2 (7), CFET (8), ECORCE-M (9), DuboCalc(10), CO2NSTRUCT (11), VTTI/UC asphalt pavement LCA model (12, 13), and Athena ImpactEstimator for Highways (14). Commercial LCA tools, such as SimaPro (15) and GaBi (16),despite being not specifically designed for pavement-specific LCA, have been used for thatpurpose (17, 18) since they are quite complete in terms of the elementary flows inventoried andunit processes taken into account, some of which are particularly applicable to the pavementdomain (e.g., raw materials and equipment fuel combustion).Overview of the Tools ComparedThe tools assessed in this study are briefly described, and the main aspects of each one arehighlighted. An overview of the impact categories included in each tool is given in Table 1.Furthermore, despite not being considered an impact category, the eventual ability of the tools totrack the energy consumption throughout the pavement life cycle is also displayed. Table 2describes the types and number of elementary flows characterized by the LCA tools. SincePaLATE V2.2 accounts only for CO2, it was not included in the table.VTTI/UC Pavement LCA ToolThe VTTI/UC asphalt pavement LCA tool is a project-level pavement LCA tool conceived toestimate the environmental burdens associated with materials extraction and production,construction, maintenance and rehabilitation (M&R), transportation of materials, work-zone(WZ) traffic management, usage, and end-of-life (EOL) phases of the life cycle of a flexible roadpavement located in the United States. It was developed as a collaborative effort between theUniversity of Coimbra, Portugal, and Virginia Tech.PaLATE V2.2PaLATE V2.2 stands for Pavement Lifecycle Assessment Tool for Environmental and EconomicEffects and was originally developed by Horvath et al., in 2003 (19). The tool used in this studywas a modified version of PaLATE V2.2 developed to complete project requirement LCI for theGreenroads Rating System. The tool primarily uses the Economic Input-Output (EIO)-LCAapproach, but transportation and equipment emissions are calculated according to a Processbased LCA (P-LCA) approach.
Santos, Thyagarajan, Keijzer, Flores, and Flintsch5PaLATE V2.2 adopts both the Carnegie Mellon University EIO-LCA software databasefor US 2002 NAICS Producer numbers, and the Transportation Energy Data Book Edition 29from 2010, which contains values that are typically more recent (2006 and 2007 years wereavailable for most data).GaBiGaBi software was developed by PE international in collaboration with the University ofStuttgart. It details the costs, energy, and environmental impact of sourcing and refining everyraw material or processed component of a manufactured item. GaBi software combines GaBiDatabases, created by PE INTERNATIONAL, with other commercial databases and regionalcontent such as Ecoinvent, US LCI, ELCD, and others. GaBi datasets include both aggregatedand unit process datasets. For modeling the life cycle of the road, ACCIONA has used theavailable database modules from GaBi to account for specific processes and materials for theconstruction industry.DuboCalcDuboCalc is the abbreviation of “Duurzaam Bouwen Calculator,” meaning “SustainableConstruction Calculator” in Dutch. It is a software program which was developed some yearsago by the Dutch NRA Rijkswaterstaat in order to stimulate sustainability in procurementprocedures. Nowadays, a calculation with DuboCalc (already version 4) is compulsory in alllarge procurement procedures.The results of the DuboCalc calculation are automatically weighted with the Dutch set ofshadow prices for the construction sector. In this way, all environmental impacts can bedescribed in a single value, the MilieuKostenIndicator (MKI). For the analysis in this study, thenon-weighted values were copied manually from the DuboCalc database in order to be able tocompare them with the values of the other tools.ECORCE-MECORCE-M stands for ECO-comparison Road Construction and Maintenance, and is a softwaretool developed by IFSTTAR in collaboration with CEREMA of the French Ministry of Ecology,Sustainable Development and Energy (MEDDE). It aims to provide a robust assessment forcalculating a set of mid-point indicators in the framework of LCA resulting from varioustechnical choices performed during the call for the tender phase, project execution phase, or uponfinal completion of the work. These choices involve (1) construction and structural maintenanceof pavements on road corridors; (2) installation of the foundation layer; (3) preparation of theupper part of the earthworks; and (4) construction of fills. ECORCE-M uses LCI data gatheredfrom the scientific literature and validated during a standard review processes implemented byinternational publications (consisting of at least two anonymous reviewers).METHODOLOGYGoal and Scope DefinitionThis paper presents and compares the results of an LCA of a pavement reconstruction project ona Spanish road section, N-340, located in Elche (Alicante), performed through the application ofseveral LCA tools.
Santos, Thyagarajan, Keijzer, Flores, and Flintsch6Functional UnitThe function of the product system is to provide safe, comfortable, economical, and durabledriving conditions over the project analysis period. The functional unit considered as a referencebasis is the quantified function provided by the product system. In this case study, it is defined as1 km of mainline pavement and year. The analysis period is 20 years and comprises themaintenance of the top layer of the pavement structure at year 10. The assessed road section is1,568 m long and has four lanes, divided into two roadways separated by a central separator. Theinputs (raw materials and energy consumption) were collected and quantified from theACCIONA work site in 2012.System Boundaries and General AssumptionsThe N-340 road received an EPD in December 2013 (20). EPD is an Eco-label type III that aimsto communicate transparently the environmental performance of a product, process, or system. Itfollows the rules established both in International Organization for Standardization (ISO) 14025(21) and in the PCR guideline. In this project, the PCR named “highways, streets and roads” (22)was used.To compare the different LCA tools in a fair way, only the pavement life cycle phasesand sub-phases that can be assessed with all five LCA tools were included in the analysis: (1)materials extraction and production, (2) transportation of materials, and (3) construction andM&R. The environmental impacts related to the usage phase and the traffic disruption caused bythe performance of M&R activity were not assessed because not all of the tools evaluated in thisstudy are capable of assessing these phases. Finally, the EOL was not taken into account becauseof its negligible contribution to the environmental life cycle impacts ( 1%) (22). For furtherinformation on the definition of the phases mentioned above, the reader is referred to Santos etal. (13).As far as the materials extraction and production phase is concerned, it must be noted thatat least 99% of material and energy requirements during the pavement life cycle wereconsidered. The construction stages accounted for in this study are as follows:(1)Demolition of the old pavement and fence;(2)Soil excavation and movement;(3)Pavement structure construction;(4)Road sub-structure construction (e.g., drainage system);(5)M&R of the top layer.Other stages, such as the production of traffic control devices (for signposting and fordiverting traffic) and the construction of tunnels and bridges, were not included in the analysisdue to their negligible contribution in this specific case study. When modeling the transportationof materials phase, an average distance of 20 km was considered for all concrete-based materials,since there is a concrete plant near the road. For the borrowed soil and aggregates/gravelmaterials, an average distance of 15 km was assumed. With regard to the transportation of thesoil removed from the work site, a 3-km long hauling movement was adopted.Finally, the environmental impacts stemming from the construction of the infrastructureassociated with intermodal activities, the operation of vehicles for loading and uploading atterminals, the production of manufacturing equipment, and personnel activities were alsodisregarded.
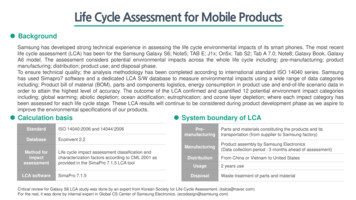
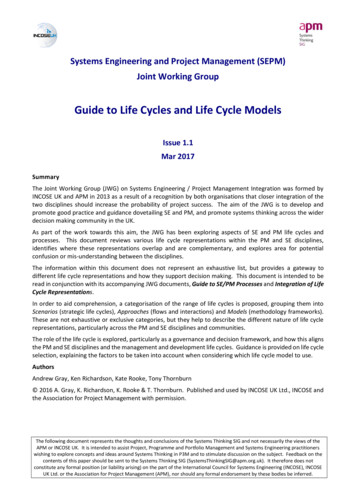
Santos, Thyagarajan, Keijzer, Flores, and Flintsch7Life Cycle InventoryThe LCI stage of an LCA aims to identify and quantify the environmentally significant inputsand outputs of a system by means of mass and energy balances. Specifically, it consists of adetailed compilation of environmental inputs, such as material and energy, and elementaryoutputs, such as air emissions, water effluents, and solid waste disposal at every phase of theproduct’s life cycle. In turn, the elementary output flows are inventoried according to themethodology of each tool and the databases that feed them. Table 3 summarizes the type ofmaterials applied in each construction stage considered in the case study.Life Cycle Impact AssessmentIn the LCIA stage of an LCA, the LCI results are assigned to different impact categories basedon the expected types of impacts on the environment. The first step of LCIA consists ofclassifying the environmental loading into various categories, known as classifications.Characterization factors are then used to quantify the magnitude of the contribution that the LCIflows may have in producing the associated impact (12). Additionally, there may be a later phaseof normalization, in which the results of each impact category are scaled by a reference numberand combined using a final weighting, which is based on socio-political preferences and leads toa unique score as result.In this study, the classification and characterization steps were performed by applyingseveral impact assessment methods, which depended on the tool being used. The Center forEnvironmental Studies of the University of Leiden’s “CML 2001” impact assessment method(23) is implemented by several tools, either in a direct way (i.e., GaBi) or by adapting theoriginal indicators (i.e., ECORCE-M and DuboCalc). Alternatively, the VTTI/UC pavementLCA tool adopts the Tool for the Reduction and Assessment of Chemical and otherenvironmental Impacts 2.0 (TRACI 2.0) method (24). In the case of PaLATE V2.2, only the CCimpact category is considered, taking the CO2 emissions exclusively into account.The LCIA indicators were calculated at the mid-point level from (1) resourceconsumption flows (e.g., energy), (2) air emission flows (e.g., the 100-year horizon CC, etc.),and (3) air, soil, and water pollutant flows (i.e., toxicity indicators).RESULTS AND DISCUSSIONImpacts on a Material LevelFigure 1 shows the potential environmental impacts of the materials used in this case study, perkilogram of material, and calculated by the different tools. All axes are cut-off and the scoresgreater than the cut-off threshold are displayed in boxes.On the x-axis, the percentages (%) next to each material identifier show the coefficient ofvariation (CV) of the values (calculated as the ratio of standard deviation to mean) per materialin each impact category. Furthermore, because not all tools cover the same impact categories (asshown in Table 1), the graphs present only the results obtained with the tools that are able toconsider the impact category under evaluation.At first glance, it is clear that the impacts per kilogram of material differ largely amongthe tools for some of the materials, while other materials have rather comparable impacts. Takingthe CC impact category as an example, Figure 1a shows that the CV values range approximatelyfrom 32% to 121%. Water and concrete C20 present the highest variability (121% and 112%,respectively). Cement, concrete C15, and concrete brick also exhibit high CV values (86% to111%), though the LCIs associated with these materials are well defined and have been
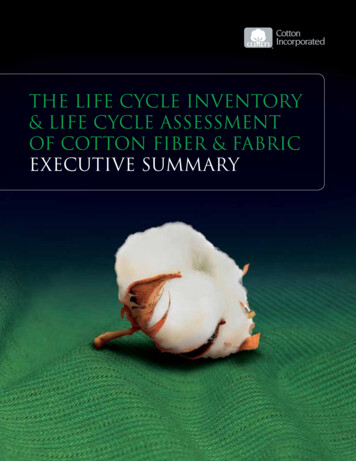
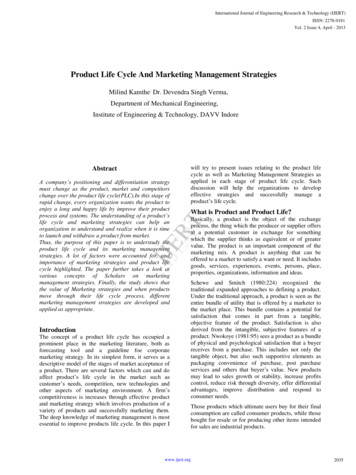
Santos, Thyagarajan, Keijzer, Flores, and Flintsch8quantified by researchers for many years. On the contrary, asphalt concrete, bitumen, andbitumen emulsion denote the lowest variability (30% to 60%). In general, the scores for theremaining materials have a much lower impact than the materials that present high levels ofvariability. One can conclude that the generality of the most common and bulk materials are wellresearched and represented by the tools, while the LCIs of more specific materials, such as water,formwork, and glass fibers are more difficult to quantify in an accurate fashion, and, thus, havebeen either disregarded by several tools or based on proxy elements.When comparing the CV values of the same material across the several impact categories,the CC impact category was found to exhibit the lowest levels of variability for the generality ofthe materials. This result is explained by the fact that all the LCIA methods adopted by the tooluse the characterization factors based on the Intergovernmental Panel on CC model. On the otherhand, the energy consumption indicator generates the highest CV values. To a great extent thisoutcome can be explained by the fact that the impact category scores calculated with the GaBitool are extremely high for the majority of the materials in comparison to the scores calculatedwith the other tools. Such a result suggests that GaBi might have other definitions for thesematerials or consider different system boundaries, which might influence the conclusions drawnfrom this case study. Furthermore, this discrepancy also illustrates the importance of usingconsistent sources and local databases as different materials may have different sources or maybe produced by using different processes with different environmental loads.LCIA ComparisonFigure 2 presents the environmental impacts associated with each construction stage consideredin the case study and the relative contributions to the total score on various impact categories thatare computed by the majority of the LCA tools.In general, considerable variation was observed within each impact category computed bythe different LCA tools. The GaBi tool was found to yield the lowest impact scores whencompared with the other evaluated tools. Interestingly, the POC scores associated with stages 1and 2 possess a negative value. This result indicates that in these stages there is a mitigationeffect on the POC impact category.To the contrary, PaLATE V2.2 was found to produce the highest scores for the twoimpact categories that it is able to account for (i.e., CC and energy consumption). The onlyexception to this general trend was observed in the case of the energy consumed during stage 3.The VTTI/UC and ECORCE-M tools denoted similar CC and energy consumption scores. Thisresult contrasts with those observed for the remaining impact categories, as they were found tovary considerably. Also, the scores obtained with VTTI/UC and ECORCE-M tools were higherthan those generated by GaBi for all impact categories. The DuboCalc tool producedintermediate scores relative to those generated by GaBi and VTTI/UC for the CC and energyconsumption indicators. However, the AC, EU, and POC scores computed by DuboCalc forstages 3, 4, and 5 were the highest among those calculated by all the compared tools.Regarding the relative contributions of each construction stage to the total scores, Figure2 (right) shows that construction stage 1 is the smallest contributor for each impact category,regardless of the LCA tool considered. Construction stage 3 was found to be the maincontributor. The only exception to this uniform outcome was obtained with PaLATE V2.2. Asexplained before, the quantity of soil used in stage 4 combined with the LCA approach adoptedby PaLATE V2.2 led to a higher relative contribution from this stage to both CC and energyconsumption indicators.
Santos, Thyagarajan, Keijzer, Flores, and Flintsch9Explaining the DifferencesThe results presented in the previous sections show that there is a non-negligible difference inthe impact category scores calculated with the different tools under evaluation. Several factorscan explain, totally or partially, such differences. Furthermore, some of these factors are relatedto each other, which leads to an overlapping of their effects. The factors that may explain thedifferences include (1) database comprehensiveness; (2) level of categorization of LCI flow data;(3) LCA approach; (4) LCIA method; (5) technical, temporal, and geographicalrepresentativeness; (6) system boundaries and allocation methods; and (7) process modelingapproach. These factors are analyzed and discussed in the following sub-sections.Database ComprehensivenessData quality is composed of accuracy (i.e., representativeness and methodologicalappropriateness and consistency), precision/uncertainty, and completeness of the inventory. Asfar as the last characteristic is concerned, Table 3 shows that not all the databases that feed thetools include the same materials. For example, the material “Glass fibers filaments” is onlyconsidered by GaBi and PaLATE V2.2. In turn, DuboCalc adopts an analogous material as aproxy, while the remaining tools do not consider this element at all. This aspect is particularlyimportant since the environmental impacts associated with the production of a unitary quantity ofthis material are the highest amongst all materials (Figure 1). Despite the low quantity of “Glassfibers filaments” required in this case study, its absence from the majority of databasesconnected to the tools obviously lowers the accuracy of the assessment, and, therefore, explainsto some extent the differences observed in the impact category scores.Level of Characterization of LCI Flow DataSome LCI datasets specify all individual substances. Others report only the main ones, thusproviding less-detailed information. A reduced LCI will, thus, produce a simplified calculationof the environmental impacts. That is the case of the database hosted by the VTTI/UC, asdenoted in Table 2. Furthermore, some tools report emissions to air, water, and soil (i.e., GaBi,DuboCalc, ECORCE-M, and PaLATE V2.2) while others (VTTI/UC) account exclusively forairborne emissions. Such simplifications may lead to less-accurate scores for the impactcategories that rely on a higher number and type of elementary flows. Fortunately, in practice itis often only a rather limited number of emissions and processes that relevantly contribute to theoverall impacts. Hence, for the sake of a better allocation of resources (e.g., time, money, etc.) tothe data collection process, it is of crucial importance to correctly identify and focus on the mainflows.Moreover, some substances, such as hydrocarbons and sulfur oxides, are commonlycategorized in an aggregated way, leading to differences between inventory datasets in values ofindividual substances and substance categories. Also, because the naming of the substances andsubstance categories listed in the various inventory datasets can often vary, it is not clear exactlywhich substances compose the substance categories, and, thus, double counting errors may arisedue to an incorrect use of characterization factors.LCA ApproachIn general, there are two main approaches to LCA: P-LCA and EIO-LCA. While the P-LCAapproach assesses specific product types, the EIO-LCA approach uses aggregate data
Santos, Thyagarajan, Keijzer, Flores, and Flintsch10representing the averages of several sectors of an economy. However, those data are generallyseveral years old, and, thus, assessing rapidly developing sectors and new technologies mayintroduce errors because of base-year differences between the product system under study andthe input-output data. From the LCA tools compared in this case study, the PaLATE V2.2 usesprimarily EIO data, while the others rely on process-based datasets. This fact may explain whythe impact assessment scores obtained with this tool are in general higher than those provided bythe remaining tools.LCIA MethodThe use of different LCIA methods may affect LCA results noticeably depending on the impactcategory, though the influence seems to be small in the CC impact category. Impact assessmentmethods are often primarily modeled on a global average basis. That means that the modeling isperformed by assuming average conditions, regardless of where the production takes place andconditions of the source. While for some impact categories, such as CC and stratospheric ozonedepletion, this issue is not relevant, since the impacts are aggregated and are independent of thesource of the emissions (25), other impact categories exist in which the substances contributingfor those impact categories stem from a large number of sources and may be sensitive to wherethey are emitted. Therefore, if the LCIA methods under comparison use distinct approaches inthe consideration of site-dependent CF for a given impact category, it is likely that the calculatedscores will show some level of variability. However, this aspect does not seem to be particularrelevant for this case study, in the sense that the majority of the LCA tools being compared adoptthe same LCIA method (i.e., CML 2001), the only exception being the VTTI/UC tool, whichadopts the TRACI 2.0 method. Therefore, any explanation for the differences observed in theimpact assessment scores related to the choice of the LCIA methodology is more likely to berelated to the number and accuracy of the LCI elementary flows tracked by the LCA tools than tothe methods themselves (i.e., th
Flores, Gerardo Flintsch. COMPARISON OF LIFE CYCLE ASSESSMENT TOOLS FOR ROAD PAVEMENT INFRASTRUCTURE. Transportation Research Record, SAGE Journal, 2017, 2646, pp 28-38. 10.3141/2646-04 . hal-01651565