Transcription
Music Recommendation Using Collaborative FilteringVuong Khuatvdkhuat16@earlham.eduEarlham CollegeRichmond, IndianaABSTRACTWith the increasing popularity of music streaming, music recommender systems are important instruments for increasing digitalmusic consumption. However, collaborative filtering, a techniquewidely used in recommender systems, is not generally adapted inthis domain because the technique does not scale well with largeamounts of data. This paper proposes a recommender system using collaborative filtering with an improved runtime by using amore efficient data-representation scheme and considering a partialsection of the dataset.KEYWORDSRecommender Systems, Collaborative Filtering, RecommendationAlgorithms, Machine LearningACM Reference Format:Vuong Khuat. 2018. Music Recommendation Using Collaborative Filtering. .1INTRODUCTIONIn the last 25 years, the use of recommender systems has expandedrapidly [2, 14]. These systems, designed to produce recommendations that match users’ interests, are incorporated into areas suchas news, entertainment, and research [4, 13]. One common technique used by recommender systems is collaborative filtering, whichproduces recommendations for a user based on choices of userswith similar preferences [9]. This paper describes a recommendersystem for music tracks using collaborative filtering.In recent years, music streaming has become increasingly prevalent. Over the first half of 2018, more than 400 billion on-demandsong streaming activities occurred in the United States, whichequates to 360.1 million albums consumed [1]. Good recommendersystems for music tracks can further increase the consumptionfor digital music and therefore are important tools for streamingplatforms.Different techniques have been published in the field of musicrecommendation, notably the deep-content approach proposed byvan den Oord et al. [19] and the automatic tag generation methodby Eck et al. [7]. Collaborative filtering is also used in this field;however, the algorithm does not scale well with large datasets [11].This makes it hard for researchers to use this method with a datasetthat can potentially have millions of users and music tracks. ItPermission to make digital or hard copies of all or part of this work for personal orclassroom use is granted without fee provided that copies are not made or distributedfor profit or commercial advantage and that copies bear this notice and the full citationon the first page. Copyrights for components of this work owned by others than ACMmust be honored. Abstracting with credit is permitted. To copy otherwise, or republish,to post on servers or to redistribute to lists, requires prior specific permission and/or afee. Request permissions from permissions@acm.org.CS488 Senior Capstone, Dec 2018, Earlham College 2018 Association for Computing Machinery.should be noted that recommender systems of large streaming services such as Spotify or Pandora may be built using a combinationof collaborative filtering with other techniques [5]. Nevertheless,details about how these systems are implemented are not publiclyavailable.It is important to build a recommender system using collaborative filtering that not only is accurate but also runs efficiently.In this project, I attempt to build a recommendation systems formusic tracks using collaborative filtering with two optimizationmethods, dataset rescaling and automatic halting. These methodswill be built and tested with different parameters to address theperformance issue while retaining an acceptable accuracy.2 BACKGROUND2.1 Collaborative FilteringCollaborative filtering is a successful and widely-used method forgenerating recommendation in various fields [8][3][6]. The methodprovides recommendations for a target user by estimating the utilityof different items based on the habits or ratings of other users [14].The advantage of this technique is that the behavior of a user cangenerally be predicted from users who are similar. Furthermore,systems that use collaborative filtering can work with any type ofitems and can generate recommendations of different types withinthe same system [10].However, this technique also has some drawbacks. The firstmajor drawback is scalability. In a commercial setting, collaborative filtering algorithms are required to search tens or hundreds ofthousands of users to produce a recommendation. This makes itdifficult to recommend items in real time, especially when the number of users and number of items are extensive. This also requiresa substantial amount of space. Traditional collaborative filteringalgorithms use a two-dimensional matrix to represent the data,where the columns represent individual users and the rows represent individual items. In practice, this matrix will be very sparse,as most users in many large commercial websites are estimated toconsume less than 1% of the contents [15]. Therefore, the matrixrepresentation can be an inefficient and space-consuming method.In the next section, we discuss different types of rating systems.In sections 2.3 and 2.4 we describe prior attempts to improve collaborative filtering. The method in 2.3 uses neighborhood formation[14]; the method in section 2.4 uses a clustering model [18].2.2Types of User Rating Used byRecommender SystemsDetermining the similarity of different users requires recommendersystems to attain a numerical value for every user-item pair whichrepresents the user’s rating of the item. In this section we discusstwo types of user ratings that can be used by recommender systems.
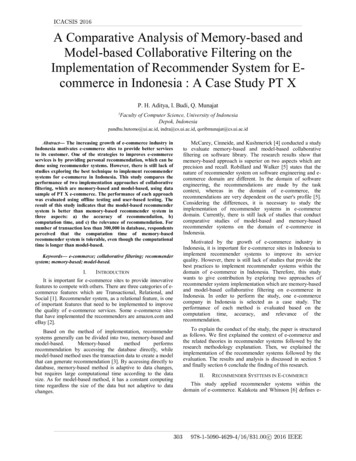
CS488 Senior Capstone, Dec 2018, Earlham College(1) Explicit rating. In this type of rating, users explicitly providesfeedback for different items on a numerical scale (i.e. from1 to 5 where 5 means “strongly like” and 1 means “stronglydislike”). Since ratings are provided directly by users anddo not have to be inferred, it is generally considered a goodrating system [15]. However, it is not practical for users toprovide ratings for every item. Thus, recommender systemsthat work with this rating scheme can only make use of therated items unless they have a method to derive feedbackimplicitly for the unrated items [15].(2) Implicit rating. In this rating system, ratings are not providedby users, but are predicted based on users’ activity. For instance, if someone has not provided a rating for a certainsong but has listened to it more than 20 times, she will likelygive the song a high rating.2.3Neighborhood FormationThe neighborhood formation method was proposed by Sarwar etal. [14]. We will first examine their approach and then consider ananalysis of the approach by Su and Khoshgoftaar [17].The neighborhood formation method aims to find a set of n users,given a user c, such that the ordered set S {c 1 , c 2 , ., c n } has thefollowing property: the similarity function, sim(c, c i ) sim(c, c j )for all i j. The similarity function can be the Pearson correlation method, or the cosine method. The results are used to formneighborhoods. This can be done by using the k-nearest neighborsapproach, which forms a neighborhood around any customer cby selecting k customers closest to c, or by using the aggregatemethod. After generating different neighborhoods, it generates recommendations in two ways: most-frequent item recommendationand association rule-based recommendation. In their evaluationmodel, they concluded that their method could scale better withlarge datasets. The method also produced higher-quality recommendations.An analysis of this approach was published by Su and Khoshgoftaar [17]. The authors determined that the method was easy toimplement, did not need to consider the content of the items recommended, and could scale well with items that were rated similarly.However, they also noted that the approach did not perform wellwith a sparse dataset.The work of this paper is different from Sarwar et al.’s in that ittakes the whole dataset into consideration rather than any particular neighborhood.2.4Cluster ModelThe method of using a cluster model was proposed by Ungar andFoster [18]. In this section, We will summarize the details and resultsof their work, then compare it with the method proposed in thisproject.The cluster model is an approach to reduce computing time andraise recommendation quality. In a traditional approach, all usersand items are modeled using a matrix. However, Ungar and Fosterargued that such representation are inefficient because users havedifferent behavior and thus it is be better to divide the users intogroups, or “clusters,” where each group consists of more like-mindedusers. This method improved efficiency because recommendationsKhuatwere made within groups; the recommendations were also betterbecause they were made from more similar groups of people.Using this model on data of customers from CDNow, a shoppingwebsite for compact discs, the authors concluded that clusteringpeople based on CDs they purchased was hard because the datawere sparse (most people only buy one CD). However, the modelproduced great results when users were clustered using CD clusters(which were CDs by the same artist). An approach using clustermodel may reduce the computation time, but does not guaranteegood recommendations.Compared to Ungar and Foster’s work, the implementation collaborative filtering algorithm of this paper, which will be discussedin more detail in section 3, has a longer runtime. However, since themethod considers the majority of the users in the dataset insteadof a specific cluster, it is expected to produce better results.3METHODOLOGYThis methodology proposed in this paper consists of three maincomponents: Data representation, the collaborative filtering function, and model evaluation (see figure 1). We first introduce a formaldefinition for the tasks this paper aims to solve. Then, we will discuss the dataset used in this work and how it is represented. Thenext section is the implementation of the collaborative filtering algorithm that will be used in the paper to produce recommendations.The final component introduces the steps to evaluate the model.Figure 1: The Overall Framework of This Project.3.1Problem DefinitionFormally, the goal of this project is as follows. Suppose we havea dataset containing a set of n users U {u 1 , u 2 , ., un } and a setof m songs S {s 1 , s 2 , ., sm }. Each user (ui , for example) also hasa set of songs they listened to, which we denote as Sui . Let ua bethe active user (the user we want to recommend songs to) and Nbe the number of songs to recommend. We want to find a set of Nelements Ir I such that ua would like them the most but has notreacted to them (as shown by the dataset).3.2Processing the DataFor this project, the data will be collected from the Echo Nest TasteProfile Subset, which provides play counts of more than 300,000users for approximately 1 million songs [12]. Traditionally, the data
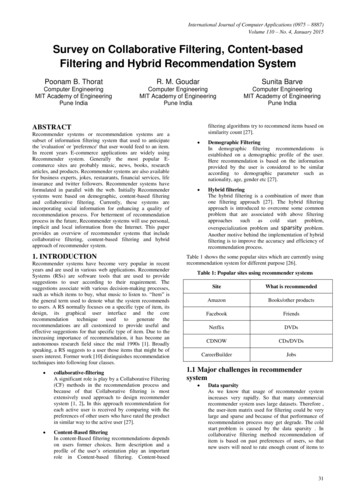
Music Recommendation Using Collaborative Filteringis represented using a m n matrix, where m is the number of songs,and n is the number of users, for example,s1s2.smu110.1u2011.un00.1The value 1 at row ui and column s j means that user ui has listenedto the song s j . In contrast, 0 means that the user has not listened tothe song.However, as noted in 2.1, this matrix is most likely sparse, whichis not space-efficient. In fact, on this specific dataset, only 1.23% ofthe components are non-zeroes. To address this problem, this paperrepresents the dataset as a hash table that maps each user to the setof songs they listened to. Suppose n 1 , n 2 , ., nn are the numbers ofsongs users u 1 , u 2 , .un react to, respectively. Then, the table is asfollows:u 1 : {su11 , su12 , ., su1n1 },u 2 : {su21 , su22 , ., su1n2 },.un : {sun1 , sun2 , ., su1nn }.Using this representation, one can still determine the values of partsof the matrix if necessary. For instance, if we want to get all thevalues of a column ui , then we can simply get non-zero values ofthe column from the key ui of the table and fill the rest with zeroes.3.3Implementing the Collaborative FilteringAlgorithmCS488 Senior Capstone, Dec 2018, Earlham Collegeproportion of similar users have listened to but ua has not. Forinstance, suppose we haveua u2 u3s1 111s2 111s3 111s4 111s5 011The algorithm in this case may suggest that ua , u 2 , and u 3 aresimilar (since they all listen to s 1 , s 2 , s 3 , s 4 ), and recommend tracks 5 , which has been listened to by both u 2 and u 3 . We define ahyperparameter τ to represents the proportion of similar users thatmust have listened to a song for that song to be recommended. Forexample, if τ 0.5, then the algorithm recommend songs that atleast half of the similar users have listened to.3.4One critical part of the algorithm is being able to determine iftwo users are similar. To do this, this paper consider users as mdimensional vectors, where m is the total number of songs in thedataset. With this representation, the similarity of two users, uiand u j can be determined by the cosine of the angle between thecorresponding vectors:cos(u i , u j ) The overall implementation of the collaborative algorithm isgiven in figure 2. The collaborative filtering algorithm will be implemented as a function f . The function takes in the dataset d, auser ua , a positive integer N and returns an list that contains Nsongs that best match ua ’s interest. This is done in two steps.First, f determines the users who are similar to ua . This can bedone using a iterative process: for each user ui that is not ua , if uiand ua are similar, then add ui to the list of similar users.Having produced a list of similar users, recommendations canthen be generated for ua from music tracks that the a specificu i · u j u i u j This is one of the standard techniques for calculating similarity incollaborative filtering algorithms [14]. With the table representationproposed in this paper, the dot product of u i and u j can be calculatedby finding the components in which both vectors have non-zerovalues, then sum up the products of the corresponding values. Thisworks because the components with zero values do not affect thedot product. The strategy of only considering non-zero values isalso used to determine the magnitude of each vector using the tablerepresentation.We define a parameter θ to indicate the largest value the anglebetween u i and u j can have for ui , u j to be considered similar. Inevaluation, we will test the model with different values of θ andanalyze the results.3.5Figure 2: Procedure the collaborative filtering algorithm formusic tracks in this proposal.Determining the Similarity Between TwoUsersTesting and EvaluationIn this section we provide a scheme to evaluate the model in thispaper. Given a user ua , we retain k components of the vector u a ,where k is a positive integer less than m, and set the remainingm k components to 0. We can assume that u a has the forms1s2.sksk 1sk 2.smreal valuereal value.real value.00.0
CS488 Senior Capstone, Dec 2018, Earlham CollegeThen, we apply the collaborative filtering algorithm to generaterecommendations for ua . To prevent the model from producing toomany recommendations, we set the maximum number of recommendations to be 10k, and the songs chosen are the most frequentsongs among the list of similar users. The components that wereset to be 0 are now compared with the corresponding real data.To assess the performance of the model, we collect the followinginformation: Precision: the number of songs which were hidden that are inthe list of recommendations out of all recommended songs,and Recall: the number of songs which were hidden that are inthe list of recommendations out of all hidden songs.These two measurements will be used to assess the accuracy ofthe model. To assess its speed, we measure the average amount oftime it takes the model to generate recommendations for a user.3.6Methods to Improve EfficiencyAs noted by Linden et al. [11], one major challenge of the iterativecollaborative filtering algorithm is its efficiency. The collaborativefiltering algorithm works by iteratively finding users similar to thegiven user. Since there are n users, represented as m-dimensionalvectors, the overall time complexity of the model is O(mn). Thus, itdoes not scale well as the amount of data grows large. The representation presented in section 3.2 improves this runtime since foreach user, only a small subset of songs is considered. This sectionintroduces two methods that are used to reduce the runtime.a. Randomly select a subset of the dataset. This methodselect a fixed-size subset of the dataset. The subset will begenerated at random in order not to create bias in the data.The subset-size parameter will be determined from experiments to determine whether collaborative filtering modelcan run within a reasonable amount of time without decreasing the accuracy rate by a significant amount.b. Halt after finding enough similar users. This method reduces the running time by stopping once the number of similar users found is sufficient to generate recommendations.In the case where the desired amount cannot be reached, weuse a break point after having considered a certain amountof users and use the list of similar users gathered so far togenerate recommendations. Similar to (a), different valuesfor the sufficient number of similar users and the number ofusers for the break point will be experimented so that the runtime of the algorithm and the accuracy rate are reasonable.4Khuatat all. Similarly, only values for the angle θ between 60 and 90 produces a reasonable number of recommendations. The recordedprecision and recall rates for all combinations of τ and θ are shownin table 1 and table 2, respectively.Table 1: Precision rates for different combinations of τ andθθτ0.10.20.30.40.590 84.3 78.6 72.5 66.4 60 0.07870.08150.06000.02000.0400Table 2: Recall rates for different combinations of τ and θθτ0.10.20.30.40.590 84.3 78.6 72.5 66.4 60 0.040.070.000.000.04As θ 84.3 and τ 0.4 give the highest recall rate for themodel, We use these values for the next step, which is to test theparameters in section 3.6. Denote s as the proportion of the generated subset compared to the full dataset, and m as the number ofsimilar users threshold to halt. The execution time of different values for s and m are shown in table 3. The corresponding precisionand recall rates of these tests are also documented in table 4 and 5,respectively.Table 3: Execution time (in seconds) for different combinations of s and VALUATIONWe first evaluate the model with different values for τ and θ , asdescribed in section 3.3 and 3.4, respectively. We pick values for τfrom the set{0.1, 0.2, 0.3, 0.4, 0.5}and θ from the set {90 , 84.3 , 78.6 , 72.5 , 66.4 , 60 }.The rationale behind selecting these values is that experimentsshow with τ 0.1, the model recommends virtually every song inthe dataset, while τ 0.5 does not produce any recommendationTable 4: Precision rates for different combinations of s 20
Music Recommendation Using Collaborative FilteringTable 5: Recall rates for different combinations of s and om table 1, different combinations of τ and θ result in precisionrates ranging from 0.0072 to 0.0815, with the highest value occurringat τ 0.2 and θ 60 . An explanation for this is that these valuescorrespond to the tighter constraints in the hyperparameter space;therefore we get higher precision. However, this combination givesthus a recall rate of only 0.07, which is significantly worse than0.33, the highest value (at τ 0.4 and θ 84.3 .Another observation from the experiments is that the highestprecision rate being less than 10% means that less than 10% of theoriginally hidden songs came up in the recommendations. Thismight not necessarily reflect the quality of the model, as its role isto find songs that the active user might like but do not know about.The schemes proposed in section 3.6 also result in an improvement in runtime. As mentioned in section 4, the average runtimebefore deploying these methods is 5.81 seconds, whereas the runtimes documented in table 3 range from 1.83 to 3.3 seconds. Lowervalues of s and m further reduces the runtime. However, we alsoneed the precision and recall rates for these experiments in orderto conclude whether this improvement also has a large impact onthe accuracy of the model. Interestingly, at s 0.4 and m 1000,we attain the highest values for precision and recall rates at 0.0392and 0.426, respectively. These values are both higher than the corresponding values in table 1 and 2. The results of these experimentsshow that the methods of section 3.6 both reduce the overall runtime and retain the accuracy of the model.6RELATED WORKIn this section, we described Linden et al.’s collaborative filteringalgorithm using an item-based method as opposed to a user-basedapproach proposed in this paper. We then compare the methodwith the approaches discussed in sections 2.2, 2.3 and with thecollaborative filtering implementation of this paper in section 3.Linden et al. [11]’s method was used for generating recommendation by Amazon. The approach is different from other methodsin that rather than finding like-minded users, Linden et al. developed an algorithm that linked a user’s purchased or rated itemsto other similar items. The algorithm iteratively generates a tableof similarity values between a products using the cosine method.Using this table, it can then quickly generates recommendations tousers based on items they have rated or purchased.The major factor that set the method of Linden et al. apart fromthe other implementations of collaborative filtering as well as approaches discussed in previous sections is its computation time. Inthe traditional collaborative filtering method, generating recommendations takes O(mn) time where m is the number of users and nCS488 Senior Capstone, Dec 2018, Earlham Collegeis the number of products. In Linden et al.’s method, however, creating the item-to-item similarity table takes O(mn), but this work canbe done offline. Once the table is created, making recommendationsto user can be quickly done.An analysis from Schafer et. al. [16] noted that this method savedmemory and computation time because it took advantage of thefact that only a subset of the dataset was needed to generate recommendations. While clustering methods could also be efficient, theirrecommendation quality were relatively low. On the other hand,using a traditional approach may result in good recommendations,but their inefficiency made it difficult to implement in practice.Contrary to Linden et al.’s approach, the collaborative filteringalgorithm implementation is based on the similarities betweenusers, not items. It is based on the traditional method, but makesuse of the space and runtime optimization methods discussed insections 3.2 and 3.6.7FUTURE WORKAn immediate extension of this project is to explore other methodsthat manipulate the dataset to reduce the runtime. Such methodswould need to consider properties of the dataset so that the collaborative filtering function can make less comparison without losingaccuracy.Another extension is to compare the performance of the workproposed in this model with other recommendation techniquesother than collaborative filtering.8ACKNOWLEDGMENTSThis project is a part of the Senior Capstone Experience of theDepartment of Computer Science at Earlham College. I would liketo thank Dr. David Barbella, Dr. Ajit Chavan, Dr. Xunfei Jiang, andDr. Charles Peck of Earlham College for their support in this project.REFERENCES[1] 2018. U.S. Music Mid-Year Report 2018. 8/us-music-mid-year-report-2018.html[2] Gediminas Adomavicius and Alexander Tuzhilin. 2005. Toward the next generation of recommender systems: A survey of the state-of-the-art and possibleextensions. IEEE Transactions on Knowledge & Data Engineering 6 (2005), 734–749.[3] Hyung Jun Ahn. 2008. A new similarity measure for collaborative filtering toalleviate the new user cold-starting problem. Information Sciences 178, 1 (2008),37–51.[4] John S. Breese, David Heckerman, and Carl Kadie. 1998-07-24. Empirical analysisof predictive algorithms for collaborative filtering. Proceeding UAI’98 Proceedingsof the Fourteenth conference on Uncertainty in artificial intelligence (1998-07-24),43–52.[5] Sophia Ciocca. 2017.How Does Spotify Know You So a41ab76efe.[6] Chris Cornelis, Jie Lu, Xuetao Guo, and Guanquang Zhang. 2007. One-and-onlyitem recommendation with fuzzy logic techniques. Information Sciences 177, 22(2007), 4906–4921.[7] Douglas Eck, Paul Lamere, Thierry Bertin-Mahieux, and Stephen Green. 2008.Automatic generation of social tags for music recommendation. In Advances inneural information processing systems. 385–392.[8] Xuetao Guo and Jie Lu. 2007. Intelligent e-government services with personalizedrecommendation techniques. International Journal of Intelligent Systems 22, 5(2007), 401–417.[9] Jonathan L. Herlocker, Joselph A. Konstan, Loren G. Terveen, and John Riedl. 200401. Evaluating collaborative filtering recommender systems. ACM Transactionson Information Systems (TOIS) 22, 1 (2004-01), 5–53.[10] Seok Kee Lee, Yoon Ho Cho, and Soung Hie Kim. 2010. Collaborative filteringwith ordinal scale-based implicit ratings for mobile music recommendations.Information Sciences 180, 11 (2010), 2142–2155.
CS488 Senior Capstone, Dec 2018, Earlham College[11] Greg Linden, Brent Smith, and Jeremy York. 2003-01. Amazon.com Recommendations: Item-to-Item Collaborative Filtering. IEEE Internet Computing 7, 1 (2003-01),76–80.[12] Brian McFee, Thierry Bertin-Mahieux, Daniel PW Ellis, and Gert RG Lanckriet.2012. The million song dataset challenge. In Proceedings of the 21st InternationalConference on World Wide Web. ACM, 909–916.[13] Paul Resnick and Hal R Varian. 1997. Recommender systems. Commun. ACM 40,3 (1997), 56–58.[14] Badrul Sarwar, George Karypis, Joseph Konstan, and John Riedl. 2000-10-17.Analysis of recommendation algorithms for e-commerce. Proceedings of the 2ndACM conference on Electronic commerce (2000-10-17), 158–167.[15] Badrul Sarwar, George Karypis, Joseph Konstan, and John Riedl. 2001-05-01.Item-based collaborative filtering recommendation algorithms. Proceedings ofKhuatthe 10th international conference on World Wide Web (2001-05-01), 285–295.[16] Markus Schedl. 2016. The lfm-1b dataset for music retrieval and recommendation.In Proceedings of the 2016 ACM on International Conference on Multimedia Retrieval.ACM, 103–110.[17] Xiaoyuan Su and Taghi M Khoshgoftaar. 2009. A survey of collaborative filteringtechniques. Advances in artificial intelligence 2009 (2009).[18] L. H. Ungar and D. P. Foster. 1998. Clustering Methods for Collaborative Filtering.cial Intelligence (1998).[19] Aaron Van den Oord, Sander Dieleman, and Benjamin Schrauwen. 2013. Deepcontent-based music recommendation. In Advances in neural information processing systems. 2643–2651.
systems that use collaborative filtering can work with any type of items and can generate recommendations of different types within the same system [10]. However, this technique also has some drawbacks. The first major drawback is scalability. In a commercial setting, collabora-tive filtering algorithms are required to search tens or hundreds of