Transcription
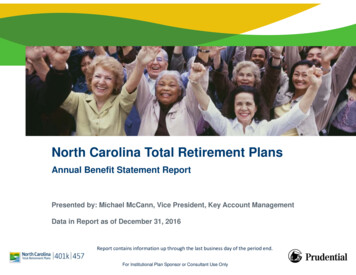
North Carolina Total Retirement PlansAnnual Benefit Statement ReportPresented by: Michael McCann, Vice President, Key Account ManagementData in Report as of December 31, 2016Report contains information up through the last business day of the period end.For Institutional Plan Sponsor or Consultant Use Only
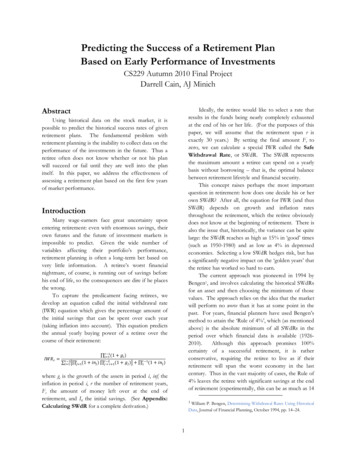
North Carolina Annual Benefit Statement ReportReport MethodologyThe following report is a summary of the Annual Benefit Statements for 2016.The basis for the data included in these calculations is a compilation of informationvia the partnership of The State of North Carolina, Broadridge, TIAA and Prudential.Retirement readiness is for members to replace 80% of their income for retirementat age 62.Retirement readiness is a combination of the following four factors: The State Retirement System North Carolina Total Retirement Plans (401(k), 457 and 403(b) plans) Social Security Outside Assets entered via Prudential's Retirement Income Calculator (RIC)2For Institutional Plan Sponsor or Consultant Use Only
North Carolina Annual Benefit Statement ReportTable of ContentsSection I: Retirement Readiness SummarySection II: Gap & Surplus By Projected Retirement AgeSection III: Gap & Surplus By Projected Retirement Age & RegionSection IV: Gap & Surplus By Current AgeSection V: Gap & Surplus By Current Age & RegionSection VI: Percent of Retirement Replacement IncomeSection VII: Percent of Retirement Replacement Income By RegionSection VIII: Average Monthly Contribution By Replacement Income & AgeSection IX: Percent of New Members With Participation in Supplemental Retirement PlanSection X: Percent of New Members With Participation in Supplemental Retirement Plan By RegionSection XI: Loan Activity By AgeSection XII: Asset Allocation By AgeAppendix: How the ABS is Calculated3For Institutional Plan Sponsor or Consultant Use Only
North Carolina Annual Benefit Statement ReportDisclosuresAssets reflect actual participant account balances and do not include forfeiture and / or expense account assets.Prudential monitors the contractual terms and service guarantees related to the contract for third-party administration of thesupplemental retirement income plan of North Carolina and North Carolina public employee deferred compensation plan.Prudential communicates with Retirement Systems Division staff on our performance with these terms.This information should not be considered an offer or solicitation of securities, insurance products or services. No offer isintended nor should this material be construed as an offer of any product. The information is being presented by us solely inour role as the plan’s service provider and or record keeper.Retirement products and services are provided by Prudential Retirement Insurance and Annuity Company, Hartford, CT, or itsaffiliates. 2017 Prudential Financial, Inc. and its related entities. Prudential, the Prudential logo, the Rock symbol and Bring YourChallenges are service marks of Prudential Financial, Inc., and its related entities, registered in many jurisdictions worldwide.4For Institutional Plan Sponsor or Consultant Use Only
Section I:Retirement Readiness Summary5For Institutional Plan Sponsor or Consultant Use Only
North Carolina Annual Benefit Statement ReportRetirement Readiness 2016 Goal - 66% of all active members are “on track” to replace 80% oftheir replacement income at retirement age 62 and laterSummary: The 2016 Retirement Readiness score is 58.04%, compared to last year’s score of 60.48%.The primary reason for the drop in Retirement Readiness is largely attributed to the drop in Retirement Readinessscore for members with only a pension plan (50.16% to 47.39%, a -5.52% decrease)The Retirement Readiness score for members only in the pension plans experienced another significant drop. Thismetric fell from 60.37% in 2013 to 55.42% in 2014 to 50.16% in 2015 to 47.39% in 2016. This drop is likelyattributed to large portions of the membership receiving salary increases in 2016 (See slide 10 for memberexamples.)The average Retirement Readiness Score for members who also have a 401(k) and/or 457 plan remains strong at72.09%. Even with the impact of salary increases, the score only dropped 2.00% from 2015, which was 74.09%Total asset growth in the 401(k) and 457 Plans was strong in 2016 increasing 7.09% in the 401k and increasing6.44% in the 457 plan.Plan contributions had another great year, increasing at 5.38% in the 401(k) plan and 1.23% in the 457 planThe Active Participation Rate in the 401k plan was up 14.12% and up 2.85% in the 457 plan in 2016.Headwinds continued in regard to Plan distributions, but at a much slower pace as prior years. Plan distributionswere up 8.91% in the 457 plan (versus 9.56% in 2015) and 2.51% in the 401(k) plan (versus 19.40% in 2015)As expected, the benefit of the majority of members receiving salary increases, continues to have a downwardimpact in the calculation of Retirement Readiness scores. This variable is the most important factor in determining amember’s score as it establishes a higher replacement ratio.The monthly pension estimate used in this calculation is not a one-for-one equivalence in the salary provided todetermine the Retirement Readiness score. Salary data provided by the State is used in the Annual BenefitStatement calculation to determine the 80% income replacement ratio, while the monthly pension benefit providedby the State is an average of members last four years of salary.Please view pages 7-10 in the Retirement Readiness summary section for a deeper view of this year’s analysis.Please see page 4 for important notes and disclaimers.For Institutional Plan Sponsor or Consultant Use Only6
North Carolina Annual Benefit Statement Report2016 Overall Retirement Readiness Score: 58.04%20132014201520162015 to 2016Difference (% )Number of Member Records in the ABS file393,141388,730381,987384,9620.78%Number of Members with just a Pension Plan207,866224,528217,348219,0360.78%Number of Members with 401(k) and/or 457185,275164,202164,639165,9260.78%Percentage of Members with 401(k) and/or 45747.13%42.24%43.10%43.10%0.00%Retirement Readiness Score for Members with 401(k) and/or 45777.00%75.75%74.09%72.09%-2.70%Retirement Readiness Score for Members Only in the pension plans60.37%55.42%50.16%47.39%-5.52%Projected Retirement Readiness gap/surplus within /- 100 per month102,417106,384104,107102,852-1.21%Members that also have a 401(k) and/or 457 plan that have a projected retirementgap/surplus within /- 100 per month31,49929,25830,19330,3410.49%Members within five years of projected retirement date102,00071,92772,10672,2130.15%Members within five years of projected retirement date (% of active membership)26.00%18.50%18.88%18.76%-0.63%Members within five years of projected retirement date (Retirement Readiness Score)55.00%52.85%54.29%51.33%-5.45%Item 44,346 new members not in last year’s report (65.94% Retirement Readiness score in 2016)41,371 members in last year’s report, not in this year’s report (63.01% Retirement Readiness score in 2015)Please see page 4 for important notes and disclaimers.For Institutional Plan Sponsor or Consultant Use Only7
North Carolina Annual Benefit Statement ReportRetirement Readiness Goals Comparison20132014201520162015 to 2016Difference (% )401(k) Plan: Increase GoalMaker utilization among new members89.80%92.29%92.36%88.30%-4.40%401(k) Plan: Increase GoalMaker utilization among all members53.00%55.50%58.38%60.83%4.20%401(k) Plan: Increase the average monthly contribution 156.69 160.91 158.95 162.572.28%401(k) Plan: Increase active participation27.83%27.19%26.06%29.74%14.12%457 Plan: Increase GoalMaker utilization among new members90.40%90.53%93.63%87.06%-7.02%457 Plan: Increase GoalMaker utilization among all members52.00%56.77%60.98%64.10%5.12%457 Plan: Increase the average monthly contribution 135.37 130.72 135.71 136.370.49%457 Plan: Increase active 201520162015 to 2016Difference (% )401(k) Plan Asset Growth17.85%5.89%-0.17%7.09%4270.59%457 Plan Asset Growth17.57%5.42%0.11%6.44%5754.55% 1,108,551,804 435,626,831( 13,154,210) 565,292,1124397.42%457 Plan Earnings 151,108,997 58,928,823 1,288,003 74,327,4135670.75%401(k) Plan Contributions 473,137,027 466,878,369 488,571,537 514,833,4545.38% 66,768,645 71,432,418 77,518,765 78,472,2251.23% 344,562,427 383,451,281 420,108,513 430,672,4002.51% 53,182,701 60,099,652 71,761,033 78,151,6918.91%Item401(k) and 457 MetricsItem401(k) Plan Earnings457 Plan Contributions401(k) Plan Distributions457 Plan DistributionsPlease see page 4 for important notes and disclaimers.For Institutional Plan Sponsor or Consultant Use Only8
North Carolina Annual Benefit Statement Report401(k) and 457 Participation Comparison20132014201520162015 to 2016Difference (% )401(k) Members with an Account Balance243,010247,850257,542245,550-4.66%401(k) Average Account Balance 30,112 31,618 30,643 34,78413.51%401(k) Median Account Balance 10,378 10,343 8,885 11,48829.30%401(k) Members Actively Contributing56.93%58.46%56.90%50.59%-1.56%401(k) Members (k) Members Not Contributing23.58%20.46%20.71%29.80%0.25%457 Members with an Account Balance48,38451,89255,56552,593-5.35%457 Average Account Balance 22,247 22,097 20,763 23,35612.49%457 Median Account Balance 2,388 2,224 2,015 2,91644.71%457 Members Actively Contributing53.88%58.76%57.73%63.56%-1.03%457 Members Terminated/Retired21.02%21.86%23.35%19.57%1.49%457 Members Not orical:2011 actual results were 55.60%2012 goal was 58%, 2012 actual results were 59.92%2013 goal was 60%, 2013 actual results were 67.56%2014 goal was 70%, 2014 actual results were 64.01%2015 goal was 65%, 2015 actual results were 60.48%Please see page 4 for important notes and disclaimers.For Institutional Plan Sponsor or Consultant Use Only9
North Carolina Annual Benefit Statement ReportMember Examples2016DifferenceIn 401(k)/Monthly in Monthly457 PlansProjected Projected(as of e2016AnnualSalaryDifference inAnnualSalaryMARY72 34,485 2,300- 462 1,83863.96% 37,636 3,151 1,849 11No58.95%-5.00%SANDRA70 34,205 2,300- 372 1,92867.64% 37,347 3,142 2,036 108Yes65.42%-2.22%KRISTI46 52,852 3,300 92 3,47578.90% 55,959 3,107 3,278- 197No77.97%-0.93%ANITA47 48,284 3,400- 122 3,18479.13% 50,450 2,166 3,664 480Yes78.57%-0.56%DONALD35 43,977 2,900 79 2,97981.29% 50,339 6,362 3,177 198No75.73%-5.55%MATTHEW33 50,789 3,400 899 4,299101.57% 50,709- 80 4,385 86Yes103.77%2.20%Name2016Difference e see page 4 for important notes and disclaimers.For Institutional Plan Sponsor or Consultant Use Only10
Section II:Gap & Surplus By Projected Retirement Age11For Institutional Plan Sponsor or Consultant Use Only
North Carolina Annual Benefit Statement ReportGap & Surplus By Projected Retirement AgeProjectedRetirementAge or 5051 - 61 61#3,251234,542147,169# Gap53091,04969,960% Gap16.30%38.82%47.54%# No Gap(Excess)2,721143,49377,209#%#%% No GapReplacement Replacement Replacement Replacement(Excess) 60% 60% 60% 97.98%52.46%7,5435.13%139,62694.87%Please see page 4 for important notes and disclaimers.For Institutional Plan Sponsor or Consultant Use Only12
Section III:Gap & Surplus By Projected Retirement Age & Region13For Institutional Plan Sponsor or Consultant Use Only
North Carolina Annual Benefit Statement ReportGap & Surplus By Projected Retirement Age & RegionCAPITAL REGIONProjectedRetirementAge or 5051 - 61 61## Gap19514,5649,219266,1434,337% Gap13.33%42.18%47.04%# No Gap(Excess)1698,4214,882%#%#Replacement Replacement Replacement Replacement% No Gap 60% 60% 60% 3697.06%52.96%5345.79%8,68594.21%% Gap24.35%37.12%51.97%# No Gap(Excess)64035,51318,026#%#%% No GapReplacement Replacement Replacement Replacement(Excess) 60% 60% 60% 48.03%2,0845.55%35,44394.45%% Gap27.10%54.01%64.12%# No Gap(Excess)1136,5663,604%#%#Replacement Replacement Replacement Replacement% No Gap 60% 60% 60% 1597.46%35.88%1,09610.91%8,94989.09%CAPITAL-METRO REGIONProjectedRetirementAge or 5051 - 61 61## Gap84656,47537,52720620,96219,501CAPITAL-WEST REGIONProjectedRetirementAge or 5051 - 61 61## Gap15514,27810,045427,7126,441Please see page 4 for important notes and disclaimers.For Institutional Plan Sponsor or Consultant Use Only14
North Carolina Annual Benefit Statement ReportGap & Surplus By Projected Retirement Age & RegionCENTRAL REGIONProjectedRetirementAge or 5051 - 61 61## Gap19114,2078,236145,6153,504# No Gap(Excess)1778,5924,732%#%#Replacement Replacement Replacement Replacement% No Gap 60% 60% 60% 4897.47%57.46%3464.20%7,89095.80%% Gap9.19%36.61%43.60%# No Gap(Excess)1689,6475,165#%#%% No GapReplacement Replacement Replacement Replacement(Excess) 60% 60% 60% 56.40%4925.37%8,66594.63%% Gap7.79%34.48%40.00%# No Gap(Excess)2139,0515,148%#%#Replacement Replacement Replacement Replacement% No Gap 60% 60% 60% 9597.69%60.00%3143.66%8,26696.34%% Gap7.33%39.52%42.54%MID-ATLANTIC REGIONProjectedRetirementAge or 5051 - 61 61## Gap18515,2189,157175,5713,992NORTH ATLANTIC REGIONProjectedRetirementAge or 5051 - 61 61## Gap23113,8148,580184,7633,432Please see page 4 for important notes and disclaimers.For Institutional Plan Sponsor or Consultant Use Only15
North Carolina Annual Benefit Statement ReportGap & Surplus By Projected Retirement Age & RegionNORTH CENTRAL REGIONProjectedRetirementAge or 5051 - 61 61## Gap25216,86110,010486,1884,385# No Gap(Excess)20410,6735,625%#%#Replacement Replacement Replacement Replacement% No Gap 60% 60% 60% 1098.51%56.19%4264.26%9,58495.74%% Gap14.09%38.16%44.69%# No Gap(Excess)18910,4145,801#%#%% No GapReplacement Replacement Replacement Replacement(Excess) 60% 60% 60% %55.31%4173.98%10,07296.02%% Gap16.13%40.19%45.08%# No Gap(Excess)15611,0076,567%#%#Replacement Replacement Replacement Replacement% No Gap 60% 60% 60% 9196.68%54.92%5804.85%11,37895.15%% Gap19.05%36.70%43.81%NORTHWEST REGIONProjectedRetirementAge or 5051 - 61 61## Gap22016,84110,489316,4274,688SOUTH CENTRAL REGIONProjectedRetirementAge or 5051 - 61 61## Gap18618,40211,958307,3955,391Please see page 4 for important notes and disclaimers.For Institutional Plan Sponsor or Consultant Use Only16
North Carolina Annual Benefit Statement ReportGap & Surplus By Projected Retirement Age & RegionSOUTHWEST REGIONProjectedRetirementAge or 5051 - 61 61## Gap21912,1516,608214,3972,591# No Gap(Excess)1987,7544,017%#%#Replacement Replacement Replacement Replacement% No Gap 60% 60% 60% 6198.44%60.79%1772.68%6,43197.32%% Gap12.85%38.61%47.57%# No Gap(Excess)33918,0419,081#%#%% No GapReplacement Replacement Replacement Replacement(Excess) 60% 60% 60% 52.43%7374.26%16,58295.74%% Gap14.84%36.69%43.14%# No Gap(Excess)1557,8144,561%#%#Replacement Replacement Replacement Replacement% No Gap 60% 60% 60% 0998.10%56.86%3404.24%7,68195.76%% Gap9.59%36.19%39.21%SOUTHWEST-METRO REGIONProjectedRetirementAge or 5051 - 61 61## Gap38929,38817,3195011,3478,238WESTERN REGIONProjectedRetirementAge or 5051 - 61 61## Gap18212,3438,021274,5293,460Please see page 4 for important notes and disclaimers.For Institutional Plan Sponsor or Consultant Use Only17
This page intentionally left blank.
Section IV:Gap & Surplus By Current Age19For Institutional Plan Sponsor or Consultant Use Only
North Carolina Annual Benefit Statement ReportGap & Surplus By Current AgeCurrent AgeLess than 25Age 25-34Age 35-44Age 45-54Age 55-64Age 65 Count3,84068,63794,927118,17884,99214,388Count Gap35419,62842,28356,00245,4237,341Percent ment lacement Replacement Replacement 12,76788.73%Count No Gap3,48649,00952,64462,17639,5697,047Please see page 4 for important notes and disclaimers.For Institutional Plan Sponsor or Consultant Use OnlyPercent No Gap90.78%71.40%55.46%52.61%46.56%48.98%20
Section V:Gap & Surplus By Current Age & Region21For Institutional Plan Sponsor or Consultant Use Only
North Carolina Annual Benefit Statement ReportGap & Surplus By Current Age & RegionCAPITAL REGIONCurrent AgeLess than 25Age 25-34Age 35-44Age 45-54Age 55-64Age 65 Count2724,3915,9127,2705,0721,061Count Gap261,4652,6943,4982,804509Percent ment 60%388152195412115PercentCountPercentReplacement Replacement Replacement 6%Count No Gap2462,9263,2183,7722,268552Percent No Gap90.44%66.64%54.43%51.88%44.72%52.03%Percent ement nt Replacement Replacement 7787.34%Count No Gap72811,45612,70715,5869,5541,685Percent No Gap88.89%73.61%56.55%52.15%42.73%44.91%Percent ement 60%259164339712186PercentCountPercentReplacement Replacement Replacement 74%Count No Gap1742,5252,3732,5851,777342Percent No RO REGIONCurrent AgeLess than 25Age 25-34Age 35-44Age 45-54Age 55-64Age 65 Count81915,56422,47029,88422,3593,752Count Gap914,1089,76314,29812,8052,067CAPITAL-WEST REGIONCurrent AgeLess than 25Age 25-34Age 35-44Age 45-54Age 55-64Age 65 Count1994,5306,1787,2425,411918Count Gap252,0053,8054,6573,634576Please see page 4 for important notes and disclaimers.For Institutional Plan Sponsor or Consultant Use Only22
North Carolina Annual Benefit Statement ReportGap & Surplus By Current Age & RegionCENTRAL REGIONCurrent AgeLess than 25Age 25-34Age 35-44Age 45-54Age 55-64Age 65 Count2704,1435,6037,0554,778785Count Gap201,2782,5013,1582,366360Percent ment 60%88411116426575PercentCountPercentReplacement Replacement Replacement %Count No Gap2502,8653,1023,8972,412425Percent No Gap92.59%69.15%55.36%55.24%50.48%54.14%Percent ment 60%2107170258381132PercentCountPercentReplacement Replacement Replacement 0%Count No Gap2243,4383,5353,9262,811439Percent No Gap91.80%74.08%58.58%54.13%51.15%49.22%Percent ment 60%5648013228767PercentCountPercentReplacement Replacement Replacement %Count No Gap2632,7893,2604,0463,056492Percent No C REGIONCurrent AgeLess than 25Age 25-34Age 35-44Age 45-54Age 55-64Age 65 Count2444,6416,0347,2535,496892Count Gap201,2032,4993,3272,685453NORTH ATLANTIC REGIONCurrent AgeLess than 25Age 25-34Age 35-44Age 45-54Age 55-64Age 65 Count2873,6595,2986,9925,516873Count Gap248702,0382,9462,460381Please see page 4 for important notes and disclaimers.For Institutional Plan Sponsor or Consultant Use Only23
North Carolina Annual Benefit Statement ReportGap & Surplus By Current Age & RegionNORTH CENTRAL REGIONCurrent AgeLess than 25Age 25-34Age 35-44Age 45-54Age 55-64Age 65 Count2914,9256,6778,2215,8961,113Count Gap311,3362,8993,7402,848494Percent ement 60%66776108306116PercentCountPercentReplacement Replacement Replacement 8%Count No Gap2603,5893,7784,4813,048619Percent No Gap89.35%72.87%56.58%54.51%51.70%55.62%Percent ment 60%610316323129882PercentCountPercentReplacement Replacement Replacement %Count No Gap2353,4683,8634,5962,996504Percent No Gap90.73%72.61%56.28%53.52%49.13%52.17%Percent ment 60%4101186311486105PercentCountPercentReplacement Replacement Replacement 34%Count No Gap2213,7374,1634,8603,377620Percent No Gap90.95%70.99%55.66%52.25%47.93%51.16%NORTHWEST REGIONCurrent AgeLess than 25Age 25-34Age 35-44Age 45-54Age 55-64Age 65 Count2594,7766,8648,5876,098966Count Gap241,3083,0013,9913,102462SOUTH CENTRAL REGIONCurrent AgeLess than 25Age 25-34Age 35-44Age 45-54Age 55-64Age 65 Count2435,2647,4809,3017,0461,212Count Gap221,5273,3174,4413,669592Please see page 4 for important notes and disclaimers.For Institutional Plan Sponsor or Consultant Use Only24
North Carolina Annual Benefit Statement ReportGap & Surplus By Current Age & RegionSOUTHWEST REGIONCurrent AgeLess than 25Age 25-34Age 35-44Age 45-54Age 55-64Age 65 Count2493,3924,7496,1123,871605Count Gap218971,9582,6481,769261Percent ment 60%1040489214039PercentCountPercentReplacement Replacement Replacement %Count No Gap2282,4952,7913,4642,102344Percent No Gap91.57%73.56%58.77%56.68%54.30%56.86%Percent ment 60%277128223551164PercentCountPercentReplacement Replacement Replacement 88.88%Count No Gap4577,0606,7217,4463,958638Percent No Gap94.03%71.72%54.51%52.82%44.65%43.25%Percent ment 60%4436711228565PercentCountPercentReplacement Replacement Replacement %Count No Gap2002,6613,1333,5172,210387Percent No ETRO REGIONCurrent AgeLess than 25Age 25-34Age 35-44Age 45-54Age 55-64Age 65 Count4869,84412,32914,0988,8641,475Count Gap292,7845,6086,6524,906837WESTERN REGIONCurrent AgeLess than 25Age 25-34Age 35-44Age 45-54Age 55-64Age 65 Count2213,5085,3336,1634,585736Count Gap218472,2002,6462,375349Please see page 4 for important notes and disclaimers.For Institutional Plan Sponsor or Consultant Use Only25
This page intentionally left blank.
Section VI:Percent of Retirement Replacement Income27For Institutional Plan Sponsor or Consultant Use Only
North Carolina Annual Benefit Statement ReportProjected Retirement by Replacement IncomeReplacement IncomeNumberPercent 39%6890.18% 29%1120.03%* Total number and overall percentage of members whose retirement replacement income is greater than or equal to 80%.** Total number and overall percentage of members whose retirement replacement income is greater than or equal to 60%.Retirement readiness for 2016 is 58.04%. By comparison the Retirement readiness for 2015 was 60.48, for 2014 was 64.01%, for 2013was 67.56%, for 2012 was 59.92%, and for 2011 was 55.60%.Please see page 4 for important notes and disclaimers.For Institutional Plan Sponsor or Consultant Use Only28
Section VII:Percent of Retirement Replacement Income By Region29For Institutional Plan Sponsor or Consultant Use Only
North Carolina Annual Benefit Statement ReportProjected Retirement by Replacement Income by RegionCAPITAL REGIONReplacement IncomeNumberPercent 96.17%50-59%6702.79%40-49%1950.81%30-39%490.20% 29%50.02% 17% 29%340.04% 94.46%50-59%9964.07%40-49%2631.07%30-39%770.31% 29%190.08%CAPITAL-METRO REGIONReplacement IncomeNumberPercentCAPITAL-WEST REGIONReplacement IncomeNumberPercentPlease see page 4 for important notes and disclaimers.For Institutional Plan Sponsor or Consultant Use Only30
North Carolina Annual Benefit Statement ReportProjected Retirement by Replacement Income by RegionCENTRAL REGIONReplacement IncomeNumberPercent 97.06%50-59%4441.96%40-49%1730.76%30-39%430.19% 29%60.03% 95.93%50-59%6532.66%40-49%2491.01%30-39%790.32% 29%190.08% 97.34%50-59%4341.92%40-49%1390.61%30-39%260.11% 29%20.01%MID-ATLANTIC REGIONReplacement IncomeNumberPercentNORTH ATLANTIC REGIONReplacement IncomeNumberPercentPlease see page 4 for important notes and disclaimers.For Institutional Plan Sponsor or Consultant Use Only31
North Carolina Annual Benefit Statement ReportProjected Retirement by Replacement Income by RegionNORTH CENTRAL REGIONReplacement IncomeNumberPercent 997.66%50-59%4681.73%40-49%1210.45%30-39%410.15% 29%40.01% 796.94%50-59%5371.95%40-49%2560.93%30-39%450.16% 29%50.02% 996.28%50-59%7702.52%40-49%3111.02%30-39%500.16% 29%60.02%NORTHWEST REGIONReplacement IncomeNumberPercentSOUTH CENTRAL REGIONReplacement IncomeNumberPercentPlease see page 4 for important notes and disclaimers.For Institutional Plan Sponsor or Consultant Use Only32
North Carolina Annual Benefit Statement ReportProjected Retirement by Replacement Income by RegionSOUTHWEST REGIONReplacement IncomeNumberPercent 98.17%50-59%2461.30%40-49%840.44%30-39%130.07% 29%50.03% 1797.71%50-59%7811.66%40-49%2250.48%30-39%690.15% 29%40.01% 97.32%50-59%3811.85%40-49%1340.65%30-39%330.16% 29%30.01%SOUTHWEST-METRO REGIONReplacement IncomeNumberPercentWESTERN REGIONReplacement IncomeNumberPercentPlease see page 4 for important notes and disclaimers.For Institutional Plan Sponsor or Consultant Use Only33
This page intentionally left blank.
Section VIII:Average Monthly Contribution By ReplacementIncome & Age35For Institutional Plan Sponsor or Consultant Use Only
North Carolina Annual Benefit Statement ReportAverage Monthly Contribution By Replacement Income & AgeAverage Monthly Contribution Rate DollarsReplacementIncomeLess than 25Age 25-34Age 35-44Age 45-54Age 55-64Age 65 100% 144.39 211.08 350.18 480.91 524.47 538.8490-100% 79.35 127.87 197.07 259.99 371.21 338.9480-89% 51.38 97.29 152.40 212.78 285.61 354.2970-79 33.80 99.20 147.18 216.28 301.33 399.2060-69% 170.23 114.76 163.41 229.84 295.16 319.3250-59% 84.14 79.07 124.30 214.59 399.61 677.2340-49% 53.51 80.24 125.88 212.83 567.57 656.1630-39% 0.00 44.66 87.13 402.88 913.10 918.80 -39%0.00%1.33%2.50%6.54%9.21%8.00% 30%0.00%0.00%2.00%0.00%8.50%9.50% 0.00 0.00 1.07 0.00 1,716.72 2,073.81Average Monthly Contribution Rate PercentReplacementIncomeLess than 25Age 25-34Age 35-44Age 45-54Age 55-64Age 65 .84%8.98%Please see page 4 for important notes and disclaimers.For Institutional Plan Sponsor or Consultant Use Only36
Section IX:Percent of New Members With Participation in SupplementalRetirement Plan37For Institutional Plan Sponsor or Consultant Use Only
North Carolina Annual Benefit Statement ReportPercent of New Members With Participation in Supplemental Retirement PlanSRP ParticipationLess than 25Age 25-34Age 35-44Age 45-54Age 55-64Total# of New Members13,5482,8221331122,80719,422# with Participation in SRP4,648963119891,0276,846% with Par
Total asset growth in the 401(k) and 457 Plans was strong in 2016 increasing 7.09% in the 401k and increasing 6.44% in the 457 plan. Plan contributions had another great year, increasing at 5.38% in the 401(k) plan and 1.23% in the 457 plan The Active Participation Rate in the 401k plan was up 14.12% and up 2.85% in the 457 plan in .
