Transcription
U.S. PUBLIC FINANCECREDIT OPINION14 July 2021Austin Independent School District, TXUpdate to credit analysisSummaryContactsHeather Correia 1.214.979.6868Analystheather.correia@moodys.comThe credit profile of Austin Independent School District (ISD), TX (Aaa stable) is currentlystable, and is supported by a large and vibrant local economy and manageable leverage andfixed cost ratios. Wealth indices are strong, and full value per capita is high. The rating alsoreflects a history of declining enrollment trends. While the financial position is adequate, ifbelow Aaa medians, management is forecasting large deficits in fiscal 2021 and fiscal 2022,which, if realized in full, could present future credit challenges.Genevieve Nolan 1.212.553.3912VP-Senior Analystgenevieve.nolan@moodys.comOn July 13, 2021, Moody's affirmed the issuer and underlying ratings at Aaa stable.CLIENT SERVICES» Large, regionally important economy with significant institutional presenceAmericas1-212-553-1653Asia 772-5454Credit strengths» Currently healthy financial reserve position» Manageable leverage and fixed costsCredit challenges» Ongoing trend of declining student enrollment» Large wealth recapture payments will continue to pressure operationsRating outlookThe stable outlook is based on the strength of the tax base coupled with the sophisticatedand forward-looking management team will lead to a continuation of healthy financialoperations and reserve levels.Factors that could lead to an upgrade» Not applicableFactors that could lead to a downgrade» Poor financial performance leading to a weakening of reserve levels» Prolonged trend of declining enrollment without corresponding expenditure management» Significant increase in long-term liabilities ratios
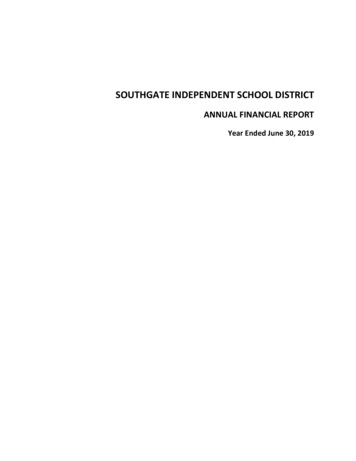
U.S. PUBLIC FINANCEMOODY'S INVESTORS SERVICEKey indicatorsExhibit 1Austin Independent School District, TXEconomyResident incomeFull value ( 000)PopulationFull value per capitaEnrollmentEnrollment trendFinancial performanceOperating revenue ( 000)Available fund balance ( 000)Net cash ( 000)Available fund balance ratioNet cash ratioLeverageDebt ( 000)ANPL ( 000)OPEB ( 000)Long-term liabilities ratioImplied debt service ( 000)Pension tread water ( 000)OPEB contributions ( 000)Fixed-costs ratio2017201820192020Aaa Medians109.8% 93,072,527714,067 130,34183,067N/A110.8% 103,221,368727,999 141,78881,650-1.2%112.2% 115,070,942737,660 155,99580,032-1.5%N/A 126,314,798N/AN/A80,911-0.9%183.2% 13,609,74145,569 214,7264,7620.2% 1,303,349 444,287 540,26934.1%41.5% 1,421,158 419,258 546,60429.5%38.5% 1,578,540 426,369 613,57027.0%38.9% 1,572,968 406,525 1,098,57825.8%69.8% 124,842 37,202 47,06528.7%38.6% 1,048,526 406,703N/AN/A 68,647 11,229N/AN/A 982,621 389,143 276,318116.0% 77,883 10,322 3,9936.5% 1,213,504 339,018 301,976117.5% 72,402 13,829 4,8345.8% 1,128,629 459,755 281,176118.9% 88,476 12,902 4,5446.7% 49,826 163,604 23,033227.6% 3,912 4,849 92310.8%For definitions of the metrics in the table above please refer to the US K-12 Public School Districts Methodology or see the Glossary in the Appendix below. Metrics represented as N/Aindicate the data were not available at the time of publication. The medians come from our most recently published K12 Median Report.Sources: US Census Bureau, Austin Independent School District, TX’s financial statements and Moody’s Investors ServiceProfileAustin Independent School District is a political subdivision located in central Texas (Aaa stable) wholly within Travis County (Aaastable). The district provides K-12 educational services to the City of Austin (Aa1 stable) area and enrolls roughly 80,000 students.Detailed credit considerationsEconomy: large, regionally important economy continues to growThe district’s economic profile is expected to remain strong over the next several years due to ongoing residential and commercialinvestment. Serving the city of Austin, the district’s economy is diverse and vibrant. Wealth indices are above average with a medianhome income of around 113% of the US and a full value per capita of 183,000. Multiple public reports point to the city and countybeing a top real estate market for commercial and residential homes, and is frequently listed as one of the best places to live. Thereal estate growth trend shows no signs of slowing, with the Austin Board of Realtors reporting a 12.4% year-over-year increasein residential sales across the county in March, with the median price increasing by 24.1% year-over-year. The top taxpayers andemployers are not only diverse, but also benefits from strong institutional presence as the city is home to the state capital and theUniversity of Texas System (Aaa stable), both of which account for a significant amount of employment base in the area.Austin's local economy is robust, and benefits from presence of tech giants such as Samsung Electronics Co., Ltd. (Aa3 stable) andApple Inc. (Aa1 stable). Tesla (Ba3 positive) entered into an agreement with Travis County last summer to build a 1.1 billion electricvehicle manufacturing facility, which will reportedly employ 10,000 people. During the last year Oracle Corp. (Baa2 stable) announcedit will be moving its headquarters to Austin, and Wayfair will open a new engineering office in the county. These announcements comeas Apple is nearing completion of its new campus 1 billion investment with an additional 5,000 jobs that will eventually expand toThis publication does not announce a credit rating action. For any credit ratings referenced in this publication, please see the ratings tab on the issuer/entity page onwww.moodys.com for the most updated credit rating action information and rating history.214 July 2021Austin Independent School District, TX: Update to credit analysis
MOODY'S INVESTORS SERVICEU.S. PUBLIC FINANCEroughly 15,000 jobs. Although the facility expansion is located just outside of the county's boundaries, the entire Austin metro area willgain high-wage employment, capital investment and associated economic multiplier effects.The district’s enrollment has been downward trending for the past several years, from a high of around 86,000 in fiscal 2013 to 80,000in fiscal 2020. Officials report that fiscal 2021 enrollment is 80,911, with students returning to school after the pandemic. Managementexplains that enrollment loss is an indication of significant increases in housing prices, which in turn makes affordability of the area forfamilies with school age children a growing challenge. Management plans to conservatively budget for a modest annual enrollmentdecline over the next decade.Financial operations: currently adequate financial operations despite large wealth recapture paymentThe district's financial position has weakened in recent years, and stands to decline further in fiscal 2021 and fiscal 2022 withoutcorresponding expenditure management.At fiscal 2020 year-end, general fund balance was 268.5 million, or an adequate 19% of revenues. State revenues fell by nearly 20million, with federal funds down another 16 million; property taxes were up by 20 million, but below budgeted expectations by 13M because of lower collections than expected. Operating fund balance, including the general fund and debt service fund, is 406.8million, or 26% of operating revenues.The fiscal 2021 budget assumed a 65.9 million deficit and reflects an increase in instructional spending, a large recapture payment ofover 600 million, and another 4 million to support Food Services. Based on performance through April, the district is running a 40million deficit.The fiscal 2022 recommended budget includes a 39.2 million deficit for the general fund, and an estimated expenditure of 709million in recapture that will be paid to the state, based on a projected 7.9% increase in property tax values. Austin ISD is eligible for 155 million in federal funding (CARES and ESSER). Management explains that they will use these monies to reimburse themselves foraround 50 million in COVID-associated costs incurred in fiscal 2020 and fiscal 2021.LiquidityCash and fund balance are different due to liabilities and receivables. At fiscal 2020 year-end (June 30), the district reported 1.1 billionin operating fund cash, or a healthy 70% of revenues.Leverage: manageable leverage and fixed costsDespite ongoing issuances, the district’s leverage and fixed cost metrics remain manageable. In fiscal 2020, leverage was 129% ofoperating revenues, slightly above Aaa medians. The long-term liabilities ratio is split between debt and pensions/OPEB. Positively, thedistrict has no plans to issue additional bonds in the next 12 months. In contrast to the leverage metric, fixed costs, including annualdebt service, pension contributions and OPEB, are a low 8%.Legal securityThe GOULT bonds are secured by a direct and continuing ad valorem tax levied by the district on all taxable property withoutlimitation as to rate or amount. All of the district’s bonds are further secured by the Texas Permanent School Fund's commitment topay debt service if necessary.Debt structureThe district has 1.5 billion in general obligation unlimited tax (GOULT) bonds. Ten year principal payout is average at 55% with finalmaturity in 2041. No commercial paper is currently outstanding.Debt-related derivativesThe district is not a party to any debt-related derivatives.Pensions and OPEBThe district participates in the Texas Teachers Retirement System (TRS) pension plan. The State of Texas (Aaa stable) annually makesthe majority of the employer pension contributions on behalf of districts statewide. Given this continued support, budgetary pressureassociated with the plan will remain minimal.314 July 2021Austin Independent School District, TX: Update to credit analysis
MOODY'S INVESTORS SERVICEU.S. PUBLIC FINANCEFor fiscal 2020, the district reported a GASB net pension liability of 118.5 million, based on a 7.25% GASB blended discount rate.Comparatively, the Moody's adjusted net pension liability (ANPL) based on a 3% discount rate on December 31, 2019 (FTSE pensionliability index), was 460 million, or a modest 0.51 times annual operating revenues in fiscal 2020. The district made 1.5 million inpension contributions, net of contributions from the state. This contribution was notably below the Moody's calculated “tread water”level of 12.9 million. Like all US public pension systems, TRS’s annual contribution weakness could be compounded by poor assetreturns in any given year.ESG considerationsEnvironmentalThe local government sector generally has low exposure to environmental risks, and the same holds true for Travis County, whereAustin ISD is located. According to data from Moody's affiliate Four Twenty Seven, Travis County is at high risk for projected rate offuture changes associated with water stress, with moderate risk for rising heat stress and extreme rainfall events. Favorably, the state ofTexas has taken action to help mitigate water stress risk within its borders by issuing general obligation debt through the Texas WaterDevelopment Board (TWDB) since the 1950s to finance a variety of water conservation and supply projects.SocialSocial considerations were considered, but are not a material rating driver. The American Community Survey data indicates aboveaverage wealth indices with a median home income of 112.2%. It is likely that indices are artificially low due to the very large studentpopulation of UT-Austin. The May 2021 unemployment rate for Travis County of 4.2% is below the state (5.9%) and the nation(5.5%) for the same time frame, reflecting the continued economic growth in the area but also the relatively pandemic-resistant topemployers.GovernanceThe district's board consists of nine members and supervises and controls all public schools and property within the district. The boardemploys a Superintendent of Schools, delegates administrative and supervisory functions to the superintendent, reviews and approvesthe district's budget. District management is fiscally conservative as demonstrated by the district's favorable operating history, amplereserves, and long term capital and expenditure planning.Texas school districts have an Institutional Framework score 1 of Aa. The state controls school district revenue through an equalizedfunding formula consisting of a combination of local property taxes and state aid. The state allows for regular and predictable increasesto total funding for school districts. Property tax revenue growth is capped at 2.5% annually, but school districts can approach votersfor mill levy overrides that can generate meaningful additional locally determined operating revenue.414 July 2021Austin Independent School District, TX: Update to credit analysis
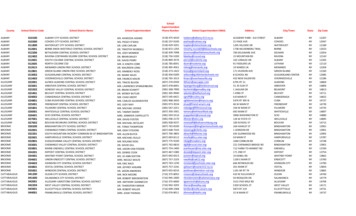
U.S. PUBLIC FINANCEMOODY'S INVESTORS SERVICERating methodology and scorecard factorsThe US K-12 Public School Districts Methodology includes a scorecard, a tool providing a composite score of a school district’s creditprofile based on the weighted factors we consider most important, universal and measurable, as well as possible notching factorsdependent on individual credit strengths and weaknesses. Its purpose is not to determine the final rating, but rather to provide astandard platform from which to analyze and compare school district credits.Exhibit 2Austin Independent School District, TXEconomyResident Income (MHI Adjusted for RPP / US MHI)Full value per capita (full valuation of the tax base / population)Enrollment trend (three-year CAGR in enrollment)Financial performanceAvailable fund balance ratio (available fund balance / operating revenue)Net cash ratio (net cash / operating revenue)Institutional frameworkInstitutional FrameworkLeverageLong-term liabilities ratio ((debt ANPL adjusted net OPEB) / operating revenue)Fixed-costs ratio (adjusted fixed costs / operating revenue)Notching factorsNo notchings appliedScorecard-Indicated OutcomeAssigned 128.9%6.7%20.0%10.0%AaAaaAa1AaaSources: US Census Bureau, Austin Independent School District, TX’s financial statements and Moody’s Investors Service514 July 2021Austin Independent School District, TX: Update to credit analysis
U.S. PUBLIC FINANCEMOODY'S INVESTORS SERVICEAppendixExhibit 3Key Indicators GlossaryDefinitionEconomyResident incomeFull value ( 000)PopulationFull value per capitaEnrollmentEnrollment trendFinancial performanceOperating revenue ( 000)Available fund balance ( 000)Net cash ( 000)Available fund balance ratioNet cash ratioLeverageDebt ( 000)ANPL ( 000)OPEB ( 000)Long-term liabilities ratioImplied debt service ( 000)Pension tread water ( 000)OPEB contributions ( 000s)Fixed-costs ratioTypical Source*Median Household Income (MHI), adjusted for Regional Price Parity MHI: American Community Survey (US(RPP), as a % of the USCensus Bureau)RPP: US Bureau of Economic AnalysisEstimated market value of taxable property accessible to the district State repositories, district’s auditedfinancial reports, offering documents orcontinuing disclosurePopulation of school districtAmerican Community Survey (US CensusBureau)Full value / population of school districtStudent enrollment of school districtState data publications3-year Compound Annual Growth Rate (CAGR) of EnrollmentState data publications; Moody's InvestorsServiceTotal annual operating revenue in what we consider to be thedistrict's operating fundsCommitted, assigned and unassigned fund balances in what weconsider to be the district's operating fundsNet cash (cash and liquid investments minus short-term debt) inwhat we consider to be the district's operating fundsAvailable fund balance / Operating RevenueNet Cash / Operating RevenueAudited financial statementsAudited financial statementsAudited financial statementsAudited financial statementsAudited financial statementsDistrict's direct gross debt outstandingAudited financial statements; officialstatementsDistrict's pension liabilities adjusted by Moody's to standardize the Audited financial statements; Moody'sdiscount rate used to compute the present value of accrued benefits Investors ServiceDistrict's net other post-employment benefit (OPEB) liabilitiesAudited financial statements; Moody'sadjusted by Moody's to standardize the discount rate used toInvestors Servicecompute the present value of accrued benefitsDebt, ANPL and OPEB liabilities as % of operating revenueAudited financial statements, officialstatements; Moody's Investors ServiceAnnual cost to amortize district's long-term debt over 20 years with Audited financial statements; officiallevel paymentsstatements; Moody's Investors ServicePension contribution necessary to prevent reported unfundedAudited financial statements; Moody'spension liabilities from growing, year over year, in nominal dollars, if Investors Serviceall actuarial assumptions are metDistrict’s actual contribution in a given period, typically the fiscal yearAudited financial statements; officialstatementsImplied debt service, pension tread water and OPEB contributions as Audited financial statements, official% of operating revenuestatements, pension system financialstatements*Note: If typical data source is not available then alternative sources or proxy data may be considered. For more detailed definitions of the metrics listed above please refer to the US K-12Public School Districts Methodology.Source: Moody's Investors ServiceEndnotes1 The institutional framework score categorically assesses whether a district has the legal ability to raise the bulk of its operating revenue at the local levelor if the state determines the bulk of its operating revenue. Beyond the local versus state categorization, the strength of the institutional framework scoreis a measure of the district’s flexibility in raising additional locally determined operating revenue. See US K-12 Public School Districts Methodology formore details.614 July 2021Austin Independent School District, TX: Update to credit analysis
MOODY'S INVESTORS SERVICEU.S. PUBLIC FINANCE 2021 Moody’s Corporation, Moody’s Investors Service, Inc., Moody’s Analytics, Inc. and/or their licensors and affiliates (collectively, “MOODY’S”). All rights reserved.CREDIT RATINGS ISSUED BY MOODY'S CREDIT RATINGS AFFILIATES ARE THEIR CURRENT OPINIONS OF THE RELATIVE FUTURE CREDIT RISK OF ENTITIES, CREDITCOMMITMENTS, OR DEBT OR DEBT-LIKE SECURITIES, AND MATERIALS, PRODUCTS, SERVICES AND INFORMATION PUBLISHED BY MOODY’S (COLLECTIVELY,“PUBLICATIONS”) MAY INCLUDE SUCH CURRENT OPINIONS. MOODY’S DEFINES CREDIT RISK AS THE RISK THAT AN ENTITY MAY NOT MEET ITS CONTRACTUALFINANCIAL OBLIGATIONS AS THEY COME DUE AND ANY ESTIMATED FINANCIAL LOSS IN THE EVENT OF DEFAULT OR IMPAIRMENT. SEE APPLICABLE MOODY’SRATING SYMBOLS AND DEFINITIONS PUBLICATION FOR INFORMATION ON THE TYPES OF CONTRACTUAL FINANCIAL OBLIGATIONS ADDRESSED BY MOODY’SCREDIT RATINGS. CREDIT RATINGS DO NOT ADDRESS ANY OTHER RISK, INCLUDING BUT NOT LIMITED TO: LIQUIDITY RISK, MARKET VALUE RISK, OR PRICEVOLATILITY. CREDIT RATINGS, NON-CREDIT ASSESSMENTS (“ASSESSMENTS”), AND OTHER OPINIONS INCLUDED IN MOODY’S PUBLICATIONS ARE NOTSTATEMENTS OF CURRENT OR HISTORICAL FACT. MOODY’S PUBLICATIONS MAY ALSO INCLUDE QUANTITATIVE MODEL-BASED ESTIMATES OF CREDIT RISK ANDRELATED OPINIONS OR COMMENTARY PUBLISHED BY MOODY’S ANALYTICS, INC. AND/OR ITS AFFILIATES. MOODY’S CREDIT RATINGS, ASSESSMENTS, OTHEROPINIONS AND PUBLICATIONS DO NOT CONSTITUTE OR PROVIDE INVESTMENT OR FINANCIAL ADVICE, AND MOODY’S CREDIT RATINGS, ASSESSMENTS, OTHEROPINIONS AND PUBLICATIONS ARE NOT AND DO NOT PROVIDE RECOMMENDATIONS TO PURCHASE, SELL, OR HOLD PARTICULAR SECURITIES. MOODY’S CREDITRATINGS, ASSESSMENTS, OTHER OPINIONS AND PUBLICATIONS DO NOT COMMENT ON THE SUITABILITY OF AN INVESTMENT FOR ANY PARTICULAR INVESTOR.MOODY’S ISSUES ITS CREDIT RATINGS, ASSESSMENTS AND OTHER OPINIONS AND PUBLISHES ITS PUBLICATIONS WITH THE EXPECTATION AND UNDERSTANDINGTHAT EACH INVESTOR WILL, WITH DUE CARE, MAKE ITS OWN STUDY AND EVALUATION OF EACH SECURITY THAT IS UNDER CONSIDERATION FOR PURCHASE,HOLDING, OR SALE.MOODY’S CREDIT RATINGS, ASSESSMENTS, OTHER OPINIONS, AND PUBLICATIONS ARE NOT INTENDED FOR USE BY RETAIL INVESTORS AND IT WOULD BE RECKLESSAND INAPPROPRIATE FOR RETAIL INVESTORS TO USE MOODY’S CREDIT RATINGS, ASSESSMENTS, OTHER OPINIONS OR PUBLICATIONS WHEN MAKING AN INVESTMENTDECISION. IF IN DOUBT YOU SHOULD CONTACT YOUR FINANCIAL OR OTHER PROFESSIONAL ADVISER.ALL INFORMATION CONTAINED HEREIN IS PROTECTED BY LAW, INCLUDING BUT NOT LIMITED TO, COPYRIGHT LAW, AND NONE OF SUCH INFORMATION MAY BE COPIEDOR OTHERWISE REPRODUCED, REPACKAGED, FURTHER TRANSMITTED, TRANSFERRED, DISSEMINATED, REDISTRIBUTED OR RESOLD, OR STORED FOR SUBSEQUENT USEFOR ANY SUCH PURPOSE, IN WHOLE OR IN PART, IN ANY FORM OR MANNER OR BY ANY MEANS WHATSOEVER, BY ANY PERSON WITHOUT MOODY’S PRIOR WRITTENCONSENT.MOODY’S CREDIT RATINGS, ASSESSMENTS, OTHER OPINIONS AND PUBLICATIONS ARE NOT INTENDED FOR USE BY ANY PERSON AS A BENCHMARK AS THAT TERM ISDEFINED FOR REGULATORY PURPOSES AND MUST NOT BE USED IN ANY WAY THAT COULD RESULT IN THEM BEING CONSIDERED A BENCHMARK.All information contained herein is obtained by MOODY’S from sources believed by it to be accurate and reliable. Because of the possibility of human or mechanical error as wellas other factors, however, all information contained herein is provided “AS IS” without warranty of any kind. MOODY'S adopts all necessary measures so that the information ituses in assigning a credit rating is of sufficient quality and from sources MOODY'S considers to be reliable including, when appropriate, independent third-party sources. However,MOODY’S is not an auditor and cannot in every instance independently verify or validate information received in the rating process or in preparing its Publications.To the extent permitted by law, MOODY’S and its directors, officers, employees, agents, representatives, licensors and suppliers disclaim liability to any person or entity for anyindirect, special, consequential, or incidental losses or damages whatsoever arising from or in connection with the information contained herein or the use of or inability to use anysuch information, even if MOODY’S or any of its directors, officers, employees, agents, representatives, licensors or suppliers is advised in advance of the possibility of such losses ordamages, including but not limited to: (a) any loss of present or prospective profits or (b) any loss or damage arising where the relevant financial instrument is not the subject of aparticular credit rating assigned by MOODY’S.To the extent permitted by law, MOODY’S and its directors, officers, employees, agents, representatives, licensors and suppliers disclaim liability for any direct or compensatorylosses or damages caused to any person or entity, including but not limited to by any negligence (but excluding fraud, willful misconduct or any other type of liability that, for theavoidance of doubt, by law cannot be excluded) on the part of, or any contingency within or beyond the control of, MOODY’S or any of its directors, officers, employees, agents,representatives, licensors or suppliers, arising from or in connection with the information contained herein or the use of or inability to use any such information.NO WARRANTY, EXPRESS OR IMPLIED, AS TO THE ACCURACY, TIMELINESS, COMPLETENESS, MERCHANTABILITY OR FITNESS FOR ANY PARTICULAR PURPOSE OF ANY CREDITRATING, ASSESSMENT, OTHER OPINION OR INFORMATION IS GIVEN OR MADE BY MOODY’S IN ANY FORM OR MANNER WHATSOEVER.Moody’s Investors Service, Inc., a wholly-owned credit rating agency subsidiary of Moody’s Corporation (“MCO”), hereby discloses that most issuers of debt securities (includingcorporate and municipal bonds, debentures, notes and commercial paper) and preferred stock rated by Moody’s Investors Service, Inc. have, prior to assignment of any credit rating,agreed to pay to Moody’s Investors Service, Inc. for credit ratings opinions and services rendered by it fees ranging from 1,000 to approximately 5,000,000. MCO and Moody’sInvestors Service also maintain policies and procedures to address the independence of Moody’s Investors Service credit ratings and credit rating processes. Information regardingcertain affiliations that may exist between directors of MCO and rated entities, and between entities who hold credit ratings from Moody’s Investors Service and have also publiclyreported to the SEC an ownership interest in MCO of more than 5%, is posted annually at www.moodys.com under the heading “Investor Relations — Corporate Governance —Director and Shareholder Affiliation Policy.”Additional terms for Australia only: Any publication into Australia of this document is pursuant to the Australian Financial Services License of MOODY’S affiliate, Moody’s InvestorsService Pty Limited ABN 61 003 399 657AFSL 336969 and/or Moody’s Analytics Australia Pty Ltd ABN 94 105 136 972 AFSL 383569 (as applicable). This document is intendedto be provided only to “wholesale clients” within the meaning of section 761G of the Corporations Act 2001. By continuing to access this document from within Australia, yourepresent to MOODY’S that you are, or are accessing the document as a representative of, a “wholesale client” and that neither you nor the entity you represent will directly orindirectly disseminate this document or its contents to “retail clients” within the meaning of section 761G of the Corporations Act 2001. MOODY’S credit rating is an opinion as tothe creditworthiness of a debt obligation of the issuer, not on the equity securities of the issuer or any form of security that is available to retail investors.Additional terms for Japan only: Moody's Japan K.K. (“MJKK”) is a wholly-owned credit rating agency subsidiary of Moody's Group Japan G.K., which is wholly-owned by Moody’sOverseas Holdings Inc., a wholly-owned subsidiary of MCO. Moody’s SF Japan K.K. (“MSFJ”) is a wholly-owned credit rating agency subsidiary of MJKK. MSFJ is not a NationallyRecognized Statistical Rating Organization (“NRSRO”). Therefore, credit ratings assigned by MSFJ are Non-NRSRO Credit Ratings. Non-NRSRO Credit Ratings are assigned by anentity that is not a NRSRO and, consequently, the rated obligation will not qualify for certain types of treatment under U.S. laws. MJKK and MSFJ are credit rating agencies registeredwith the Japan Financial Services Agency and their registration numbers are FSA Commissioner (Ratings) No. 2 and 3 respectively.MJKK or MSFJ (as applicable) hereby disclose that most issuers of debt securities (including corporate and municipal bonds, debentures, notes and commercial paper) and preferredstock rated by MJKK or MSFJ (as applicable) have, prior to assignment of any credit rating, agreed to pay to MJKK or MSFJ (as applicable) for credit ratings opinions and servicesrendered by it fees ranging from JPY125,000 to approximately JPY550,000,000.MJKK and MSFJ also maintain policies and procedures to address Japanese regulatory requirements.REPORT NUMBER714 July 20211295954Austin Independent School District, TX: Update to credit analysis
U.S. PUBLIC FINANCEMOODY'S INVESTORS SERVICECLIENT SERVICES8Americas1-212-553-1653Asia 772-545414 July 2021Austin Independent School District, TX: Update to credit analysis
Austin Independent School District is a political subdivision located in central . Texas (Aaa stable) wholly within Travis County (Aaa stable). The district provides K-12 educational services to the City of Austin (Aa1 stable) area and enrolls roughly 80,000 students.