Transcription
Finance and Economics Discussion SeriesDivisions of Research & Statistics and Monetary AffairsFederal Reserve Board, Washington, D.C.Reversing the Trend: The Recent Expansion of the ReverseMortgage MarketHui Shan2009-42NOTE: Staff working papers in the Finance and Economics Discussion Series (FEDS) are preliminarymaterials circulated to stimulate discussion and critical comment. The analysis and conclusions set forthare those of the authors and do not indicate concurrence by other members of the research staff or theBoard of Governors. References in publications to the Finance and Economics Discussion Series (other thanacknowledgement) should be cleared with the author(s) to protect the tentative character of these papers.
Reversing the Trend: The Recent Expansion of theReverse Mortgage MarketHui Shan AbstractReverse mortgages allow elderly homeowners to tap into their housing wealth without having to sell or move out of their homes. However, very few eligible homeownershave used reverse mortgages to achieve consumption smoothing until recently whenthe reverse mortgage market in the United States witnessed substantial growth. Thispaper examines 1989-2007 loan-level reverse mortgage data and presents a number offindings. First, I show that recent reverse mortgage borrowers are significantly different from earlier borrowers in many respects. Second, I find that borrowers whotake the line-of-credit payment plan, single male borrowers, and borrowers with higherhouse values exit their homes sooner than other reverse mortgage borrowers. Third,I combine the reverse mortgage data with county-level house price data to show thatelderly homeowners are more likely to purchase reverse mortgages when the local housing market is at its peak. This finding suggests that the 2000-05 housing market boommay be partially responsible for the rapid growth of reverse mortgage markets. Lastly,I show that the Federal Housing Administration (FHA) mortgage limits, which capthe amount of housing wealth that an eligible homeowner can borrow against, have noeffect on the demand for reverse mortgages. The findings have important implicationsto both policy-making and the economics of housing and aging.Keywords: Reverse Mortgages, Housing, AgingJEL classification: E21, J14, R21Federal Reserve Board of Governors, hui.shan@frb.gov. I thank Edward Szymanoski and Douglas McManus for providing me with the data. I thank Michael Mulhall for excellent research assistance. I thankNeil Bhutta, Kevin Moore, Raven Molloy, Shane Sherlund, and Bill Wheaton for suggestions and comments.The findings and conclusions expressed are solely those of the author and do not represent the view of theFederal Reserve System. 1
1IntroductionHousing wealth is often the largest non-pension wealth component for many elderly homeowners. For example, the 2007 Survey of Consumer Finances (SCF) data suggest that for6.5 million homeowners aged 62 or above, housing wealth represents at least 80% of theirtotal wealth. To determine whether Americans are saving enough for retirement, it is crucialto decide how housing wealth should be treated: Are elderly homeowners willing and able touse their housing equity to finance spending in retirement? According to the 2007 SCF, 4.2million homeowners aged 62 or above had a house-value-to-income ratio of at least 10. Forthese house-rich elderly homeowners, reverse mortgages would seem to carry the potentialto increase their consumption while allowing them to continue living in their homes.The most common type of reverse mortgage is the Home Equity Conversion Mortgage (HECM), insured by the Federal Housing Administration (FHA) and constituting over90% of the U.S. reverse mortgage market.1 Despite its potential economic appeal, usingreverse mortgages to finance consumption after retirement has been the exception ratherthan the rule among elderly homeowners. From its inception in 1989 to the end of 2007, outof tens of millions of eligible homeowners, less than 400,000 loans were originated throughthe HECM program.Although usage remains relatively low, reverse mortgage markets have grown substantially in recent years. For example, in the early 1990s, only a few hundred HECM loanswere originated each year. In contrast, in 2007, over 100,000 reverse mortgage loans wereoriginated through the HECM program. Plausible explanations include rising house values,lower interest rates, and increasing awareness of the product. Also, whether the expansion istransitory or permanent remains unclear. Addressing these questions is not only essential to1Due to the current financial crisis, the private reverse mortgage market has evaporated so that HECMloans represent nearly 100% of the U.S. reverse mortgage market.2
understanding elderly homeowners’ desire to consume housing wealth, but it also providesevidence for policymakers to conduct the cost-benefit analysis and to design more efficientpolicies in facilitating the conversion of home equity into liquid assets.In this paper, I examine all HECM loans that were originated from 1989 through2007. I first present descriptive evidence on the characteristics of HECM borrowers andHECM loans with an emphasis on how these characteristics have changed over time. I thenstudy the loan termination and assignment outcomes using probit and proportional hazardmodels. A HECM loan is terminated when the borrower dies or permanently moves out of thehouse. The estimates suggest that borrowers who choose the line-of-credit payment plan,single male borrowers, and borrowers with more expensive homes terminate their HECMloans sooner than other reverse mortgage borrowers. In addition, I investigate the linkbetween house price appreciation and the growth of reverse mortgage markets. I showevidence suggesting that areas at the peak of the housing market tend to experience moreincreases in HECM loan origination. Lastly, I examine the role of FHA mortgage limitsin the reverse mortgage market. The county-specific FHA mortgage limits effectively capthe amount of housing equity a borrower can convert into liquid assets. I find no evidenceto support the claim that FHA mortgage limits have prevented reverse mortgages frombecoming more popular.To the best of my knowledge, this is the first paper using 18 years of HECM loan-leveldata to systematically study the reverse mortgage market. I take the first step to addressquestions such as what factors have contributed to the rapid growth of reverse mortgagemarkets in recent years. According to the Census Bureau, the number of persons aboveage 65 will increase to 40 million in 2010 and increase further to 81 million in 2040. Thequestions addressed in this paper will become increasingly important with the populationaging and the baby-boomers’ entering retirement age.3
The rest of this paper proceeds as follows. Section 2 overviews the existing literatureon reverse mortgages and introduces the HECM program in detail. In section 3, I describethe data used in this paper. I then show the characteristics of HECM loans and HECMborrowers in section 4. Sections 5, 6, and 7 discuss the empirical evidence on loan terminationand assignment outcomes, house price appreciation, and FHA mortgage limits, respectively.The last section concludes and clarifies common misconceptions about the reverse mortgagemarket.2Background2.1Overview of Existing StudiesThe question of whether Americans are financially prepared for retirement has inspiredheated debates in the literature.2 When evaluating retirement saving adequacy, economistsand financial planners have to decide whether housing equity should be included as consumable wealth. Because housing is both a consumption good and an investment good, thecorrect treatment of housing equity may not be obvious in the retirement saving context.For example, while Mitchell and Moore (1998) add housing equity to household net worth,Bernheim et al. (2000) exclude it in their calculation. More recently, Sinai and Souleles(2008) suggest that the fraction of “consumable housing equity” ranges from 60% to 99%for elderly homeowners depending on their age.To what degree we should consider housing equity as retirement savings depends onto what degree elderly homeowners are willing and able to consume their housing wealth. Itis well known that many seniors prefer staying in their homes for as long as they can. For2See Skinner (2007) for a review on this topic.4
example, in a survey sponsored by the American Association of Retired Persons (AARP),95% of persons 75 and older agreed with the statement “What I’d really like to do is stayin my current residence as long as possible.”3 A series of studies by Venti and Wise (e.g.,1989, 1990, and 2004) show that elderly homeowners do not reduce their housing wealth inthe absence of precipitating events such as the death of a spouse or a move to a nursinghome. If elderly homeowners have strong psychological attachments to their homes, thenreverse mortgages, which generate additional income and liquid assets for elderly homeownerswhile allowing them to continue living in their homes, may be welfare-improving for manyhouseholds.A number of studies have estimated the potential size of the reverse mortgage market. Venti and Wise (1991) analyze the 1984 Survey of Income and Program Participation(SIPP) data and find that a reverse mortgage in the form of annuity payments would substantially affect the income of the single elderly who are very old. Merrill et al. (1994) usethe 1989 American Housing Survey (AHS) data to show that out of the 12 million elderlyhomeowners who own their homes free and clear, 800,000 could benefit substantially fromreverse mortgages. Mayer and Simons (1994) consider both income increases and debt reductions as benefits of reverse mortgages and find a much larger potential market for reversemortgages than previous studies: Over 6 million homeowners in the U.S. could see theireffective monthly income being raised at least 20% by reverse mortgages.In practice, the reverse mortgage market is much smaller than expected. On thedemand side, a number of factors may have prevented the reverse mortgage market fromgrowing bigger. First, elderly homeowners with strong bequest motives may not find reversemortgages attractive because reverse mortgages reduce the amount of wealth they can leaveto their estates. Second, the probability of shouldering large medical expenses increases over3See Bayer and Harper (2000).5
time for the elderly. In the absence of other forms of protections such as Long-Term CareInsurance, many elderly homeowners use their housing equity to self-insure. Using a surveyconducted on 2,673 homeowners aged 50 to 65, Munnell et al. (2007) report that nearlyone-half of the respondents who claim they are not planning to tap their housing equityin retirement list “insurance against living and health expenses” as the reason. Davidoff(2008a) presents a model suggesting that such behaviors may even be optimal. Third,certain features of the HECM program and its interaction with some welfare programs maybe undesirable. For example, a HECM loan usually requires large upfront costs, the amountof home equity against which one can borrow is capped by the FHA mortgage limits, and theadditional income received from a HECM loan may disqualify one from public assistance suchas Supplemental Security Income (SSI) or Medicaid. Michelangeli (2008) argues that reversemortgages could be welfare-reducing if borrowers face significant moving risks. Fourth,reverse mortgages are complex financial products and can be particularly challenging forelderly homeowners. Conversations with people in the industry suggest that many seniorhomeowners have misconceptions about reverse mortgages. Lastly, the elderly may valueowning their homes free and clear so much that they are averse to the idea of borrowingagainst them.On the supply side, lenders face various obstacles as well. First, reverse mortgagesare significantly different from traditional “forward” mortgages. Lenders with little experience in the reverse mortgage market often have to confront unfamiliar documentation andregulatory requirements. For example, lenders who are accustomed to forward mortgageshave to prepare different documents for reverse mortgages to satisfy the Truth-in-LendingAct requirements. As a result, lenders must designate reverse mortgage specialists amongtheir employees. Because the HECM program caps origination fees charged by lenders, sucha move is only economical if there is a sufficient volume of HECM loan originations. Another consideration is that different states have different regulations with respect to reverse6
mortgages. To comply with such regulations, lenders who operate in multiple states have tobear additional costs. In addition, because of the unconventional cash-flow pattern, reversemortgages are difficult to securitize and finance. In fact, according to Szymanoski et al.(2007), HECM loans were not securitized until August 2006. Finally, the Fair Housing Actprohibits pricing loans based on gender, despite the fact that elderly males and females havevery different life expectancies.Besides the factors discussed above, economists have also recognized that reversemortgage markets may suffer from adverse selection and moral hazard problems. Becausereverse mortgage loans are not due until the borrower dies or permanently moves out, peoplewho know they are likely to stay in their homes for a long time will find reverse mortgagesmore attractive than others. However, Davidoff and Welke (2007) find advantageous selectionin the HECM program. In other words, HECM borrowers appear to exit their homes at afaster pace than the general population. The authors suggest that higher discount rate amongthe borrowers combined with house price appreciation may explain observed advantageousselection. Furthermore, economists are concerned that the moral hazard problem of homemaintenance would make lenders think twice before entering the reverse mortgage market.Davidoff (2006) uses AHS data to show that homeowners over 75 years of age spend less onroutine maintenance than younger owners of similar homes.Overall, most of the studies on reverse mortgages do not have loan-level data and,therefore, have to rely on hypothetical borrowers. Among the few studies that do look atloan-level data, Davidoff (2006) and Szymanoski et al. (2007) focus only on termination ratesof HECM loans, and Case and Schnare (1994) and Rodda et al. (2000) analyze only the datafrom earlier years of the HECM program. Given that 88% of all HECM loans originatedfrom 1989 through 2007 were taken out after 2000, the field calls for research using morerecent data. This paper aims to fill the gap.7
2.2Background on the HECM ProgramThe Congress established the HECM program in 1987 and authorized the Department ofHousing and Urban Development (HUD) to administer the program. The first HECM loanwas made in 1989. Since then, the HECM program has been the dominant reverse mortgageproduct in the United States.4 To be eligible for a HECM loan, borrowers have to be 62years of age or older, and occupy the property as their principal residence. Borrowers musteither own their homes outright or have a small mortgage balance. A HECM loan is a “nonrecourse” loan, meaning that the borrower and her estate will never be required to pay morethan the value of the property and that no other assets can be seized to repay the loan.HECM loans differ from traditional home equity loans or home equity line of credit(HELOC) in two ways. First, a HECM loan does not have a fixed maturity date. The loanbecomes due and payable only after the borrower dies or the borrower no longer occupies theproperty as a principal residence. Second, while home equity loans and HELOCs generallyrequire borrowers to have sufficient income and creditworthiness, HECM loans do not havesuch underwriting requirements.5 Therefore, house-rich but cash-poor elderly homeownerswho cannot obtain home equity loans may find HECM loans particularly attractive.The amount that the borrower can receive from a HECM loan is calculated in threesteps. The first step is to determine the Maximum Claim Amount (MCA) – the lesser ofthe appraised value of the property or the county-specific FHA mortgage limits for a onefamily residence under section 203 (b) of the National Housing Act. The limits are usuallyset at 95% of the median sales prices for any given county in a given year, although MCAsare subject to both ceiling and floor levels, creating nationwide maximum and minimum4Other reverse mortgage products include the Home Keeper program offered by Fannie Mae and jumboreverse mortgage loans offered by private lenders.5However, borrowers who have delinquent or defaulted on federal debt may not be eligible for HECMloans.8
values for the FHA mortgage limits. For example, the ceiling was 362,790 and the floor was 200,160 in 2007.The second step is to determine the Initial Principal Limit (IPL) by multiplying theMCA by a factor between zero and one. The magnitude of the factor depends on the ageof the borrower and the “expected interest rate” at the time of loan closing.6 The expectedinterest rate, a proxy for future interest rate, equals the sum of the ten-year Treasury rateand the lender’s margin. The lender’s margin is typically between 100 and 200 basis points.These principal limit factors are designed such that, under certain assumptions, the loanbalance reaches the MCA at the time when the loan becomes due in expectation.7 As aresult, the factor increases with the borrower’s age and decreases with the expected interestrate. For example, the factor equals 0.281 for a 65-year-old at a 10 percent expected rate,and it equals 0.819 for an 85-year-old at a 5 percent expected rate.The third step is to calculate the Net Principal Limit (NPL), which is the amountthe borrower can take as a lump sum in cash at closing, by subtracting from the initialprincipal limit the upfront costs associated with HECM loans and a set-aside for a monthlyservicing fee. The upfront costs include the initial Mortgage Insurance Premium (MIP),origination fee, and closing costs. The initial MIP is set at 2% of the MCA. The originationfee is set at 2,000 or 2% of the MCA, whichever is greater.8 Closing costs include originationfees and other third-party fees such as appraisal fees, credit report fees, and title insurancefees. Overall, the upfront costs on a HECM loan range between 7,000 and 20,000. Aservicing fee set-aside is the present value of the monthly servicing fee charged by the lender.6For married couples, only the age of the younger borrower is taken into consideration.See Szymanoski (1994) for detailed discussions on the assumptions that HUD makes to calculate theprincipal limit factors.8The Housing and Economic Recovery Act of 2008 established new limits on the loan origination fee forHECM loans. The limit is the greater of 2,500 or 2 percent of the first 200,000 of the MCA, plus 1 percentof the portion of the MCA that is greater than 200,000. The total amount of loan origination fee may notexceed 6,000.79
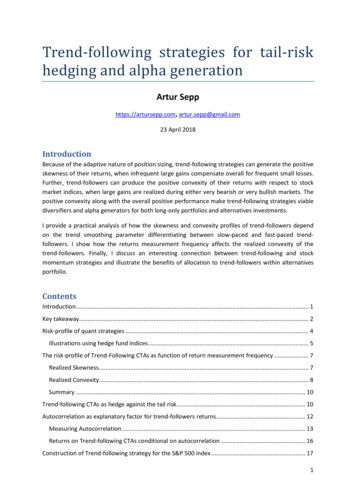
The typical monthly servicing fee is 30 or 35. Both the upfront costs and servicing feesare financed rather than paid by the borrower out of pocket. Figure 1 summarizes the stepsdescribed above in calculating the net principal limit.Given the amount of net principal limit, HECM borrowers can choose from fivepayment plans to receive the mortgage proceeds. Under the Tenure plan, the borrowerwill receive equal monthly payments from the lender for as long as the borrower lives andcontinues to occupy the property as her principal residence. This payment plan is also calleda “reverse annuity mortgage” in the literature due to its resemblance to an annuity product.Under the Term plan, the borrower will receive equal monthly payments from the lender fora fixed period of months selected by the borrower. Note that even though payments stop atthe end of the selected term, the loan is not due until the borrower dies or moves out of his orher home. Under the Line of Credit plan, the borrower will receive the mortgage proceeds inunscheduled payments or in installments, at times and in amounts of the borrower’s choosing,until the line of credit is exhausted. This payment plan is the most popular among HECMborrowers. In addition, the Modified Tenure plan allows the borrower to combine a line ofcredit with a tenure plan. The Modified Term plan allows the borrower to combine a line ofcredit with a term plan.9 Table 1 shows the principal limit factor, net principal limit, themonthly payment under a tenure plan, and monthly payment under a 10-year term plan for ahypothetical borrower, assuming a MCA of 200,000, an initial MIP of 4,000, an originationfee of 4,000, closing costs of 2,000, and a monthly servicing fee of 30.One key feature of HECM loans is the FHA insurance program. Under this program,HUD insures the borrower against the risk that the lender can no longer make the contractedpayments. It also insures the lender against the risk that the loan balance exceeds theproperty value. For example, lenders can assign loans to HUD when the loan balance reaches9Borrowers may change their payment plan throughout the life of the loan at a small cost.10
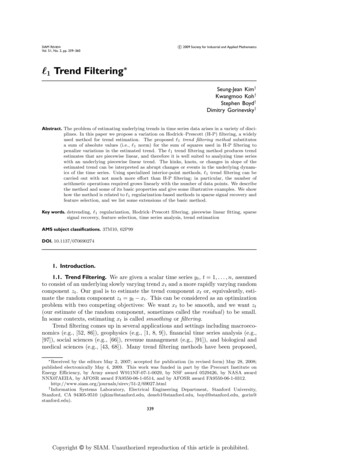
98% of the MCA. In the event that the proceeds from the sale of the property are not sufficientto pay the outstanding loan balance, lenders who have not assigned the mortgage to HUDcan submit a claim for insurance benefits up to the MCA. To pay for this insurance program,HUD charges a Mortgage Insurance Premium (MIP). The initial MIP, as mentioned before,is set at 2% of the MCA. The monthly MIP is set at an annual rate of 0.5% and is chargedon the outstanding balance of a HECM loan.3Data DescriptionThe data I analyze in this paper are the loan-level HECM data provided by HUD. I haveinformation for all HECM loans made between 1989 and 2007, a total of 387,999 recordsin the raw data, including the age of the borrower, age of the co-borrower, gender andmarital status of the borrower, the appraised value of the property at origination, locationof the property (i.e., state and ZIP code), the Maximum Claim Amount (MCA), expectedinterest rate, Initial Principal Limit, choice of payment plan, monthly payment amount, loanorigination date, loan termination date, loan assignment date, whether a claim was filed toHUD by the lender, and the nature of the claim.In the process of data cleaning, I dropped irregular observations such as loans withmissing borrower age, missing gender or marital status indictor, and loans that were notendorsed by HUD for various reasons. I also dropped borrowers from places other than thecontinental United States because the FHA mortgage limits for Alaska, Guam, Hawaii andthe Virgin Islands are very different from the rest of the country. After these procedures, Ihave a final sample of 375,392 observations.Figure 2 shows the number of HECM loans originated each year beginning 1989through 2007. In the early years of the program, only a small number of elderly homeowners11
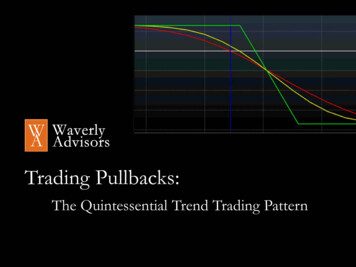
took out HECM mortgages. In contrast, loan origination has grown substantially in recentyears. For instance, the number of loans made in 2007 is ten times the number in 2001. Oneof the potential explanations for such significant growth is that elderly homeowners havebecome more comfortable taking equity out of their homes and taking on debt in general.To test the plausibility of this explanation, I used the 1989-2007 SCF data and plotted inFigure 3 the fraction of homeowners aged 62 or above who have credit card debt, debt securedby their primary residences, or any type of debt. The fraction of elderly homeowners withcredit card debt trended up slightly over the 18-year sample period. The fraction of elderlyhomeowners with mortgages, home equity loans, or home equity lines of credit increasedsteadily from 22% in 1989 to 39% in 2007. The fraction of elderly homeowners with anytype of debt rose from 44% to 57%. The SCF data suggest that an increasing proportion ofelderly homeowners feel comfortable taking on debt secured by their homes. However, sucha shift in financial attitude is unlikely to fully explain the unusually large increase in reversemortgage origination. Other factors may also have contributed to the growth of the HECMprogram, including the 2000-05 housing market boom, lower interest rates in recent years,and more awareness of reverse mortgages among elderly homeowners.To perform the empirical analysis shown later in this paper, I merged the HECMloan-level data with a number of public and proprietary data sets. First, I used the 2000Census ZIP code level data to characterize the neighborhoods where reverse mortgages wereoriginated. Second, I used the monthly county-level house price indexes purchased from FirstAmerican CoreLogic to study the relationship between house price appreciation and reversemortgage market growth. This data set covers 679 counties in the United States and mergedwith approximately 90% of the loans in the HECM data set. Third, I used the 1990-2008county-level FHA mortgage limit data to examine the effect of these limits on the demandfor reverse mortgages. Lastly, I used a data set purchased from the United States PostalService to match ZIP codes with counties for each HECM loan in my sample.12
The administrative data analyzed in this paper are essential for studying the reversemortgage market, because reverse mortgage borrowers are a tiny fraction of the general population and they are unlikely to be captured by public surveys. In addition, administrativedata tend to be more accurate than self-reported data in most public surveys. Nevertheless,there are a couple of caveats associated with the data. First, similar to many administrativedata sets, we do not know very much about these borrowers beyond their characteristicsthat are used in the HECM pricing model. For example, we do not know the income andfinancial wealth of these borrowers, nor do we know their demographic characteristics suchas race, eduction, and number of children. Second, according to the staff member at HUDwho shared the data with us, our data come from a snapshot at the end of 2007. Becauseborrowers are allowed to change their payment plans at a small cost, it is possible that thepayment plan we observe is not the original payment plan chosen by the borrower.10 Moreover, if borrowers chose the line-of-credit payment plan, I do not observe when and by howmuch they drew down the line of credit.4Characteristics of HECM Borrowers and LoansIn this section, I first compare reverse mortgage borrowers with the general population. Ithen show the difference between borrowers who took out reverse mortgages in the earlyyears of the HECM program and borrowers who took out reverse mortgages in 2007. Thiscomparison highlights the significant changes in HECM borrower and loan characteristicsover time. In addition, I present evidence on where reverse mortgage borrowers come from,using the geographic identifiers in the HECM data.10According to industry specialists, most of the payment plan changes are adding a line-of-credit option toexisting term or tenure policies. Because HUD does not keep records on the payment plan history of HECMloans, such assertions cannot be verified.13
Reverse mortgage borrowers are generally older than eligible homeowners in thegeneral population. The median age of HECM borrowers at the time of loan originationis 73.5, and the median age of homeowners 62 years or older in the 2000 Census is 72.0.Single males and single females are more likely to take out reverse mortgages than marriedcouples. According to the 2000 Census, 52.8% of homeowners aged 62 or above are marriedcouples. However, only 36.0% of reverse mortgage borrowers are married couples. Moreover,reverse mortgage borrowers tend to have more expensive houses than the general populationof elderly homeowners. Panel B of Table 2 compares the median home value of HECMborrowers with that of the SCF respondents who are homeowners aged 62 or older.Characteristics of HECM borrowers and HECM loans change substantially overtime. Figure 4 shows the age distribution of early borrowers and that of recent borrowers;early borrowers refer to loans originated between 1989 and 1999, and recent borrowers referto loans originated in 2007. Two features of this figure are worth mentioning. First, thedistribution of borrower age shifts to the left over time, meaning that recent borrowers areyounger than early borrowers at the time of loan origination. Second, there is a spike atage 62 in the histogram for recent borrowers but not in the histogram for early borrowers.Such a spike suggests that homeowners younger than age 62 may want to purchase reversemortgages if allowed. These two features imply that the demand for reverse mortgages hasbeen growing most rapidly among younger elderly homeowners.Besides age, Panel A of Table 2 also shows the difference between early borrowersand recent borrowers along other dimensions. For example, an increasing number of singlemales and married couples entered the reverse mortgage market relative to single females.The average expected interest rate faced by HECM borrowers, which is the ten-year Treasuryrate plus the lender’s margin, declined from 7.5% in early years to 5.7% in 2007. The fractionof borrowers choosing the line-of-credit payment plan increased from 71.4% between 198914
and 1999 to 86.9% in 2007.An elderly homeowner who wants to tap into her housing wealth generally has twooptions: selling the house or taking out a HECM loan, both of which involves considerabletransaction costs. While selling the house would allow the elderly homeowner to access allof her housing equity, the FHA mortgage limits may limit the fraction of housing equity she
The most common type of reverse mortgage is the Home Equity Conversion Mort-gage (HECM), insured by the Federal Housing Administration (FHA) and constituting over 90% of the U.S. reverse mortgage market.1 Despite its potential economic appeal, using reverse mortgages to finance consumption after retirement has been the exception rather