Transcription
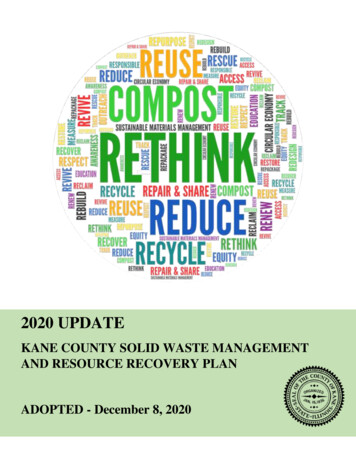
Municipal Solid Waste Generation, Recycling,and Disposal in the United States:Facts and Figures for 2012The U.S. Environmental Protection Agency (EPA) has collected and reported data onthe generation and disposal of waste in the United States for more than 30 years. Weuse this information to measure the success of waste reduction and recycling programsacross the country. These facts and figures are current through calendar year 2012.In 2012, Americans generated about 251 million tons1 of trash and recycled andcomposted almost 87 million tons of this material, equivalent to a 34.5 percentrecycling rate (See Figure 1 and Figure 2). On average, Americans recycled andcomposted 1.51 pounds out of our individual waste generation rate of 4.38 poundsper person per day.EPA is thinking beyond waste and seeking a systematic approach that provides atransition from waste management to sustainable materials management (SMM).In this year’s report, EPA explores the connection between personal consumerexpenditures and the generation of wastes. The transition is well under way, with theU.S. economy continuing to provide goods and services for household consumptionmore efficiently when looking at the MSW generated from consuming those goods andservices.Figure 1. MSW Generation Rates, 1960 to 985Total MSW generation14199019952000200520102012Per capita generation (lbs/person/day)Total MSW generation (million tons)208.30Per capita generationU.S. short tons unless specified.1
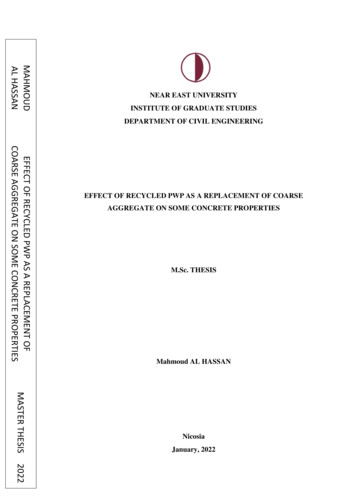
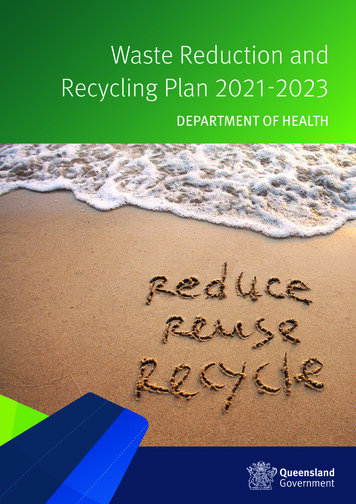
Figure 2. MSW Recycling Rates, 1960 to 20129050%85.279.88086.669.540%Total MSW recycling (million t of generation Total MSW recyclingTrends in Municipal Solid Waste in2012Our trash, or municipal solid waste (MSW), iscomprised of various items Americans commonlythrow away after being used. These include itemssuch as packaging, food waste, grass clippings, sofas,computers, tires, and refrigerators. MSW does notinclude industrial, hazardous, or construction waste.In 2012, Americans recovered over 65 million tonsof MSW through recycling and over 21 milliontons through composting. We combusted about 29million tons for energy recovery (about 12 percent).Subtracting out what is recycled and composted, wecombusted (with energy recovery) or discarded inlandfills 2.9 pounds per person per day of MSW.199019952000200520100%2012Percent recyclingOver the last few decades, the generation,recycling, composting, and disposal of MSWhave changed substantially. Solid wastegeneration per person per day peaked in 2000while the 4.38 pounds per person per day isthe lowest since the 1980’s. The recycling ratehas increased–from less than 10 percent ofMSW generated in 1980 to over 34 percentin 2012. Disposal of waste to a landfill hasdecreased from 89 percent of the amountgenerated in 1980 to under 54 percent of MSWin 2012.In 2012, lead-acid battery recovery was about 96percent (2.8 million tons). Newspaper/mechanicalpapers recovery was about 70 percent (5.9 milliontons), and over 57 percent of yard trimmings were recovered (19.6 million tons) (see Figure 3). About 135million tons of MSW (53.8 percent) were discarded in landfills in 2012 (see Figure 4).Sources of MSWSources of MSW include residential waste (including waste from apartment houses) and waste fromcommercial and institutional locations, such as businesses, schools, and hospitals.2
Figure 3. Recycling Rates of Selected Products, 2012**10095.9Recycling Rate nical Papers TrimmingsAluminumBeer& Soda CansTiresGlassContainersPET Bottles& JarsSelectedHDPE NaturalConsumer (White Translucent)ElectronicsBottlesProducts**Does not include combustion with energy recovery.Figure 4: Management of MSW in the United States, 2011Figure 4. Management of MSW in the United States, 2012Combustion withEnergy Recovery11.7%Recovery34.5%Discarded53.8%3
Analyzing MSWWe analyze waste by material, such as plastics, and paperand paperboard, and by major product categories, whichinclude durable goods (such as furniture), nondurablegoods (such as paper or clothing), containers andpackaging (such as milk cartons and plastic wrap), andother materials (such as food waste).Materials in MSWNationally, Americans recycled andcomposted almost 87 million tons ofmunicipal solid waste. This provides anannual benefit of more than 168 millionmetric tons of carbon dioxide equivalentemissions reduced, comparable to theannual GHG emissions from over 33Total MSW generation in 2012 was 251 million tons.million passenger vehicles.2Figure 5 shows the breakdown of MSW generated,by material. Organic materials such as paper andpaperboard, yard trimmings, and food waste continue tobe the largest component of MSW. Paper and paperboardaccount for over 27 percent and yard trimmings and food waste accounts for another 28 percent. Plasticscomprise about 13 percent; metals make up 9 percent; and rubber, leather, and textiles account foralmost 9 percent. Wood follows at over 6 percent and glass at almost 5 percent. Other miscellaneouswastes make up approximately 3 percent of the MSW generated in 2012.Total MSW recovery in 2012 was almost 87 million tons. Paper and paperboard account for over 51percent and yard trimmings account for over 22 percent, while food waste accounts for another 2percent. Metals comprise about 9 percent; glass about 4 percent; and plastic and wood about 3 percenteach. Other miscellaneous materials make up about 6 percent of MSW recovery in 2012 (see Figure 6).After MSW recovery through recycling and composting, 164 million tons of MSW were discarded in2012. Food waste is the largest component of discards at 21 percent. Plastics comprise about 18 percent;paper and paperboard make up almost 15 percent; and rubber, leather, and textiles account for about 11percent of MSW discards. The other materials accountfor less than 10 percent each (see Figure 7).Recycling and compostingSignificant amounts of material from each categorywere recycled or composted in 2012. The highestalmost 87 million tons ofrecovery rates were achieved in paper and paperboard,MSW saved more than 1.1yard trimmings, and metals. Americans recycledquadrillion Btu of energy;more than 64 percent of the paper and paperboardgenerated. Over 19 million tons of yard trimmingsthat’s the same amountwere composted, representing almost a five-foldof energy consumed by almost 10 millionincrease since 1990. Recycling these three materialsalone kept over 28 percent of MSW generated out ofU.S. households in a year.landfills and combustion facilities. Recycling amountsand rates (recovery as a percent of generation) for allmaterials in 2012 are listed in Table 1. This table alsopresents millions of tons of discarded materials.24 ll benefit calculations in this fact sheet are derived from EPA’s Waste Reduction Model (WARM). Please see www.epa.gov/warm. All benefits information that wasAincluded in last year’s report only took into account the CO2 reduction for recycling of materials. In the report this year, we are accounting for both the recycling ofthose materials and the CO2 emissions that may occur in the alternative waste management scenarios of landfilling and combustion. This gives us the net overallbenefit of recycling these materials.
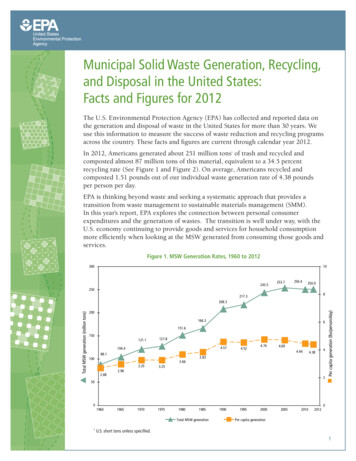
Figure 5. Total MSW Generation (by material), 2012251 Million Tons (before recycling)Figure 6. Total MSW Recovery (by material), 2012Figure 6. Total MSW Recovery (by material), 201287 Million TonsFigure 5. Total MSW Generation (by material), 2012250 Million Tons (before recycling)Plastics 3.2%Wood 2.8% Food waste 2.0%Other 5.7%Glass3.7%Yardtrimmings13.5%Food waste14.5%Other 3.4%Metals 8.8%Wood6.3%Rubber, leather& textiles8.7%Paper & paperboard27.4%Plastics12.7%Metals8.9%Yard trimmings 22.6%Paper & paperboard 51.2%Glass4.6%Figure 7. Total MSW Discards (by material), 2012Figure 7. Total MSW Discards (by material), 2012164 Million Tons (after recycling and composting)Rubber, leather& textiles11.2%Food waste21.1%Figure 8: Total MSW Generation (by category), 2012Figure 8. Total249.6MSW Generationproductcategory), 2012Million tons(by(beforerecycling)251 Million Tons (before recycling)Other 4.3%Containers & packaging30.0%Paper & paperboard14.8%Wood8.2%Yard trimmings8.7%Plastics17.6%Glass5.1%Metals9.0%Food waste14.5%Yard trimmings13.5%Nondurable goods20.5%Durable goods19.9%Other1.6%5
Table 1. Generation, Recovery, and Discards of Materials in MSW, 2012*(in millions of tons and percent of generation of each material)WeightGeneratedWeightRecoveredRecovery as Percentof GenerationWeightDiscardedPaper and 87Other nonferrous ics31.752.808.8%28.95Rubber and 8Wood15.822.4115.2%13.41Other od, other‡36.431.744.8%34.69Yard trimmings33.9619.5957.7%14.37Miscellaneous inorganic 2.96250.8986.6234.5%164.27MaterialMetalsTotal metalsTotal materials in productsOther wastesTotal other wastesTotal municipal solid waste*Includes waste from residential, commercial, and institutional sources.†Includes lead from lead-acid batteries.‡Includes recovery of other MSW organics for composting.Details might not add to totals due to rounding.Negligible Less than 5,000 tons or 0.05 percent.Materials and ProductsWe track both materials and products. Materials are what products are made of and will ultimately be whatis recovered and be reprocessed in the recycling process. Examples are metals and plastic. Products arewhat people buy and handle. Products are manufactured out of materials. Examples include packaging andnewspapers. We track products to learn how people are consuming, using, and discarding materials. Thisinformation allows us to target activities that will ultimately maximize the recovery of materials.6
Products in MSWThe breakdown of MSW generated in 2012 by productcategory is shown in Figure 8. Containers and packagingmade up the largest portion of MSW generated: 30 percent,or over 75 million tons. The second largest portion camefrom nondurable goods, which amounted to over 20 percent,or about 51 million tons. Durable goods make up the thirdlargest segment, accounting for about 20 percent, or 50million tons.Recycling TrendsIn percentage of total MSW generation,recycling (including composting) did notexceed 15 percent until 1990. Growthin the recycling rate was significant overthe next 15 years. The recycling rate hasThe generation, recovery, and discards of materials in thegrown more slowly over the last fiveproduct categories, by weight and recovery as a percent ofyears.generation, are shown in Table 2. This table shows that therecovery of containers and packaging was the highest of thefour product categories, with over 51 percent of the generatedmaterials recycled. Paper products, steel, and aluminum were the most recycled materials by percentagein this category. Over 76 percent of paper and paperboard containers and packaging was recycled. Over 72percent of steel packaging (mostly cans) was recycled. The recycling rate for aluminum packaging was 38percent, including almost 55 percent of aluminum beverage cans.Over 34 percent of glass containers were recycled while about 25 percent of wood packaging, mostlywood pallets, was recovered. About 14 percent of plastic containers and packaging were recycled,mostly from soft drink, milk, and water bottles. Plastic bottles were the most recycled plastic products.Polyethylene terephthalate (PET) bottles and jars were recovered at about 31 percent. Recovery of highdensity polyethylene (HDPE) natural (white translucent) bottles was also estimated at over 28 percent(see 2012 MSW full data tables).Overall recovery of nondurable goods was about 34 percent in 2012. Nondurable goods generally lastless than three years. Newspapers/mechanical papers and other paper products were the most recyclednondurable goods. Newspapers/mechanical papers include newspapers, directories, inserts, andsome advertisement and direct mail printing. Seventy percent of newspapers/mechanical papers wererecovered. Collectively, the recovery of other paper products such as office paper and magazines was over43 percent in 2012. Clothing, footwear, and other textile products are included in the nondurable goodscategory. These products were recovered for recycling at a rate of over 16 percent.Overall, more than 18 percent of durable goods was recovered in 2012. Nonferrous metals other thanaluminum had one of the highest recovery rates due to the high rate of lead recov ery from lead-acidbatteries. With an almost 96 percent recycling rate, lead-acid batteries continue to be one of the mostrecovered products. Recovery of steel in all durable goods was 27 percent, with high rates of recoveryfrom appliances and other miscellaneous items. Recovery of selected consumer electronics was 29% (see2012 MSW full data tables).Measured by percentage of generation, products with thehighest recovery rates in 2012 were lead-acid batteries (96percent), corrugated boxes (91 percent), steel cans (71 percent),newspapers/mechanical papers (70 percent), major appliances(64 percent), yard trimmings (58 percent), aluminum cans (55percent), tires (45 percent), and mixed paper (43 percent) (see2012 MSW full data tables).Every ton of mixed paper recycledcan save theenergy equivalentof 165 gallons ofgasoline.7
Table 2. Generation, Recovery, and Discards of Products in MSW, 2012*(in millions of tons and percent of generation of each product)WeightGeneratedWeightRecoveredRecovery as Percentof luminum1.52Not AvailableNot Available1.52Other non-ferrous gible2.19Plastics11.460.776.7%10.69Rubber and le6.16Textiles3.880.5514.2%3.33Other materials1.731.3075.6%0.4250.039.2718.5%40.76Paper and 6.38Rubber and 7016.7%8.45Other 1.16Glass9.383.2034.1%6.18Paper and %11.88Wood9.662.4124.9%7.25Other 5%36.48Food, other‡36.431.744.8%34.69Yard trimmings33.9619.5957.7%14.37Miscellaneous inorganic wastes3.90NegligibleNegligible3.90Total other oductsDurable goodsTotal durable goodsNondurable goodsTotal nondurable goodsContainers and packagingTotal containers and packagingOther wastesTotal municipal solid waste*†‡8Includes waste from residential, commercial, and institutional sources.Includes lead from lead-acid batteries.Includes recovery of other MSW organics for composting.Details might not add to totals due to rounding.Negligible less than 5,000 tons or 0.05 percent.
Disposing of MSWComposting Collection Programs3While the number of U.S. landfills has steadily declinedover the years, the average landfill size has increased. Atthe national level, landfill capacity appears to be sufficientfor our current disposal practices, although it is limited insome areas. About 3,120 community composting programs were documented in 2012,a decrease from 3,227 in 2002. Since 1990, the total amount of MSW going to landfillsdropped by over 11 million tons, from 145.3 mil lion to135.0 million tons in 2012 (see Table 3). Over 2.4 million households wereserved with food waste compostingcollection programs in 2012. The net per capita discard rate to landfills (afterrecycling, composting, and combustion for energyrecovery) was 2.36 pounds per day, lower than the 3.19per capita rate in 1990 (see Table 4).Table 3. Generation, Materials Recovery, Composting, Combustion With Energy Recovery, and Discards of MSW,1960 to 2012 (in millions of .4250.4250.9Recovery Recovery 520.622.120.220.621.3Total 986.6Discards .3163.5164.3Combustionwith 29.3Discards tolandfill, 136.0134.2135.0*Composting of yard trimmings, food waste, and other MSW organic material. Does not include backyard composting.† Includes combustion of MSW in mass burn or refuse-derived fuel form, and combustion with energy recovery of source separated materials in MSW(e.g., wood pallets, tire-derived fuel).‡Discards after recovery minus combustion with energy recovery. Discards include combustion without energy recovery.Details might not add to totals due to rounding.3Source: For 2002 data: BioCycle 2006.For 2012 data: EPA, Municipal Solid Waste in the United States: 2012 data tables and BioCycle, 2013.9
Table 4. Generation, Materials Recovery, Composting, Combustion With Energy Recovery,and Discards of MSW, 1960 to 2012 (in pounds per person per 38Recovery 14Recovery 320.380.400.360.360.37Total .531.51Discards .87Combustionwith .510.51Discards tolandfill, 9.907 281.422 296.410 304.060 309.051 311.592 313.914Composting of yard trimmings, food waste, and other MSW organic material. Does not include backyard composting.† Includes combustion of MSW in mass burn or refuse-derived fuel form, and combustion with energy recovery of source separated materials in MSW (e.g.,wood pallets, tire-derived fuel).‡Discards after recovery minus combustion with energy recovery. Discards include combustion without energy recovery.Details might not add to totals due to rounding.The Benefits of RecyclingRecycling has environmental benefits at every stage in the life cycle of a consumer product—from theraw material with which it’s made to its final method of disposal. By utilizing used, unwanted, or obsoletematerials as industrial feedstocks or for new materials or products, Americans can each do our part tomake recycling, including composting work. Aside from reducing GHG emissions, which contribute toglobal warming, recycling, including composting also provides significant economic and job creationimpacts.The energy and GHG benefits of recycling and composting shown in Table 5 are calculated usingEPA’s WARM methodology (see: www.epa.gov/warm). WARM calculates and totals GHG emissions ofbaseline and alternative waste management practices, including source reduction, recycling, composting,combustion, and landfilling. Paper and paperboard recovery at about 44 million tons resulted in areduction of 130 MMTCO2E in 2012. This is equivalent to removing 27 million cars from the road in oneyear.In 2012, nationally, we recycled and composted almost 87 million tons of MSW. This provides an annualbenefit of more than 168 million metric tons of carbon dioxide equivalent emissions reduced, comparableto removing the emissions from over 33 million passenger vehicles from the road in one year.10
Table 5. Greenhouse Gas Benefits Associated with Recovery of Specific Materials, 2012*(in millions of tons recovered, MMTCO2E and in numbers of cars taken off the road per year)Weight Recovered(millions of tons)GHG BenefitsMMTCO2EPaper and paperboard44.4130.5Glass3.201210 thousandSteel5.5591.9 millionAluminum0.716.31.3 millionOther nonferrous metals†1.365.31.1 millionTotal metals7.6220.64.3 millionPlastics2.803.2670 thousandRubber and leather‡1.350.7145 thousandTextiles2.255.71.2 millionWood2.414.2900 thousandFood, other 1.741.4290 thousandYard trimmings19.60.8170 thousandMaterialNumbers of Cars Taken Offthe Road per Year27 millionMetalsOther wastes*Includes materials from residential, commercial, and institutional sources. These calculations do not include an additional 1.30 million tons of MSW recovered that could not be addressed in the WARM model. MMTCO2E is millionmetric tons of carbon dioxide equivalent. All benefits information that was included in last year’s report only took into account the CO2 reduction for recycling of materials. In the report this year, weare accounting for both the recycling of those materials and the CO2 emissions that may occur in the alternative waste management scenarios of landfillingand combustion. This gives us the net overall benefit of recycling these materials.†Includes lead from lead-acid batteries. Other nonferrous metals calculated in WARM as mixed metals.‡Recovery only includes rubber from tires. Includes recovery of other MSW organics for composting.Source: WARM model (www.epa.gov/warm)MSW Generation and Household SpendingOver the years, the change in the amount of MSW generated has typically imitated trends in how muchmoney American households spend on goods and services. Personal Consumer Expenditures (PCE)measures U.S. household spending on goods and services such as food, clothing, vehicles, and recreationservices. PCE accounts for approximately 70 percent ofU.S. Gross Domestic Product, a key indicator of economicRecycling just 1 ton of aluminum cansgrowth. PCE adjusted for inflation is referred to as realPCE. This is a more useful metric in making comparisonsconserves more than 153 million Btu,over time because it normalizes the value of a dollar bythe equivalent of 26considering how much a dollar could purchase in the pastversus today. Figure 9 explores the relationship betweenbarrels of oil, or 1,665MSW generated and real PCE since 1960.gallons of gasoline.Figure 9 is an indexed graph showing the relative changesin real PCE, MSW generated, and MSW generated per capita11
Figure 9. Indexed MSW Generated and Real PCE over Time(1960-2012)Figure 9. Indexed MSW Generated and Real PCE over Time (1960-2012)6.005.00Indexed Value4.003.002.001.000.00196019651970Real PCE1975198019851990MSW Generated19952000200520102012MSW Generated per Capitaover time. It is indexed to allow all three of these metrics to be shown on the same graph and comparetheir relative rates of change since 1960. The indexed value indicates the change in the value of the datasince 1960. For example, if for a given year the value is three then the data value for that year wouldbe three times the 1960 value. In this case, if the 1960 value was 200 then the resulting year’s valuewould be 600. The 2012 MSW per capita generation indexed value is 1.6 which means MSW per capitageneration has increased by 60 percent since 1960.Figure 9 shows that real PCE has increased at a faster rate than MSW generation, and the disparity hasbecome even more distinct since the mid 1990s. This indicates the amount of MSW generated per dollarspent is falling. In other words, our economy has been able to enjoy dramatic increases in householdspending on consumer goods and services without this being at the expense of the societal impact ofsimilarly increasing MSW generation rates. This figure alsoshows that the MSW generated per capita leveled off in theearly- to mid-2000s and has fallen since then. This is importantEnergy Recovered frombecause as population continues to grow, it will be necessaryWaste Combustionfor MSW generated per capita to continue to fall to maintain ordecrease the total amount of MSW generated as a country. In 2012, over 29 million tons ofThinking Beyond WasteEPA is helping change the way our society protects theenvironment and conserves resources for future generationsby thinking beyond recycling, composting, and disposal.Building on the familiar concept of Reduce, Reuse, Recycle,the Agency is employing a systemic approach that seeks toreduce materials use and associated environmental impacts overtheir entire life cycle, called sustainable materials management12materials, or 11.7 percent, werecombusted for energy recovery. MSW combustion for energyrecovery has decreased fromabout 34 million tons in 2000 to29 million tons in 2012.
(SMM). This starts with extraction of natural resources and material processing through product designand manufacturing then the product use stage followed by collection/processing and final end of life(disposal). By examining how materials are used throughout their life cycle, an SMM approach seeks touse materials in the most productive way with an emphasis on using less; reducing toxic chemicals andenvironmental impacts throughout the material’s life cycle; and assuring we have sufficient resourcesto meet today’s needs and those of the future. Data on municipal solid waste generation, recycling anddisposal is an important starting point for the full SMM approach.ResourcesThe data summarized in this fact sheet characterizes the MSW stream as a whole by using a materialsflow methodology that relies on a mass balance approach. For example, to determine the amounts ofpaper recycled, information is gathered on the amounts processed by paper mills and made into newpaper on a national basis plus recycled paper exported, instead of counting paper collected for recyclingon a state-by-state basis. Using data gathered from industry associations, businesses, and governmentsources, such as the U.S. Department of Commerce and the U.S. Census Bureau, we estimate tonsof materials and products gener ated, recycled, and discarded. Other sources of data, such as wastecharacterizations and research reports performed by governments, industry, or the press, supplementthese data.The benefits of recycling and composting, such as elimination of GHG emissions, are calculated usingEPA’s WARM methodology. WARM calculates and totals GHG emissions of baseline and alternativewaste management practices including source reduction, recycling, composting, combustion, andlandfilling. The model calculates emissions in metric tons of carbon equivalent (MTCE), metric tons ofcarbon dioxide equivalent (MTCO2E), and energy units (million Btu) across a wide range of materialtypes commonly found in MSW. EPA developed GHG emissions reduction factors through a life-cycleassessment methodology. Please see: www.epa.gov/warm.Full data tables on MSW characterization that support this Report and Summaries of the MSWcharacterization methodology and WARM are available on the EPA website along with information aboutwaste reduction and recycling. Please mwww.epa.gov/recycle13
United States Environmental Protection AgencySolid Waste and Emergency Response (5306P)Washington, DC 20460Official BusinessPenalty for Private Use 300EPA-530-F-14-001February 2014www.epa.gov/wastes
MSW generated in 1980 to over 34 percent in 2012. Disposal of waste to a landfill has decreased from 89 percent of the amount generated in 1980 to under 54 percent of MSW in 2012. Figure 2. MSW Recycling Rates, 1960 to 2012 Pe rc ent of gener at io n re cycl ed To ta l MS W re cyc li ng (m illio n t ons) Total MSW recycling Percent recycling 5 .