Transcription
2022 QUALITY, COSTEFFICIENCY, ANDCIGNA CAREDESIGNATIONMETHODOLOGYFor Health Care ProvidersAugust 2021
Table of contentsIntroduction. 3Cigna quality and cost-efficiency display principles . 3Specialty types assessed for quality and cost-efficiency displays. 4Quality evaluation and displays. 5Evidence-based medicine (EBM) assessment process . 6Credit for utilizing Cigna Centers of Excellence. 9Cost-efficiency evaluation and displays. 92022 Outlier methodology. 12Cigna Care Designation inclusion methodology . 12Alternative pathways to achieve Cigna Care Designation. 132022 Provider evaluation methodology changes . 15Additional information and data limitations . 16Specific market activities . 17Feedback process. 17Provider reconsideration request process . 18How to register complaints . 19Appendices. 20Appendix 1: 2022 Quality, Cost and Cigna Care Designation market information,including Tier 1 Providers . 20Appendix 2: 2022 EBM rules used for provider evaluation. 22Appendix 3: Colorado provider appeal process . 33Page 2 of 34PCOMM-2021-601. 2021 Cigna. Some content provided under license.
IntroductionMany of our customers want to know more about provider quality and cost-efficiency. To help provide Cignacustomers with relevant information to make their own health care decisions, we evaluate provider quality andcost-efficiency information at the specialty level by using a methodology consistent with national standards andincorporating provider feedback on contracted providers. In addition, groups who meet Cigna’s specific qualityand cost-efficiency criteria can receive the Cigna Care Designation (CCD), which denotes a higher performingprovider, based on the criteria outlined in this document. CCD may also be utilized as part of a tiered benefitplan option.This whitepaper explains the methodology used to measure the quality and cost-efficiency results of individualproviders at the specialty level and how the criteria are met for a group to achieve CCD, as well as providedetails regarding the profile information used on the provider directory displays.Cigna quality and cost-efficiency display principlesWe follow three key principles when providing our quality and cost-efficiency information to customers,employers, and providers:1. Standardized performance measures using the most comprehensive data set available. We usenationally recognized measures from those endorsed by the National Quality Forum (NQF), NationalCommittee for Quality Assurance (NCQA), Healthcare Effectiveness Data Information Set (HEDIS 1),or developed by national provider organizations.2. Responsible use of the information. The profiles only reflect a partial assessment of quality and costefficiency based on our claims data, and should not be the sole basis for decision-making as suchmeasures have a risk of error. Our customers are encouraged to consider all relevant factors and toconsult their treating provider when selecting a provider for care. In general, Cigna-participatingproviders are independent practitioners; they are not employees or agents of Cigna. Treatmentdecisions are made exclusively by the treating provider and their patient. We provide our customers withhelpful information to allow them to make informed decisions. The quality and cost-efficiency markersused in evaluating providers for Cigna Care Designation are intended for that purpose only. We do notguarantee the quality or cost efficiency of the actual services provided by contracted providers, eventhose that qualify for CCD.3. Collaboration and improvement enablement. We are committed to providing information and solutionsthat can help support access to quality health care. A detailed description of our methodology, informationabout the summary metrics, and ongoing data to help improve performance is available to providers andprovider groups. We also continue to have ongoing discussions with key provider organizations, rangingfrom national associations to large provider groups, which provide input for future design changes.The methodology for determining the quality and cost-efficiency displays is subject to change as tools andindustry standards evolve, and provider feedback is obtained and periodically updated. We used claims paiddata with dates of services from January 1, 2018 through December 31, 2019 for the review period to assess for2022 quality and cost-efficiency profiles and directory displays. This review includes claims data from Cignaadministered Managed Care and PPO plans, and excludes government and capitated plans.1HEDIS is a registered trademark of the National Committee for Quality Assurance (NCQA).Page 3 of 34PCOMM-2021-601. 2021 Cigna. Some content provided under license.
External certificationCigna earned the NCQA Physician and Hospital Quality (PHQ) Certification for the seventh time in June2021. The PHQ certification program evaluates how well health plans measure and report the quality andcost of physicians and hospitals. NCQA Quality Certification Standards meet New York state requirementsimplemented in November 2007 concerning physician performance measurement, reporting, and tieringprograms.Specialty types assessed for quality and cost-efficiency displaysListed below are the 21 provider specialty types that are reviewed. These specialty types account for morethan 85 percent of primary and specialty healthcare spending based on Cigna claims data. A provider can onlybe assigned one specialty, tax identification number (TIN), and geographical market for quality and costefficiency displays. The provider’s primary specialty, as determined by Cigna, is used to establish the specialtyto evaluate providers with multiple specialties.Assessed specialty typesAllergy and immunologyDermatologyFamily practiceHematology and ar, nose, and throat (ENT)GastroenterologyInternal medicineNeurosurgeryOrthopedic surgeryRheumatologyCardio-thoracic surgeryEndocrinologyGeneral surgeryNephrologyObstetrics and gynecologyPediatricsUrologyNote: While Cigna Care Designation is determined at the aggregated group level, we determine cost andquality performance metrics by reviewable specialty type for groups comprised of more than one specialty type.Market availabilityOur Network Contracting and Market Medical Executive teams defined the 2022 geographical markets in whichCCD is recognized. The zip code of a provider’s primary office address is used to align a provider with a givenmarket. The provider’s primary specialty and geographic market is then used to determine the provider peergroup for comparison of quality and cost-efficiency results.Please see Appendix 1 for a list of markets, and the volume and percent of providers reviewed in eachmarket, which are CCD providers effective January 1, 2022.Page 4 of 34PCOMM-2021-601. 2021 Cigna. Some content provided under license.
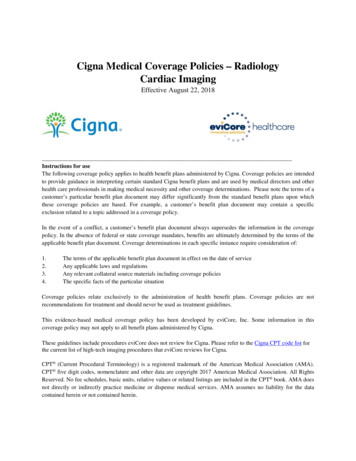
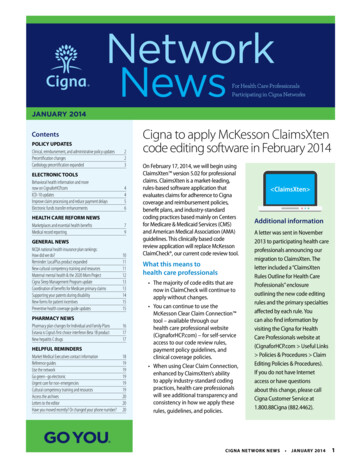
Sample: Online Health Care Professional Directory display (myCigna.com)Quality, cost efficiency andCigna Care Designation displaysQuality evaluation and displaysProviders are evaluated on a number of criteria that we believe are markers of practice quality.Information relative to specific quality criteria met by a provider is displayed in the online providerdirectory on both the public website (Cigna.com) and secure customer website (myCigna.com). Weuse four quality indicators to review participating providers in the 21 specialty types. Each providerqualifying for a specific quality indicator is identified in our online health care professional directory.1. Group board certificationGroup board certification is measured based on certification data obtained from the AmericanBoard of Medical Specialties (ABMS) and the American Osteopathic Association (AOA), consistentwith our Practitioner Credentialing and Recredentialing Policy. Board certifications criteria helpdetermine whether board-certified physicians in the group predominantly provide patient care toCigna customers. This standard is met if: Either 80 percent of physicians within a group are board certified and provide 50 percent of theepisodes of care, or at least 80 percent of the episodes of care is provided by board-certifiedphysicians, or For practices (groups) with four or fewer physicians, either 65 percent of physicians within agroup are board certified and provide 50 percent of the episodes of care, or at least 65 percentof the episodes of care is provided by board-certified physicians2. Adherence to evidence-based medicine rulesThe quality of provider care is evaluated using a claims-based assessment for 112 EvidenceBased Medicine (EBM) rules derived from measures endorsed by the NQF, HealthcareEffectiveness Data Information Set (HEDIS), or developed by provider organizations. These rulesspan 45 diseases and preventive cares conditions (see Appendix 3), and are potentially applicableto the care provided by providers in 15 specialty types. For a list of the specialty types that arecovered by EBM rules, please see the chart on page six.Page 5 of 34PCOMM-2021-601. 2021 Cigna. Some content provided under license.
3. National Committee for Quality Assurance (NCQA) Physician RecognitionNCQA Physician Recognition Programs assess clinicians and practices to ensure they supportthe delivery of high-quality care, and provide medical services that adhere to evidence-based,nationally recognized clinical standards of care. We identify physicians in our online providerdirectory who have received recognition in any of these four NCQA Physician RecognitionPrograms:NCQA Diabetes Recognition Program (DRP)NCQA Heart/Stroke Recognition Program (HSRP)NCQA Patient-Centered Medical Home Recognition (PCMH - 2 versions)NCQA Patient Centered Specialty Practice Recognition (PCSP)Additional information about these programs is available on the NCQA website (NCQA.org Programs Recognition).4. Quality Oncology Practice Initiative Certification ProgramThe Quality Oncology Practice Initiative (QOPI ) Certification Program provides a three-yearcertification recognizing high-quality care for outpatient hematology-oncology practices within theUnited States (ASCO Practice Central, 2021). The QOPI Certification Program builds upon thesuccess of the American Society of Clinical Oncology’s (ASCO) Quality Oncology Practice Initiative.We identify physicians in our online provider directory who have received this certification.Additional information about this program is available on the ASCO Practice Central website atQOPI Certification Program.Evidence-based medicine (EBM) assessment processThe EBM rules used in the 2022 evaluation apply to 15 primary care and non-primary carespecialty types. Currently there are no EBM rules that apply to dermatology. In 2017, the EBMassessment process for gastroenterology, general surgery, neurosurgery, ophthalmology, andorthopedic surgery was removed because fewer than two percent of groups with thesespecialty types had sufficient volume to assess.Overall, approximately 12.6 percent of providers in all assessed specialty types are associated withgroups that do not have sufficient volume to assess adherence to the EBM rules. However, they havesufficient volume to assess cost efficiency. Similarly, 13,460 or 1.98 percent of providers areassociated with groups that do not have sufficient volume to assess cost efficiency and, as a result,are assessed based on adherence with the EBM rules alone.Specialty types covered by EBM rulesAllergy and immunologyEndocrinologyInternal medicineObstetrics and gynecology (OB/GYN)CardiologyFamily practiceNephrologyOtolaryngology (ENT)Cardiothoracic surgeryHematology and ologyPage 6 of 34PCOMM-2021-601. 2021 Cigna. Some content provided under license.
The 2022 EBM assessment component review includes measuring compliance with 112 EBM rulesobtained from Optum EBM Connect software, version 9.5, where applicable, for the medicalconditions displayed in Appendix 3.Definitions used in the following methodology description:1. Provider specialty type: Any one of the 21 specialty types listed in the table of assessedspecialty types found on page four.2. Group specialty type: Any one of the 21 specialty types listed in the table of assessedspecialty types found on page four. The provider group that is evaluated may includeproviders with the same specialty, or the provider group may be evaluated using one of thefollowing mixed-specialty group designations, as applicable: multispecialty medical group(mixture of multiple non-PCP specialists), mixed specialty medical group (mixture of PCPsand non-PCP specialists), primary care medical group (mixture of PCP specialists)3. Specialty category: Primary care specialties (family practice, internal medicine, andpediatrics), or non-primary care specialties (the 18 other specialties assessed for CCD)We determine the extent to which an individual provider or provider group complies with EBM rulesaccording to the following conventions:Peer or market EBM rule adherence for each geographic market In order for an EBM rule to be included for review at the geographic market level for a provider orprovider group, there must be at least 20 opportunities for the rule within the specialty category(primary care or non-primary care specialty types) and market for the most recent two-year datareview period. For 2022 displays, that period is January 1, 2018 through December 31, 2019. The average adherence rate for each EBM rule is calculated for the provider specialtycategory (primary care or non-primary care specialty types) for each geographic market toderive the peer market-average result.Individual provider or group practice EBM rule adherence Opportunities and successes for each eligible EBM rule are aligned to the appropriate individualprovider (using the visit requirements outlined below and relevant specialty type categorymatch).Visit requirements: A provider is considered responsible for adherence to the EBM rule if thefollowing conditions are met: The EBM rule is relevant to the provider’s specialty (see Appendix 3). For example, the cervicalcancer screening EBM rule is relevant to OB/GYN, family practice, and internal medicine, but it isnot relevant to other specialty types. There have been at least two office visit encounters for a patient with Cigna coverage during theclaim review period. At least one of the office visit encounters occurred in the last 12 months of the claim reviewperiod.Page 7 of 34PCOMM-2021-601. 2021 Cigna. Some content provided under license.
Note: 41 of our EBM measures require only one office visit encounter in the last 12 months of theclaim review period. These measures are identified by an asterisk [*] in Appendix 3. Individual providers are aligned to medical groups (practices), and EBM rule opportunities,successes, and expected successes are then summed to obtain totals. Providerperformance is aggregated to the specialty level within a group for quality displays and atthe group level to determine CCD. A Quality Index for the medical group is calculated by dividing the provider’s or providergroup’s number of actual EBM rule adherence successes by their number of expected EBMrule-adherence successes. Expected EBM rule-adherence successes are derived by applyingthe geographic market-average EBM rule adherence-success rates to that provider group’sparticular mix of rule opportunities. EBM (clinical quality) measures are not risk adjusted because the EBM rules have explicitdefinitions for both the numerator and the denominator of each measure. The denominatorexplicitly defines the population that is at risk; thus, risk adjustment is incorporated into thedefinition of the measure. A 90 percent confidence interval around the Quality Index is determined, allowing EBM qualityperformance to be measured with a strong degree of certainty. The lower bound of the 90percent confidence interval for a particular provider or provider group is defined as theAdjusted Quality Index for that provider group. Provider groups must have 30 or more total EBM rule- adherence opportunities. Inaddition, at least 50 percent of their treatment episodes of care (used in the provider’s orgroup’s cost-efficiency (Episode Treatment Groups or ETG ) analysis) are attributed tothe provider specialty types that are assessed for EBM rule adherence, and are rankedusing the Adjusted Quality Index score. Provider groups with an Adjusted Quality Index score in the top 34 percent of their medicalgroup specialty type and geographic market are placed in the highest performance categoryfor EBM rule adherence. This score is utilized at the group level in achieving the qualitycomponent of CCD. Provider groups that have results in approximately the bottom 2.5percent for the medical group specialty types in the market where there are at least 20medical groups of that medical group specialty type in the market are placed in the bottomcategory; there will be no cost-efficiency display for these individuals. The remainder is in themiddle category. Specialties within each group are assessed in a similar manner to determine the EvidenceBased Medicine score at the specialty level. Specialty level scoring will drive directorydisplays at the provider/specialty level, i.e., “Evidence Based Medicine Standards” languagewill display on the directory for those providers in the top 34 percent for their specialty.Page 8 of 34PCOMM-2021-601. 2021 Cigna. Some content provided under license.
Credit for utilizing Cigna Centers of ExcellenceWe evaluate hospital-stay outcomes and cost-efficiency information for Cigna customers through theCigna Centers of Excellence (COE) program for all practices. Utilization of COEs by a reviewablephysician practice provides credit towards the quality component of CCD. If a practice has at leastone COE admission and a minimum Quality Index of 0.70 during the data analysis period, then a fivepercentage-point increase in the Quality Index will be granted. The increased Quality Index is thenused to determine eligibility for CCD. COE admissions must be consistent with the specialty of thephysician providing the COE-related care in order to qualify.Cost-efficiency evaluation and displaysParticipating providers and provider groups are evaluated for their cost efficiency using an industrystandard methodology (ETG ) that determines the average cost of treating an episode of care for avariety of medical conditions and surgical procedures. The episode costs are compared to otherproviders and provider groups of the same specialty in the same geographical market. The results ofthis evaluation are displayed by using stars ( ) in our online provider directory and myCigna.com,the secure website for Cigna customers.Three stars for cost efficiency represent the top 34 percent of providers or provider groups whencompared to other providers and provider groups of like specialty type within the geographic market.Two stars represent providers or provider groups in the middle 33 percent for cost efficiency.Provider groups that are in the bottom 33 percent for cost efficiency receive one star.Providers that do not meet the volume criteria for the cost-efficiency assessment will have amessage next to their name in the provider directory indicating that there was not enough Cignaclaim volume to assess their cost efficiency. Rankings are based on weighted percentile of totalmedical spend by market to account for variation in group size.Cost-efficiency symbolsResults in the top 34 percent for cost efficiencyResults in the middle 33 percent for cost efficiencyResults in the bottom 33 percent for cost efficiencyPlease see Appendix 1 for the geographical markets and volume of providers reviewed for qualityand cost- efficiency displays beginning January 1, 2022.We use ETG methodology, an industry standard available through Optum, to evaluate the costefficiency of individual providers and medical groups. The methodology incorporates case-mixand severity adjustment, and claims are clustered into more than 500 different episodes of care.Additional information about the OptumInsight Episode Treatment Groups is available in theSymmetry Episode Treatment Groups whitepaper on the Optum website (www.optum.com).Optum ETG software version 8.3 is used for the assessment.Using the ETG methodology, we can determine how a provider’s cost-efficiency compares to otherproviders in the same geographic market. The provider’s cost-efficiency performance is compared tothe performance of same-specialty providers in the same market for the same ETG. A provider orprovider group’s aggregated performance is influenced by its fee schedule, utilization patterns andreferral patterns (e.g., use of hospitals and other facilities).Page 9 of 34PCOMM-2021-601. 2021 Cigna. Some content provided under license.
ETG assessment requirements Cigna uses ETG ‘full number’ descriptions, inclusive of treatment approach and/or presenceof comorbid conditions or complications where they apply, to accurately compare like clinicalscenarios. There must be at least 10 occurrences of a specific ETG (e.g., incorporatingepisode severity and treatment level, co-morbidity, complications, or the presence ofpharmacy benefits) within the geographic market and specific provider specialty type in orderto determine the market average cost for that ETG to include it in the market’s analysis. The peer or market average for each specific ETG meeting the minimum tally above isestablished for each market and provider specialty type. Provider performance isaggregated to the specialty level within a group for cost displays and at the group level toachieve CCD. To reduce variation within cost-efficiency results, several ETG s are excluded from theassessment process, including routine immunizations and other inoculations, transplants, andETG s with low volume or wide cost variation. Episodes with a severity level of four (thehighest severity level assigned by the OptumInsight ETG software) are also excluded fromanalysis, for most conditions.Example: For the Nashville market during the data analysis period, 15 occurrences ofETG XX (with the same severity, treatment level, co-morbidity, complications, andpresence of pharmacy benefits) are attributed to family physicians. The average cost ofETG XX for family physicians in the Nashville market is established by computing thenumerical average of the cost of all 15 occurrences of this ETG subject to the applicationof outlier identification methodology outlined in the following section. This process isreplicated for each ETG with at least 10 occurrences in the Nashville market for a givenprovider specialty type in order to determine the market cost average for each ETG thatis eligible for evaluation in the market.ETG assessment process Individual provider groups must have at least 30 total episodes of care in aggregate and at theindividual specialty level during the review period in order to be assessed for cost efficiency. Inorder for an episode to be attributed to a provider group, two criteria must be met:1. The practice must be responsible for more costs for medical or surgical managementservices than any other provider group providing care for the episode.2. The medical or surgical management costs for the practice must be at least 30 percent ofthe total episode medical or surgical management costs.If these two criteria are not met, the episode is excluded from analysis. While only the costsassociated with practices’ provision of management services are used to attribute the episode to aparticular provider, total costs (provider management costs all ancillary costs (e.g., lab, X-ray,hospital, ambulatory surgery, and physical therapy) are used to characterize the total cost of theepisode.Page 10 of 34PCOMM-2021-601. 2021 Cigna. Some content provided under license.
The actual cost of an episode of care for each provider group and for the providers withinthat group is compared to the market average cost of an episode of care, which is derivedusing their unique mix of ETG s and the peer averages. The sum of all actual ETG costs for a medical group divided by the sum of all correspondingETG market-average costs is the provider group’s Performance Index.Example: The ABC Provider Group consisting of three family physicians in the Nashvillemarket has five episodes of care belonging to two unique ETG s (ETG 1 and ETG 2)that are attributable to the group. For simplicity, disregard the requirement that theprovider or provider group must have a minimum of 30 attributable episodes in order tobe reviewed for cost efficiency. Average episode costs for ETG 1 and ETG 2 have beenestablished for all other primary care providers practicing in the Nashville market. Threeepisodes of ETG 1 are attributable to the ABC Provider Group and two episodes ofETG 2 are attributable to the ABC Provider Group.In the table below, the provider group’s cost per episode is displayed for each of the threeoccurrences of ETG 1 and for each of the two occurrences of ETG 2, along with the market averagecost for an episode for ETG 1 and ETG 2 for all family physicians in the Nashville market.ETG 1ETG 1ETG 1ETG 2ETG 2AverageActual episode cost2,0001,0004,00015,00018,0008,000Market average cost3,5003,5003,50019,00019,0009,700Performance Index 8,000/9,700 0.825Dividing the average cost of all episodes of care attributable to the provider group by the average ofall market-average episode costs for the ETG s on which the provider group’s cost-efficiencyperformance is being evaluated yields a Performance Index (PI) of 0.825. The PI for the providergroup can be interpreted as Medical Group ABC is 17.5 percent more cost efficient than other familymedicine physician groups in the Nashville market. A 90 percent confidence interval around the PI is used to determine a range ofperformance within which the medical group’s true performance would fall with a highlevel of confidence. The upper bound of the confidence interval is defined as theAdjusted Performance Index and is used to compare cost-efficiency performance amongprovider medical groups. The upper bound of the 90 percent confidence interval is usedto ensure that the provider group’s performance is at least as good as, or better than theupper bound threshold. Using a weighted percentile groups are then ranked by their Adjusted PerformanceIndex within their geographic area. Those groups ranking in the top 34 percent achieve 3Page 11 of 34PCOMM-2021-601. 2021 Cigna. Some content provided under license.
stars for efficiency and this score is utilized at the group level in achieving the costcomponent of CCD evaluation. Specialties within each group are assessed in a similar manner to determine the CostEfficiency score at the specialty level, specialty level scoring will drive directory displaysat the provider/specialty level, an, 3 cost stars will display on the directory for thoseproviders in the top 34 percent for their specialty, two stars for those falling between 34%and 66 percent and 1 star for those in the bottom 34 percent.2022 Outlier methodologyIn order to portray providers’ cost-efficiency performance in the most accurate manner, the costefficiency evaluation includes a methodology to account for outlier episodes. Outlier episodes aresubstantially different from the market expected amounts. High cost episodes (ETG s) areidentified by interquartile (IQ) variances by market and specialty averages; outlier episode costsare reduced to the IQ value used to calculate cost-efficiency before peer comparison is performed.Similarly, low cost outlier episodes are determined by the Optum software, or are episodes of lessthan 25 and are excluded from the evaluation.Level of evaluation (unit of analysis)While we review participating providers at the individual level, the Cigna Care Designation isconferred at the provider group or practice, or group TIN, level. Individual providers who are not partof a group are assessed if volume criteria are met. This approach provides robust data forevaluation and is consistent with the assumption that: Patients with Cigna coverage often chose a group rather than a specific provider within thegroup, and; Patients with Cigna coverage who initially choose a specific provider frequently receivecare by another provider
External certification. Cigna earned the NCQA Physician and Hospital Quality (PHQ) Certification for the seventh time in June 2021. The PHQ certification program evaluates how well heal th plans measure and report the quality and cost of physicians and hospitals. NCQA Quality Certification Standards meet New York state requirements

![Pageflex Server [document: DP0544964 00001] - Progressive](/img/34/2022-dental-plan-side-by-side-comparison.jpg)