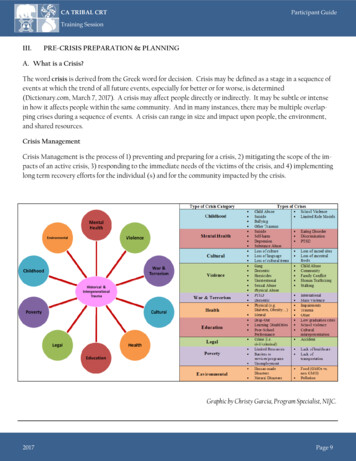
Transcription
11Communityin Crisis:A Look at How U.S. CharitableActions and Civic EngagementChange in Times of CrisesMay 2020
11Key FindingsThere are very few historical precedents that can helpus understand how the COVID-19 (novel coronavirus)pandemic might change charitable and civic life inAmerica in the coming months and years. In this report,we examine three recent crises: the attacks of September11, 2001, Hurricane Katrina (2005), and the GreatRecession of 2007-2009.In all three cases, charitable behaviors – volunteeringwith an organization, giving to charity, working withneighbors to fix or improve something in the community,and attending public meetings where community issueswere discussed – rose in the years after the crisis, evenin the areas most heavily affected.The Great Recession During the Great Recession, participation rates for allfour civic activities we explored – volunteering, givingto charity, attending public meetings, and working withneighbors – changed significantly at the national level.All four rates increased significantly in either 2008(attending public meetings and working withneighbors) or in 2009 (volunteering and giving),during the heart of the Great Recession.New York City Over 15 years of U.S. data collection, the percentageof adults who volunteered through or for organizationsreached their highest levels nationally, and in the NewYork City metropolitan area, in the years directly after9/11 (2003-2005).Volunteer rates from 2006 to 2015have never been as high as the rates from the earlypost-9/11 years, either nationally or in metro NYC.New Orleans The volunteer rate in the New Orleans metroarea similarly reached a sustained peak in theyears following Hurricane Katrina. At the sametime, more than 166,000 long-distance volunteersfrom other states also traveled to Louisiana tovolunteer there in 2007. These long-distancevolunteers appreciably increased the size ofLouisiana’s volunteer workforce during therecovery: counting both area residents andvisiting out-of-state volunteers, the new longdistance volunteers comprised about 19 percentof the “total” number of volunteers in the state. Metro New Orleans also exhibited a surge ininformal charitable behavior (working with yourneighbors to fix or improve something) and civicbehavior (attending public meetings) in the yearsafter Katrina. Participation rates peaked for theseactivities even through the Great Recession, andstayed at high levels in the early 2010s.Nonetheless, participation rates for all four charitable andcivic activities declined significantly in the years followingthe Great Recession, both nationally and in New Orleansand New York City where the rates surged in theaftermath of crises.We have already seen anecdotal reporting of a surge incharitable behaviors in response to COVID-19 despitethe need for social distancing.The recent history of past crises suggest that a charitablesurge could be quite significant but requires our attentionnow and in the coming months if we hope to sustain thisinflux of good deeds and community engagement. Theincredible challenges of our current pandemic will likelyspark both a greater need from the community and agreater desire for generosity among individuals for sometime. The challenge in the immediate post-pandemic erawill be to maintain – or grow – any surge in charitableand civic activity that we are fortunate enough toexperience.Preferred Citation:Dietz, Nathan, and Grimm, Robert T., Jr. 2020. “Communityin Crisis: A Look at How U.S. Charitable Actions and CivicEngagement Change in Times of Crises." Research Brief:Do Good Institute, University of Maryland.
21Introduction: Civic Responses to National CrisesFor the past several months, the world has struggledwith the pandemic caused by the outbreak of novelcoronavirus (COVID-19). The full scale of theeconomic and social impacts of the pandemic arenot yet well understood, and the forecasts for theUnited States and other countries change on adaily basis.The massive threat to public health has alreadydisrupted most aspects of daily life in the U.S.,including the ability of nonprofit organizations toprovide needed services to communities, often withthe help of volunteers.1 The effects of this pandemichave already been compared to the most destructiveevents in recent American history: the terrorist attacksof September 11, 2001; Hurricane Katrina, whichdevastated the New Orleans region in 2005; and theGreat Recession, the prolonged economic downturnthat lasted from 2007 to 2009. Nobody knows howthe crisis will ultimately impact the nonprofit sectoror charitable behaviors in America, let alone the restof economic and social life.In this brief, we examine trend data on volunteeringand civic engagement from the Current PopulationSurvey Supplement on Volunteering (CPS VolunteerSupplement), which was administered by the USCensus Bureau and Bureau of Labor Statisticseach September between 2002 and 2015. The CPSVolunteer Supplement contained consistently wordedsurvey questions about volunteering through orfor an organization that allow us to examine trendsin volunteering from 2002 through 2015. In 2006,questions about two informal civic activities (workingwith neighbors to fix or improve something in thecommunity, and attending a public meeting wherecommunity issues were discussed) were added to thesurvey. In 2008, a question about giving to charitywas added.The CPS Volunteer Supplement data enable us tomeasure participation during the post-9/11 era; theperiod during 2 and following Hurricane Katrina;and the period before, during and after the GreatRecession. The data allow us to focus on two areasthat were especially affected by these events: NewYork City, which is the place that forever will beassociated with the September 11 attacks, and NewOrleans, which bore the brunt of Hurricane Katrina.By comparing trends in volunteering and civicengagement in these areas with national trends,we can gain an understanding of how Americansrespond to local and national crises.1See Laura Reiley, “Food banks are seeing volunteers disappear and supplies evaporate as coronavirus fears mount,” Washington Post, March 16, 2020 supply-evaporate-coronavirus-fears-mount/); and Jessica Contrera and IanShapira, “Volunteering and coronavirus: When helping people could mean putting them at risk,” Washington Post, March 17, 2020 313-df458622c2cc story.html).2Because the September 2005 CPS Supplement was conducted only after Hurricane Katrina, very few households in the New Orleans metropolitan area were surveyed.The CPS collected data from sampled households in other areas of the country, but detailed data on charitable and civic activities in New Orleans during, and immediatelyafter, Katrina are not available.
31In September 2002, the CPS Volunteer Supplementwas conducted for the first time since 1989, andasked respondents to describe the volunteer workthey had performed since September 1, 2001. The2002 CPS Supplement revealed that 27.4 percent ofadults nationwide3 volunteered with an organizationduring the immediate post-9/11 period. In 2003,the following year, the volunteer rate rose to 28.8percent, the highest rate ever recorded nationally in15 years of measurement, and stayed there for thenext three years. After the sustained post-9/11 peakin the volunteer rate, the national volunteer ratesuffered its first large and statistically significantdecline in 2006, falling by more than two percentagepoints to 26.7 percent. If not for this decrease in thevolunteer rate, almost 5 million adults would havevolunteered in 2006.At the national level, participation rates forvolunteering and other forms of civic engagementactually rose during the Great Recession, but therates generally remained remarkably stable duringthis time period. Between 2006 and 2012 – a periodthat included the recession and the years immediatelybefore and afterward – the national adult volunteerrate never rose above 27 percent or below 26 percent,although statistically significant year-to-year changeswere occasionally observed. However, despite theoverall stability in volunteering, the participation ratesfor all four civic activities – volunteering, giving tocharity, attending public meetings, and working withneighbors – did change significantly during this timeperiod.4 All four rates increased significantly in either2008 (attending public meetings and working withneighbors) or in 2009 (volunteering and giving),during the heart of the recession.After the recession, each of the four rates declinedsignificantly at least twice between 2010 and 2015.For three of the indicators – volunteering, attendingpublic meetings, and working with neighbors – thenational participation rate decreased by a statisticallysignificant amount in 2013, but the year-to-yearchanges after that were not statistically significant.The national volunteer rate continued to slide in2014 and 2015, bottoming out at a fifteen-year lowof 24.9 percent in 2015. The 2013 decline in thenational giving rate was also statistically significant,and was followed by a significant decline in 2015 thatlowered the giving rate below 50 percent for the firsttime since 2009. These results, which are consistentwith trends that have been noted by others,5 suggestthat the United States had experienced all-time lowsin volunteering and giving even before the currentpandemic hit.3We report statistics for the 16-and-over population, even though the CPS collects data from respondents who are 15 years old, to follow the convention of the Bureauof Labor Statistics (BLS). In the annual brief series Volunteering in the United States (available at https://www.bls.gov/bls/news-release/#VOLUN), BLS defines adultvolunteers as people ages sixteen or older who did work through an organization in the previous twelve months for which they were not paid. BLS imposes a minimumage of 16 because, in most states, residents must be 16 to work for pay without their parents’ permission.4For more details about the measurement of volunteering, giving and civic engagement and about the estimation of confidence intervals around participation rates, pleasesee the Appendix in Grimm, Robert T., Jr., and Dietz, Nathan. 2018. “Where Are America’s Volunteers? A Look at America’s Widespread Decline in Volunteering in Citiesand States.” Research Brief: Do Good Institute, University of Maryland. Available at /Where%20Are%20Americas%20Volunteers Research%20Brief%20 Nov%202018.pdf.5Osili, Una, and Sasha Zarins (2018). “Fewer Americans are giving money to charity but total donations are at record levels anyway.” The Conversation, July 3. Available -record-levels-anyway-98291.
41Case Studies:New York City after 9/11, and New Orleans after Hurricane KatrinaTo study the impact of recent crises that are mostsimilar to our current situation, we focus on trendsin civic engagement in metropolitan New York Cityand metropolitan New Orleans – the two cities mostclosely associated respectively with the terrorist attacksof September 11, 2001 and Hurricane Katrina, whichreached New Orleans in August 2005. The CPSVolunteer Supplement allows us to calculate statisticson volunteering and other civic activities for all statesand regions of the country, as well as over 200 majormetropolitan areas (metro areas, or MSAs).6 Withinthe U.S., civic and charitable trends vary widely acrossstates and metropolitan areas. Before presenting thesespecific trends for the New York City and New Orleansmetro areas (in Figures 1 through 4) we discuss someof the characteristic features of these areas thatinfluence participation rates for volunteeringand other civic activities.The New York City metropolitan area covers partsof four states (New York, New Jersey, Connecticutand Pennsylvania), but September 11, 2001 will alwaysbe associated with downtown Manhattan and theWorld Trade Center. Metropolitan New York Cityhas several characteristics that are associated withhigh volunteer rates, as well as several others thatare negatively associated with volunteering. Thesecharacteristics – including unemployment rates,educational attainment, income, and more (whichhave been featured in earlier work7) can be foundin the Appendix.Among the 215 metropolitan areas with sufficientdata on volunteering, the NYC metro area ranks17th in median income and 27th in the percent ofresidents with college degrees – two factors that areassociated with higher socioeconomic status, whichin turn is positively associated with volunteering.However, the area also ranks first overall in the percentof residents who live in multi-unit housing, whichis correlated with weaker social ties and greateranonymity among community residents. And, NYCranks first in average commuting time to work,which increases the costs of volunteering by placingtime constraints on residents. Another challenge forgenerating volunteers in the city is its relatively lownumber (controlling for population size) of smallnonprofit organizations, the organizations that aremost likely to use, and rely heavily on, volunteers.The New York City MSA has 1.89 small nonprofitsper 1,000 residents, and ranked 178th among the 215metropolitan areas.As with the New York City metropolitan area,metropolitan New Orleans experienced a traumaticevent – in this case, Hurricane Katrina, which toucheddown in late summer 2005.Volunteer and civic statisticscalculated from the CPS are usually based on the surveyresponses from the sample of selected households.However, many Americans traveled from other partsof the country to the Gulf States to assist with postKatrina cleanup. These out-of-state, or “long distance,”volunteers added a significant boost to the capacityof the volunteer workforce in the affected areas. Ifthe “total” number of volunteers includes both arearesidents and those who travel to the area to volunteer,in 2007, the 166,000 long-distance volunteers fromother states made up about 19 percent of the “total”number of Americans who volunteered in Louisiana.8In the years following Hurricane Katrina, metroNew Orleans came together and rebuilt and restoredmuch of what was lost throughout its communities.However, the area has historically had a below-averagevolunteer rate – in part because many of the area’sdemographic and socioeconomic characteristics areassociated with lower volunteer rates. A relatively largenumber of metro New Orleans residents have incomebelow the poverty level (18.6 percent in 2014, ranking44th among all 215 U.S. MSAs with available data) orlack a high school education (86.3 percent have highschool diplomas or the equivalent, ranking 156th).Small nonprofit organizations are somewhat moreprevalent in metro New Orleans (2.25 small nonprofitsper 1,000 residents) than they are in metro New YorkCity, but the New Orleans metro area ranks only 124thamong all reporting MSAs.6In general, only some central cities and counties are identifiable in the public-use CPS data. For instance, during the 2004-2013 period, any households located inOrleans Parish are not identifiable in the CPS sample for the New Orleans-Metairie-Kenner metropolitan area.7See “Where Are America’s Volunteers?” (cited above) for details about the measurement of these characteristics and interpretation of these relationships.8Long-Distance Volunteering in the United States, 2007. July 2008. Research brief, Corporation for National and Community Service, Washington, DC. Available at s/upload/Long-Distance Volunteering.pdf.
51Trends in Civic Participation: New Orleans, New York City, and the U.S.Figure 1: Volunteer Rates – New Orleans, New York City, and the U.S.Volunteer Rates: New Orleans, New York, U.S.30%25%20%15%10%5%0%New OrleansNew YorkU.S.2002 – 20042007 – 20092010 – 20122013 – 6.2%17.4%25.2%Figure 1 shows historical trend data for volunteerrates for the adult population (age 16 and over) forthe New Orleans and New York City metropolitanareas, as well as the national volunteer rates. The figureshows volunteer rates during four points in time, withthree years of data pooled for each time interval toenable more precise estimates. The 2002-2004 periodcorresponds to the post-9/11 surge in volunteeringin New York City and nationally, and reflects thepre-Katrina level of volunteering in metropolitanNew Orleans.9 The 2007-2009 period captures thepost-Katrina surge in volunteering in the NewOrleans MSA, as well as the Great Recession.in New Orleans after Katrina among area residents(not counting the out-of-state volunteers whocame to help with the recovery). The New Orleansmetropolitan area volunteer rate reached an all-timepeak in 2007-2009, as the area rebuilt followingdevastation from the hurricane. The 2007-2009, postKatrina surge in volunteering in metro New Orleanscontinued during the 2010-2012 period. Meanwhile,at the national level, the US volunteer rate never reallyexperienced a lasting rebound from the 2006 decline,staying steady during the recession (2007-2009) andpost-recession (2010-2012) periods despite statisticallysignificant year-to-year changes.The pre- and post-Katrina period (2002-2004;2007-2009, respectively) saw the volunteer rate inmetropolitan New Orleans moving in the oppositedirection from the national rate and the rate inmetropolitan New York City. While both metropolitanareas (NYC and New Orleans) tend to rank near thebottom in volunteering overall across all MSAs, bothexperienced surges around crises. The volunteer ratenationally and in metro New York City reached itshighest point in 2002-2004, demonstrating a surgeof civic activity following September 11.In the New York City metropolitan area, the volunteerrate did bounce back following the recession (20102012), though not quite to the pre-recession, post-9/11level. After that, volunteer rates declined significantlyin many parts of the country. The national volunteerrate decreased significantly in 2013-2015, mainly dueto declines in volunteering in suburban and ruralareas, but also in many larger cities. The volunteer ratedeclined substantially in metropolitan New Orleanstoo, even falling below the pre-Katrina level of 18.7percent;10 it also fell in metro NYC, although neitherchange was statistically significant.While the volunteer rate in metro NYC dippedduring the recession (2007-2009) from its 2002-2004levels – as it also did nationally – it increased sharply9Every ten years, the Census Bureau changes the sample design of the CPS in response to changes in the boundaries of the nation’s metropolitan areas, which are redrawnfollowing the decennial census. Since metro area boundary changes occurred in 2004 and 2014, the data have been adjusted to account for counties that entered andexited the CPS sample for the New York-Northern New Jersey-Long Island, NY-NJ-PA and New Orleans-Metairie-Kenner, LA metropolitan areas.10Because of the annual sample sizes of the households surveyed in the New Orleans metropolitan area, the changes in the volunteer rates depicted in Figure 1 are notstatistically significant. For more details about the measurement of volunteering, giving and civic engagement in states and metropolitan areas, please see the Appendixin Grimm, Robert T., Jr., and Dietz, Nathan. 2018. “Where Are America’s Volunteers? A Look at America’s Widespread Decline in Volunteering in Cities and States.”Research Brief: Do Good Institute, University of Maryland. Available at ef%20 Nov%202018.pdf.
16Two measures of “informal” community activities- working with your neighbors to fix or improvesomething and attending public meetings - wereadded to the CPS Volunteer Supplement in 2006. Ingeneral, Americans are much less likely to take part inthese community activities than they are to volunteer“formally” (i.e., through or for an organization).Figures 2 and 3 contain trend data for these twomeasures for the metro New Orleans, metro NewYork City, and the U.S. While data on these measuresare not available for the immediate post-September11 period, the 2007-2009 timespan covers the GreatRecession, as well as the post-Katrina recovery periodin the New Orleans MSA. In metro New Orleans,the percentage of residents who reported workingwith their neighbors was above the national rate for2007-2009, while the recovery from Katrina washappening simultaneously with the onset of therecession. The working-with-neighbors rate for metroNew Orleans was also significantly higher than thenational rate in 2010-2012.Figure 2: Working with Neighbors Rates – New Orleans, New York, and the U.S.Working with Neighbors Rates: New Orleans, New York City, U.S.16%14%12%10%8%6%4%2%0%New OrleansNew YorkU.S.2007 – 20092010 – 20122013 – 201511.7%4.5%7.9%13.4%6.4%8.3%6.7%6.0%7.6%Figure 3: Attending Public Meeting Rates – New Orleans, New York, and the U.S.Attending Public Meeting Rates: New Orleans, New York City, U.S.16%14%12%10%8%6%4%2%0%New OrleansNew YorkU.S.2007 – 20092010 – 20122013 – 20158.9%6.9%9.3%11.3%7.4%9.1%5.5%6.5%8.2%
71Like the percentage of metro New Orleans residentswho worked with their neighbors to fix or improvesomething in their community, the attendingpublic-meetings rate reached its peak in 2010-2012.However, both rates dropped sharply in 2013-2015 inthe New Orleans MSA; for both measures, the declinefrom 2010-2012 was statistically significant and muchlarger than the decline in the national rate, which wasalso statistically significant for both measures.In contrast to New Orleans, residents of theNew York City MSA were significantly less likelyto engage in both of these activities than Americanadults nationwide. In the New York City metropolitanarea, the trends for both activities were more stable,and more similar to the national trends, than theywere in New Orleans. Following the recession,the rates in the New York City MSA rose for bothactivities during 2010-2012, but only the increase inworking with neighbors was statistically significant.Both rates appeared to decrease slightly in metroNYC between 2010-2012 and 2013-2015, matchingthe national trend, though neither decline wasstatistically significant.Figure 4 shows the percentage of adults in the NewYork and New Orleans metropolitan areas - and theU.S. - who reported making donations of 25 ormore to charitable organizations in the previous year.Because the CPS added this question in September2008, it is not possible to study giving rates beforethe Great Recession, Hurricane Katrina, or theSeptember 11 attacks. However, the trends in thegiving rate can be compared to the volunteeringtrends displayed in Figure 1. In particular, the givingrate declined nationally by a significant amount, andin New Orleans by a large but not significant amount,between the early and mid-2010s.The national giving rate stayed remarkablyconsistent during the 2008-2015 period, althoughthe increase in 2011-2013 was statistically significant,as was the fall back down to 50.0 percent in 20132015. However, the trend lines for New York andNew Orleans look very different from each other,and from the national trend. Although the proportionof New Yorkers who gave to charity has always beenlower than the national rate, the giving rate in metroNYC increased significantly from its lowest levelin 2008-2010 (during the recession) to 2011-2013.Meanwhile, in the New Orleans metropolitan area,the giving rate during the 2008-2010 period wasvery close to the national rate, but by 2013-2015had declined by almost ten percentage points(due to sample size constraints, this change wasnot statistically significant).Figure 4: Giving to Charity Rates – New Orleans, New York, and the U.S.Giving to Charity Rates: New Orleans, New York City, U.S.60%55%50%45%40%35%30%New OrleansNew YorkU.S.2008 – 20102011 – 20132013 – 201549.5%41.4%49.6%47.3%45.2%50.7%40.0%46.5%50.0%
81ConclusionAt the national level, civic engagement in Americacan often be characterized by its continuity. Thepercentage of Americans who volunteer through orfor an organization has consistently been betweenroughly 25 percent and 29 percent since 2001,according to official government statistics collectedby the U.S. Census Bureau and the Bureau of LaborStatistics. Going even farther back, data collected bythe Census Bureau in 1974 and 1989 show that thevolunteer rate changed by less than one-tenth of onepercent between the mid-1970s and the mid-2010s.11Given the size of the U.S. population, even a onepercentage point change in the national volunteer rateis significant: had the 2015 volunteer rate been onepoint higher (25.9 percent instead of 24.9 percent),over 2.5 million more adults would have volunteered.Nonetheless, the Great Recession, which (according tothe official definition)12 started in late 2007 and endedin mid-2009, barely moved the national volunteerrate. Between 2007 and 2010, the national ratenever dropped below 26.2 percent or rose above26.8 percent.Given the dramatic and sudden changes in sociallife, many observers believe the novel coronaviruspandemic is likely to exert a much larger impacton civic engagement in America than any otherevent in recent history. Already, observers are drawingcontrasts with the Great Recession, which did notseem to have a lasting impact on many charitableand civic trends.Some of the initial observed effects on charitablecontributions during the Great Recession werenegative. The annual Giving USA report featureshistorical trend data on giving from all sources,including individuals, foundations, corporations, andbequests. In more than fifty years of historical data –a period that covers several national recessions – onlythe Great Recession period featured a sustained declinein overall dollars donated (controlling for inflation).13However, a recent analysis14 of more detailed historicaldata showed that many nonprofit organizationsexperienced small declines in revenues from all sources,and that organizational closures were only slightly morecommon during the recessionary period than theywere before or afterward.15 Many organizations seemto have successfully adapted to the change in economicconditions by changing their revenue models – forinstance, by relying less on contributed income andmore on earned income.16Dietz, Nathan, and Robert T. Grimm, Jr. 2016. “Doing Good by the Young and Old: Forty Years of American Volunteering.” Nonprofit Quarterly, November 17. Availableat y-years-american-volunteering/12See the official definitions published by the National Bureau of Economic Research, available at https://www.nber.org/cycles/.13Giving USA 2019: The Annual Report on Philanthropy for the Year 2018, a publication of Giving USA Foundation, 2019, researched and written by the Indiana UniversityLilly Family School of Philanthropy. Available online at www.givingusa.org.14McCambridge, Ruth, and Nathan Dietz. 2020. “The Great Recession: Nonprofit Winners and Losers.” Nonprofit Quarterly, Spring 2020. Available at -nonprofit-winners-and-losers/.158.6 percent of all reporting nonprofits with gross receipts of 100,000 or more closed during the 2008-2010 time period, compared to 6.3 percent during 2004-2007and 6.6 percent between 2011-2013. See McCambridge and Dietz, op cit., for more details about nonprofit finances before, during, and after the Great Recession.16McCambridge and Dietz, op cit.11
91“As the nation fights against the currentpandemic and plans for the recovery, ourchallenge will be to build on likely increases inAmericans’ impulse to engage in charitable andcivic activities and find a way to sustain thosevaluable trends for the long haul.”The evidence also suggests that the Great Recessiondid not have an immediate or sustained negativeimpact on volunteering and other forms of civicengagement. Participation rates for the four forms ofcivic engagement considered here – volunteering withan organization, giving to charity, attending publicmeetings, and working with neighbors – all increasedsignificantly at the national level in 2008 or 2009. Onepost-recession study17 offers a possible explanation forwhy the economic downturn may have encouraged,not discouraged volunteering. An analysis of multiyear,nationwide CPS data suggests that the foreclosurerate – one of the most commonly used measures ofeconomic distress during the recession – was associatedwith higher volunteer rates among homeowners inmetropolitan areas, controlling for other characteristicsof the individual and the MSA.In other words, the recession might have encouragedprosocial behaviors among residents with the strongestconnections to communities that suffered economichardship, the negative trends of the mid-2010s amongall four civic indicators show that those gains werelargely reversed at the national level.Because the Great Recession did not appear tohave a lasting negative impact on civic engagement,the analysis in this brief focuses on two regions thatexperienced severe and immediate economic andsocial devastation: New York City in the early 2000s,after the attacks of September 11, 2001, and NewOrleans in the mid-2000s, after Hurricane Katrina.Although data problems (a lack of pre-9/11 data formetro NYC; relatively small sample sizes for metroNew Orleans) limit our ability to draw definitiveconclusions, the results suggest a surge in charitableand civic activities in the post-crisis recovery periodin bot
visiting out-of-state volunteers, the new long-distance volunteers comprised about 19 percent of the "total" number of volunteers in the state. Metro New Orleans also exhibited a surge in informal charitable behavior (working with your neighbors to fix or improve something) and civic behavior (attending public meetings) in the years