Transcription
Discover. Achieve. SucceedFRAMINGHAM STATE UNIVERSITYOffice of Institutional AssessmentGraduate Student Exit Survey Report 2016-17Masters of Public AdministrationTotal Respondents: 8Mark Nicholas, Ph.D., Director of AssessmentBrittany Brown, BA, Staff AssistantSeptember 2017
Table of ContentsHow many years did it take you to finish this degree?. 3What is the degree you are completing?. 3How did you first hear about FSU graduate programs? . 4Why did you choose to attend FSU for your graduate program? . 5Did you apply to any other universities for graduate school?. 7What was your rating of FSU at the time you applied for admission? . 8Please indicate the level of challenge presented by each item below based on your experience whilepursuing your graduate degree: . 9How did you finance your graduate education?. 11How applicable were the program requirements to your current/or future workplace? . 13After completing your graduate program, how would you classify your level of preparation? . 14Please indicate your level of satisfaction with FSU Graduate Services in the following areas:. 15Please rate your level of satisfaction with the following aspects of your graduate education experiencesrelated to your degree:. 16Please rate your level of agreement with the following statements: . 18Did you receive your undergraduate degree from FSU? . 19Would you select FSU if you were to begin graduate school all over again? . 20Would you recommend FSU to other potential students?. 21Are you an in-state, out-of-state, or international student (living inside or outside the U.S.)?. 22Did you complete this degree as: . 23What percentage of your classes did you take online and what percentage would you have preferred? 24Are you completing your degree at an IEP site?. 252 Page
How many years did it take you to finish this degree?I'AnswerResponse PercentResponse CountLess than 2 years50.00%42 - 4 years25.00%24- 6 years12.50%16 - 8 years12.50%1More than 8 years0.00%0Total100%8What is the degree you are completing?Answer'Master of Public AdministrationTotal3 PageIResponse PercentResponse Count 7-100.00%8100%8
How did you first hear about FSU graduate programs?AnswerResponse PercentPercent of CasesResponse CountFSU Website27.27%37.50%3Word of Mouth from FSU Alumni27.27%37.50%3From an Employer18.18%25.00%2Graduate Fair/Career Fair9.09%12.50%1From a Co-worker9.09%12.50%1Other (please specify)9.09%12.50%1I am a FSU Alumni0.00%0.00%0Other Websites0.00%0.00%0Word of Mouth from current FSU Student0.00%0.00%0From an Undergraduate Faculty 0%0Brochure0.00%0.00%0Total100%Other (please specify)I live in the area4 Page8
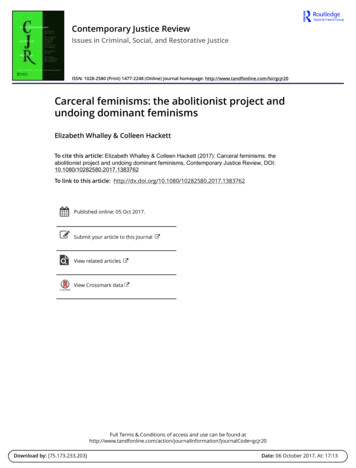
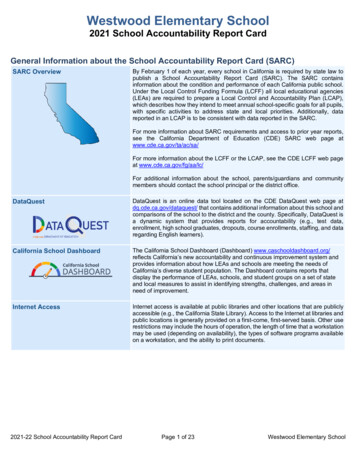
Why did you choose to attend FSU for your graduate program?CourselimeaLocationCoatProgram/DegreeAll y1 comp letedegree/program/courae111orkonlineandlor n'JbrldAce rmcReputationUniq ue ProgramOffere I at FSIJThroughRacommeooationaSize of Academic-ProgramOther (pleas.a 81)8Cify)Ree.aerchFacilitieaNumber of GraduateStudentaThe AdministrativeStaffThe FacultyIO.OOo/,.10.00o/oI20.00%II30.00'¾40 .00%I50.00%II00.00'Y.70.00 %IISO.OO'Y. 90.00'Y. Percenta g,eIn the table below respondents selected the most significant reasons why they chose to attend FSU fortheir graduate program. Respondents indicated the most significant reasons were (1) cost, location, andconvenient course times.5 PageI100.00%
AnswerResponsePercent15.00%Percent ofCases75.00%15.00%75.00%615.00%75.00%6Ability to complete degree/program/ courseworkonline and/or hybridProgram/Degree Options12.50%62.50%512.50%62.50%5'Academic Reputation10.00%50.00%4'Through Recommendations7.50%37.50%3Unique Program Offered at FSU7.50%37.50%3Other (please specify)2.50%12.50%1'Size of Academic Program2.50%12.50%1'The Faculty0.00%0.00%0'Number of Graduate Students0.00%0.00%0'Research Facilities0.00%0.00%0'The Administrative Staff0.00%0.00%0'Total100%ICost!Location'st !stlConvenient Course Times st lIOther (please specify)It was free thanks to Uncle Sam6 PageResponseCount6---8IIJ
Did you apply to any other universities for graduate school?,.0QP/a15,00% vesAnswer Nl oResponse PercentResponse CountYes25.00%2No75.00%6100%8Total7 Page
What was your rating of FSU at the time you applied for admission?.50 % 2ndl Cho iceAnswer 3r ,d Cho ic e FSU was n ot o:ne o f my top thre e cho icesResponse PercentResponse Count1st Choice87.50%72nd Choice0.00%03rd Choice12.50%1FSU was not one of my top three choices0.00%0Total100%88 Page
Please indicate the level of challenge presented by each item below based onyour experience while pursuing your graduate degree:Question'Work or allenging 30.00%-Family ImmigrationRegulationsl0.00%Program Requirementsor 0.00%l0.00%14.29%57.14%28.57%0.00%Communication withGraduate 0.00%0.00%0.00%Communication withGraduate AdmissionsOffice Staff0.00%87.50%28.57%Communication withStudents Services Staff-14.29%14.29%'4.1314.29%12.50%Communication withGraduate Office StafflI57.14%Communication withFaculty8100.00%57.14%Course 0%'-9 Page STAd· *
I'Communication withGraduate RegistrarOffice 0%100.00%0.00%10 P a g L12.50%0.00%0.00%Comprehensive Examl0.00%33.33%Practicum Requirement3.5712.50%62.50%Portfolio Requirement771.43%14.29%Course Requirementsand Coursework0.00%71.43%14.29%Illll
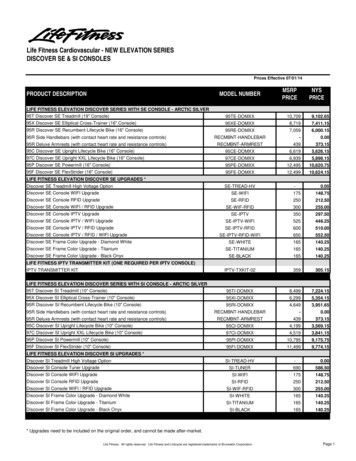
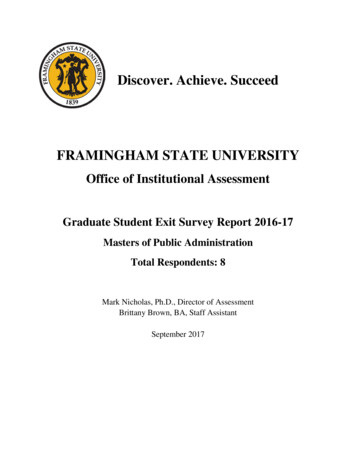
How did you finance your graduate education?FundedSelf FundedGovernment Grants r Fundi ng (ELQ Veterane Benef itsor GI bi ll)other(pleasellpeCify)FSU Grad uateAssista ntsh ipNo n-FSUSc holarsh ipFS U Senior Cit izenWaiverStudent LoansI0.00%10.00%I20.00%II30.00o/a40.00%I50.00% Percentage11 P a g eII1}0.00%10 0 0%I80.00%IG0.00%I100.00%
AnswerResponsePercent33.33%Percent ofCases50.00%Self Funded25.00%37.50%3Government Grants or Funding (e.g. VeteransBenefits or GI bill)Other (please specify)25.00%37.50%316.67%25.00%2FSU Graduate Assistantship0.00%0.00%0Non- FSU Scholarship0.00%0.00%0FSU Senior Citizen Waiver0.00%0.00%0Student Loans0.00%0.00%0Total100%Employer FundedOther (please specify)[Scholarship Name Removed] ScholarshipTuition waiver from parent who is staff12 P a g eResponseCount48
How applicable were the program requirements to your current/or futureworkplace?,.00 % A Great DealAnswer 011J itea Lot some AUUJeNoneResponse PercentResponse CountA Great Deal37.50%3Quite a Lot25.00%2Some37.50%3A Little0.00%0None0.00%0Total100%813 P a g e
After completing your graduate program, how would you classify your level ofpreparation? Excellen t prepa ration Good prepara t ion Adequate p reparation inadequa te preparatio11Not sure h ow FSU prepared meAnswerResponse PercentResponse CountExcellent preparation37.50%3Good preparation50.00%4Adequate preparation12.50%1Inadequate preparation0.00%0Not sure how FSU prepared me0.00%0Total100%814 P a g e
Please indicate your level of satisfaction with FSU Graduate Services in thefollowing areas:STUDIESOFFICEGRADUATEADM ISSIONSOFFICE MeanREGISTRAR·sOFFICEFINANC I AL AID &SCHOLARSHIPS0IIIIIIIIIIII0.20.40 tisfied Neutral DissatisfiedGRADUATESTUDIES %12.50%37.50%15 P a g %0.00%100.00%FINANCIAL AID &SCHOLARSHIPSTotal .00%62.50%0.00%0.00%
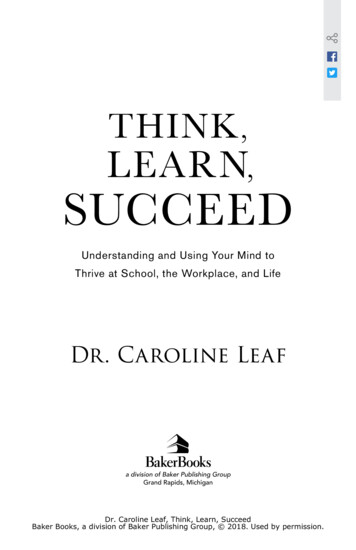
Please rate your level of satisfaction with the following aspects of your graduateeducation experiences related to your degree:QuestionVerySatisfiedAcademic quality of students withwhom you took courses75.00%VeryRatingSatisfied Neutral 00%75.00%Accessibility of instructors'50.00%50.00%l 25.00%0.00%l25.00%25.00%J0.00%25.00%Assistance with finding 0.00%25.00%I 50.00%0.00%l25.00%50.00%0.00%0.00%Program coverage of relevant %0.00%50.00%75.00%l 0%'40.00%75.00%Length of graduate program0.00%0.00%75.00%Finding and working with your graduateprogram coordinatorl0.00%100.00%Feedback you received in courses fromfaculty1.750.00%100.00%Faculty expertise433.33%75.00%Diversity of students with whom youtook courses0.00%I33.33%66.67%Degree plan flexibility and electivechoices1.250.00%66.67%Availability of 0%75.00%'0.00%25.00%75.00%Assistance with external 0%I16 P a g e -11 -*9
IIQuality of graduate advising from majorprofessor or graduate 25.00%0.00%66.67%l0.00%0.00%0.00%50.00%I %32.670.00%41.5025.00%42.25-I-33.33%I 33.33%67.67%17 P a g el0.00%25.00%75.00%Timing of your .00%75.00%Support in planning and completingthesis, projects in lieu, or portfolio, orcomprehensive exam433.33%66.67%Sequencing of content across programcourses25.00%0.00%75.00%Quality of your 0%75.00%Quality of instruction in your coursesI0.00%I0.00%0.00%I33.33%33.33%32.33
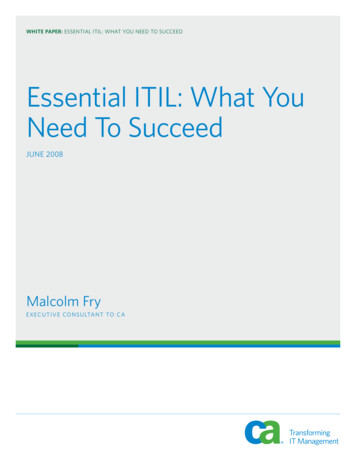
Please rate your level of agreement with the following statements:graduate de,g reefrom FSU hasbrought me cloE.erto ach iev ing mygoalsMy graduateexperience at FSUwas rewarding Mea11M graduatecourE.ework at FSI.Jwea c hallengingMy graduate de,g reefrom FSU ismar ketable0IIIIIIIIII0 .20 .40 .60.81.21.41.61.8222QuestionStronglyAgreeMy graduate degree fromFSU has brought me closerto achieving my goals62.50%AgreeNeutral Disagree25.00% 12.50%0.00%87.50%My graduate experience atFSU was rewarding50.00%37.50%37.50%0.00%37.50% 12.50%75.00%My graduate degree fromFSU is marketable37.50%37.50% 25.00%75.00%18 P a g 7.50%My graduate coursework atFSU was 2.50%12.50%0.00%0.00%0.00%
Did you receive your undergraduate degree from FSU?00 .00% vesAnswer Nl oResponse PercentResponse CountYes0.00%0No100.00%8100%8Total19 P a g e
Would you select FSU if you were to begin graduate school all over again?.50'% vesAnswer Nl oResponse PercentResponse CountYes87.50%7No12.50%1100%8Total20 P a g e
Would you recommend FSU to other potential students?.50'% vesAnswer Nl oResponse PercentResponse CountYes87.50%7No12.50%1100%8Total21 P a g e
Are you an in-state, out-of-state, or international student (living inside oroutside the U.S.)? 1111-StateStu de nt Out - of-Sta te Student lnt ernatio11all Stu de nt livi11gin th e U.S. Int ernational Stu dent lirvi11goutsid e tile U.S.AnswerResponse PercentResponse Count100.00%8Out-of-State Student0.00%0International Student living in the U.S.0.00%0International Student living outside the U.S.0.00%0Total100%8In-State Student22 P a g e
Did you complete this degree as:.50% Part -tim eAnswer Full- tim eResponse PercentResponse CountPart-time87.50%7Full-time12.50%1100%8Total23 P a g e
What percentage of your classes did you take online and what percentagewould you have preferred?FieldMeanCountMy courses were online51.29%7I would have preferred online:43.63%8The question asked respondents to mark the percentage of courses taken online and the percentagethey would prefer to take online using a slider that went from 0% - 100%. The table above shows themeans for each. Graduate students reported that they took approximately 51% of courses in the onlineformat. Students indicated they would have preferred to have taken 44% of courses online.24 P a g e
Are you completing your degree at an IEP site?.00% vesAnswer Nl oResponse PercentResponse CountYes0.00%0No100.00%8100%8Total25 P a g e
Discover. Achieve. Succeed FRAMINGHAM STATE UNIVERSITY Office of Institutional Assessment Graduate Student Exit Survey Report 2016-17 Masters of Public Administration