Transcription
The ChangingDemographics of GeorgiaMatt Hauer,Carl Vinson Instituteof Government
Marketers anddemographers
What percent of the state’spopulation was born in Georgia?1.2.3.4.16.2%22.8%43.1%55.8%
people in Georgia speak aforeign language in their home1. Fewer than 500,0002. Between 500,000 &750,0003. Between 750,000 &1,000,0004. More than 1,000,000
MillionsPopulation of Georgia, 1900–2010
Components of Change, 1940–20091,020,304
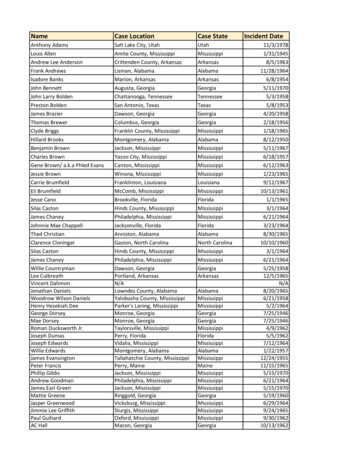
Fastest Growing Counties Of the fastest growing counties in theU.S., Georgia has – 4 of the top 20,– 10 of the top 50, and– 18 of the top 100. 48% growth rate between 2000–2010– From 1.6 million in 2000 to 2.4 million in 2010
Fastest Growing Counties: 4 of 20
Fastest Growing Counties: 10 of 50
Fastest Growing Counties: 18 of 100
Change in Population, 2000–2010
Atlanta Housing Growth
Atlanta Housing Growth
Atlanta Housing Growth05-09
Georgia’s Race Distribution, 1980WhiteBlackHispanic1% 1%26%72%Other
Georgia’s Race Distribution, 2010WhiteBlackHispanicOther1% 1%5%9%26%30%72%198056%2010
Georgia’s Race Distribution, 1980–20301% 98044%2010Source: US Census Bureau, and internal population projections2030
Race and Ethnic Population 000,00001980199020002010
Percent of State Asian Population
Percent of State Asian Population
Georgia Is the New CaliforniaPercent n1.3%3.0%5.6%519%Cobb1.8%3.1%4.5%291%Henry County isGwinnettoneof theCountyfourhas thelargestfastestgrowingNew Immigrantcountiesin theAsianU.S.population
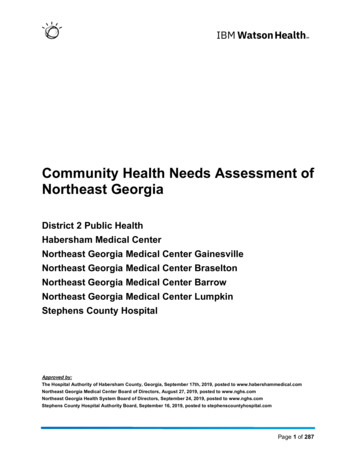
Percent of State Hispanic Population
Percent of State Hispanic Population
Percent of Hispanic Population by County
Fast Growth Fast Hispanic Growth2000-2010
Slow Growth Larger Proportions due toHispanic Growth
Fastest Growing Counties: 18 of 100
Fastest Growing Counties and FastestHispanic Growth in Counties
Growth, er218,144Hispanic418,462
Growth, 296.1%
Growth, 2000–2010NumberChangePercentChangeAnnual %Other218,14474.9%6.4%Hispanic418,46296.1%7.8%
Growth, 2000–2010NumberChangePercentChangeAnnual GrowthRateDoubling TimeWhite285,2595.6%0.6%116.67 yearsBlack579,33524.8%2.5%28 yearsOther218,14474.9%6.4%10.94 yearsHispanic418,46296.1%7.8%8.97 years
Change in White Population, 2000–2010
Change in Black Population, 2000–2010
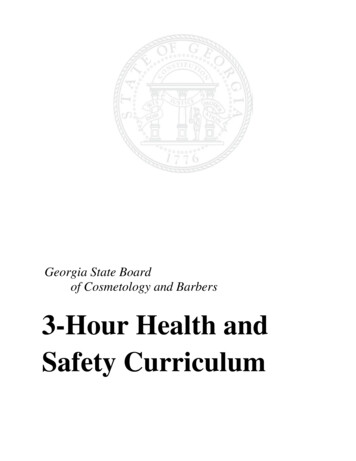
Change in Hispanic Population, 2000–2010
Where Do Babies Come From?DemographicPerspectiveNumber of Women ofChildbearing Age
Prime School Age (5–25 Years) Population in20008007006005004003002001000
Total Fertility Rate, 2000Total Fertility RateStatewide2.13
Total Fertility Rate, 2000Total Fertility ic3.53
Total Fertility Rates 000 2001 2002 2003 2004 2005 2006 2007 2008 2009
Population 465-6970-7475-7980-8485 2001000Source: US Census Bureau, and internal population projections
Population 465-6970-7475-7980-8485 03002001000Source: US Census Bureau, and internal population projections
Population 465-6970-7475-7980-8485 004003002001000Source: US Census Bureau, and internal population projections
Percent Change in Population Under 18,2000–2010AlabamaTennesseeSouth CarolinaNorth CarolinaFloridaGeorgia-3.0%7.0%17.0%
Source: Pew Hispanic Center
Educational Attainment National graduationrate is 69%. 64,100 studentsdid not graduatehigh school in2009.
Educational AttainmentBelow poverty level, population aged 25 and older,2007–2009% belowpoverty% ineducationalgroupLess than high school diploma39%28%High school diploma, GED, oralternative34%14%Some college or associate’s degree 19%8%Bachelor’s degree6%4%Graduate or professional degree2%3%
Median Income by Educational AttainmentGraduate or professional degreeBachelor's degreePopulation averageSome college or associate's degreeHigh school diploma, GED, or alternativeLess than high school diploma 0 10,000 20,000 30,000 40,000 50,000 60,000 70,000
Unemployment by Education Attainment
Percent Aged 18–24 Not Enrolled and Not Having aHigh School Diploma or Equivalent, 2006–2008
Educational Attainment, Population Aged 25and Older, panic50.0%40.0%30.0%20.0%10.0%0.0%Less than highschool diplomaHigh schoolgraduate orHigherSome college orBachelor'sHigherdegree or Higher
PrisonsGeorgia has the 5th largestprison population in the U.S.
Rising Immigrant Status with Longer ResidenceAttainment for 1985-1989 Immigrant Arrival Cohort70%Better 0%BA Completion20%10%Myers & Pitkin,0%199020002008Dowell Myers, USC Price
English ProficiencyBy Age at Arrival in the 1985-89 Immigrant Wave100%Age 0-990%Age 10-1980%70%Age 20 60%50%40%30%20%10%0%199020002008Source: U.S. Census, 1990, 2000; American Community Survey, 2008.Dowell Myers, USC Price
Change in HomeownershipFor Successive Waves of Immigrants Arriving Before 1970, 80, 90, or 809000TXData Source: Dowell Myers & Cathy Liu, Urban Policy and Research, September 20050708090FL00708090ILDowell Myers, USC Price00
Percent Spanish Users by Immigrant GenerationFor Latinos in the U.S., 2002Source: Pew Hispanic CenterDowell Myers, USC Price
Population Composition by Years in U.S. &GenerationFor Latinos Age 25-34 in California100%90%80%70%60%16.026.917.92nd Gen8.839.950%40%29.230%20%10%3rd Gen28.2Pitkin &Myers '10CDF 9-70%200020 Yrs7.312.010-19 Yrs13.90-9 Yrs2030Dowell Myers, USC Price
Population Change 1990-2010Under 2525 - 4445 - 6465 - 8080 % Increase1990-201051%25%111%5376
Mock Population Projection19905 - 242.025 - 442.245 - 641.265 - 800.6
Mock Population Projection199020105 - 242.02.725 - 442.22.745 - 641.22.465 - 800.60.9
Mock Population Projection1990201020305 - 242.02.725 - 442.22.72.745 - 641.22.42.765 - 800.60.92.4
10009008007006005004003002001000Source: US Census 970-7475-7980-8485 20-2415-1910-140-45-9Population Projections1990
Population ProjectionsSource: US Census 970-7475-7980-8485 03002001000
Population ProjectionsSource: US Census 970-7475-7980-8485 004003002001000
Population 465-6970-7475-7980-8485 6005004003002001000Source: US Census Bureau, and internal population projections
Health Outcomes
Health Outcomes
Mortality
Morbidity
Socioeconomic
Access to Care
ConclusionsRapid growth amongstyoungest and oldestpopulationsPopulation from the“middle ages” growingthe least
ConclusionsGeorgia is no longer a black and whiteHow do state.you plan forchanging Georgia?
Final Thoughts Demography is destiny. “The best way to predict your future isto create it.”—Abraham Lincoln
Contact InfoMatt Hauer(706) 542-9369hauer@cviog.uga.eduwww.vinsoninstitute.org
Carl Vinson Institute of Government The Changing Demographics of Georgia . Marketers and demographers . What percent of the state's population was born in Georgia? 1. 16.2% . Atlanta Housing Growth 05-09 . Georgia's Race Distribution, 1980 72% 26% 1% 1% White Black Hispanic Other. Georgia's Race Distribution, 2010 72%