Transcription
CDC: Safer - Healthier - People 1Using the BMI-for-Age Growth ChartsINTRODUCTIONThe Body Mass Index (BMI)-for-age charts for boys and girls aged 2 to 20 years are a majoraddition to the new CDC Pediatric Growth Charts. For the first time there is a screening toolto assess risk of overweight and overweight in children and adolescents. This modulepresents the rationale behind the decision to include the BMI-for-age charts, discussescharacteristics of the BMI-for-age charts, and provides an opportunity for practicalapplication of calculating BMI, and plotting and interpreting BMI-for-age through casestudies.OBJECTIVES Describe the advantages of using the BMI-for-age charts as a screeningtool to evaluate overweight and underweight in children and adolescents Calculate BMI using the metric and English methods Demonstrate an understanding of the use of the BMI-for-age chart byaccurately plotting and interpreting BMI-for-age on the appropriate chartTABLE OF CONTENTS1. What is BMI?2. Advantages to using BMI-for-age as a screening tool for overweight and underweight3. Recommendations for using BMI to assess overweight4. Characteristics of BMI-for-age5. Recommended BMI-for-age cutoffs6. Calculating BMI7. Other methods to obtain BMI8. Visual assessment versus calculation of BMI9. Accuracy of measurements10. Interpretation11. Summary12. Steps to plot and interpret BMI-for-age13. References and resourcesAppendix
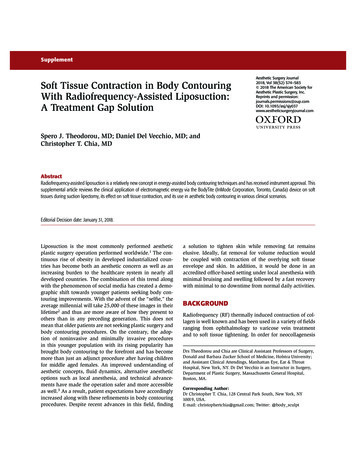
CDC: Safer - Healthier - People 21. WHAT IS BMI? An anthropometric index of weight and heightBody Mass Index (BMI) is an anthropometric index of weight and height that is defined asbody weight in kilograms divided by height in meters squared (Keys et al., 1972).BMI weight (kg) / height (m)²BMI is the commonly accepted index for classifying adiposity in adults and it isrecommended for use with children and adolescents. A screening toolLike weight-for-stature, BMI is a screening tool used to identify individuals who areunderweight or overweight. BMI is NOT a diagnostic tool (Barlow and Dietz, 1998).For example, a child who is relatively heavy may have a high BMI for his or her age or highweight-for-stature. To determine whether the child has excess fat, further assessmentwould be needed and that might include skinfold measurements. To determine a counselingstrategy, assessments of diet, health, and physical activity are needed.For children, BMI is gender specific and age specific (Hammer et al., 1991; Pietrobelli et al.,1998). Because BMI changes substantially as children get older, BMI-for-age is themeasure used for children ages 2 to 20 years.FOR CHILDREN, BMI DIFFERS BY AGE AND GENDERBecause adiposity varies with age and genderduring childhood and adolescence, BMI is age andgender specific. As illustrated on this growth chartfor boys, in a growth pattern established alongthe 95th percentile, BMI-for-age reached aminimum at 4 years of age and then increasedwith increasing age.
CDC: Safer - Healthier - People 3 An indirect measure of body fatnessBMI is not a direct measure of body fatness. However, BMI parallels changes obtained bydirect measures of body fat such as underwater weighing and dual energy x-rayabsorptiometry (DXA). BMI can be considered a proxy for measures of body fat.2. ADVANTAGES TO USING BMI-FOR-AGE AS A SCREENING TOOL FOROVERWEIGHT AND UNDERWEIGHTThere are several advantages to using BMI-for-age as a screening tool for overweight andunderweight. BMI-for-age provides a reference for adolescents not previouslyavailable. When the 1977 NCHS growth charts were developed, weight-forheight percentiles were provided only for prepubescent girls up to 10 years andfor boys up to 11.5 years (Hamill et al., 1979). BMI-for-age is the only indicatorthat allows us to plot a measure of weight and height with age on the samechart. BMI-for-age was not available in the 1977 charts. Age as well as stage ofsexual maturity is highly correlated with body fatness (Daniels et al., 1997). BMI-for-age is the measure that is consistent with the adult index so itcan be used continuously from 2 years of age to adulthood. BMI-for-age is not used in the United States before 2 years of age toscreen for growth. BMI values at younger ages have a weak associationwith adolescent or adult obesity (Whitaker et al., 1997; Guo et al., 1994).BMI can be used to track body size throughout the life cycle. This isimportant because BMI-for-age in childhood is a determinant of adulthood BMI.
CDC: Safer - Healthier - People 4The tracking of BMI that occurs from childhood to adulthood is clearly shown in data from astudy by Robert Whitaker and colleagues (Whitaker et al., 1997). They examined theprobability of obesity in young adults in relation to the presence or absence of overweight atvarious times during childhood. For example, in children 10 to 15 years old, 10% of thosewith a BMI-for-age 85th percentile were obese at age 25 whereas 75% of those with aBMI-for-age 85th percentile were obese as adults and 80% of those with a BMI-for-age 95th percentile were obese at age 25. (The sample size for the study was 854.) From thisstudy, it is clear that an overweight child is more likely than a child of normal weight to beobese as an adult.Other studies have shown this same trend of tracking occurring from childhood to adulthood(Guo et al., 1999; Guo et al., 1994; Garn and LaVelle, 1985). BMI-for-age relates to health risks.oBMI-for-age correlates with clinical risk factors for cardiovascular diseaseincluding hyperlipidemia, elevated insulin and high blood pressure.Freedman and colleagues used data from the Bogalusa Heart Study andfound that approximately 60% of 5 to 10 year-old children who wereoverweight had at least one biochemical or clinical risk factor forcardiovascular disease such as those just mentioned, and 20% had two ormore risk factors (Freedman et al., 1999).oBMI-for-age during pubescence is related to lipid and lipoprotein levelsand blood pressure in middle age (Must et al., 1992). Risk factors inchildren can become chronic diseases in adults.BMI-for-age compares well with both weight-for-stature measurementsand measures of body fat.oA study completed by researchers at the CDC (Mei et al., 2002) comparedthe performance of BMI-for-age and weight-for-stature with fatnessmeasured by dual energy x-ray absorptiometry (DXA), a direct measure ofadiposity. NHANES III data were used to test how well BMI-for-agepredicts underweight (below the 15th percentile) andoverweight (above the 85th percentile) relative to thetraditional weight-for-stature in children 2 to 19 years old. Both BMI-for-age and weight-for-stature performed equallywell in screening for underweight and overweight amongchildren 3 to 5 years of age. For school-aged children (6 to 11 and 12 to 19 age groups),BMI-for-age was slightly better than weight-for-stature inpredicting underweight and overweight.
CDC: Safer - Healthier - People 5 Ratios of weight relative to stature such as BMI-for-age andweight-for-stature may be used as indirect measures ofoverweight that correlate with direct measures. CDC recommends the use of BMI-for-age for children aged2 years and older. However, weight-for-stature performsequally well in pre-school aged children and can be used inthis age group.BMI-for-age is significantly correlated with subcutaneous and total body fatnessin adolescents (Barlow and Dietz, 1998).3. RECOMMENDATIONS FOR USING BMI TO ASSESS OVERWEIGHTBecause of the numerous advantages of using BMI-for-age to assess overweight in childrenand adolescents, expert committees and advisory groups have recommended BMI-for-ageas the accepted measure. In 1994, an expert committee on Clinical Guidelines for Overweight in AdolescentPreventive Services was convened by the Maternal and Child Health Bureau(MCHB), American Academy of Pediatrics and the American Medical Associationwith support from the Centers for Disease Control and Prevention, to adviseBright Futures: National Guidelines for Health Supervision of Infants, Childrenand Adolescents and Guidelines for Adolescent Preventive Services (GAPS) on thecriteria for the identification of adolescent obesity. The committee recommendedthat BMI-for-age be used to routinely screen for overweight in adolescents(Himes and Dietz, 1994). In 1997, a consensus panel recommended that BMI for age be used routinely toscreen children for overweight. They also recommended cutpoints of between the85th and 95th percentiles to identify children and adolescents as at risk ofoverweight and at or above the 95th percentile to identify children andadolescents as overweight. (Barlow and Dietz, 1998). Also, in 1997, an international conference convened by the International ObesityTask Force concluded that BMI is a reasonable measure for assessing overweightin children and adolescents worldwide. (Dietz and Bellizzi, 1999; Bellizzi andDietz, 1999).Dr. William Dietz discusses the rationale for the BMIcutpoints, the limitations and sensitivity of BMI-for-age. Dr.Dietz is the Director of the Division of Nutrition and PhysicalActivity, National Center for Chronic Disease Prevention andHealth Promotion, Centers for Disease Control andPrevention, and was a member of the various expertcommittees on obesity.Full text is included in the Appendix.
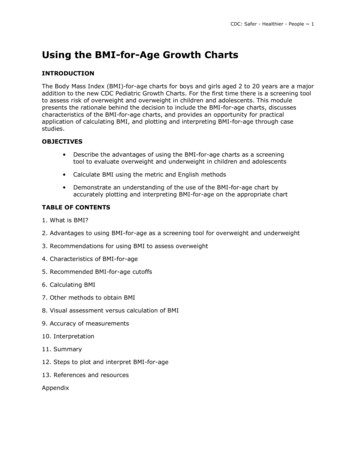
CDC: Safer - Healthier - People 64. CHARACTERISTICS OF BMI-FOR-AGE The shape of the weight-for-stature curve versus the BMI-for-age curveThe shapes of the weight-for-stature and the BMI-for-age growth curves differ, as you cansee. The weight-for-stature curve shows how weight increases in relation to stature. The1977 weight-for-stature charts are limited to prepubescent boys under 11.5 years of ageand statures of less than 145 cm and to prepubescent girls under 10 years of age andstatures less than 137 cm (Hamill et al., 1979). The BMI-for-age chart shows age-relatedchanges in growth and can be used up to age 20. With the BMI-for-age chart weight,stature and age of a child are considered whereas with the weight-for-stature chart, onlyweight and height are used. The shape of the BMI-for-age chart clearly illustrates "adiposity" reboundBMI changes substantially with age. After about 1 year of age, BMI-for-age begins to declineand it continues falling during the preschool years until it reaches a minimum around 4 to 6years of age. After 4 to 6 years of age, BMI-for-age begins a gradual increase throughadolescence and most of adulthood. The rebound or increase in BMI that occurs after itreaches its lowest point is referred to as "adiposity" rebound (Whitaker et al., 1998;Rolland-Cachera et al., 1991; Rolland-Cachera et al., 1984). This is a normal pattern ofgrowth that occurs in all children.Age (months)26323841BMI18.217.418.518.7
CDC: Safer - Healthier - People 7Here you see a section of the BMI-for-age chart for boys enlarged to show the shape of thecurve in more detail. After 4 to 6 years of age, BMI-for-age begins a gradual increasethrough adolescence and most of adulthood. The rebound or increase in BMI that occursafter it reaches its lowest point is referred to as "adiposity" rebound (Whitaker et al., 1998;Rolland-Cachera et al., 1991; Rolland-Cachera et al., 1984). This is a normal pattern ofgrowth that occurs in all children.Recent research has shown that the age when the "adiposity" rebound occurs may be acritical period in childhood for the development of obesity as an adult (Whitaker et al.,1998). An early "adiposity" rebound, occurring before ages 4 to 6, is associated with obesityin adulthood. In the example shown here, adiposity rebound occurred at around age 3. BMIreached the lowest point at 32 months (2 years 8 months) and then began to increase.However, studies have yet to determine whether the higher BMI in childhood is trulyadipose tissue versus lean body mass or bone. Additional research is needed to furtherunderstand the impact of early adiposity rebound on adult obesity. (Note that we put theword adiposity in quotations when using it in this context since we do not know if it is trulyadipose tissue.)5. RECOMMENDED BMI-FOR-AGE CUTOFFS 95th percentile85th to 95th percentile 5th percentileOverweightRisk of overweightUnderweightThe expert committees’ recommendations are to classify BMI-for-age at or above the 95thpercentile as overweight and between the 85th and 95th percentile as at risk of overweight(Himes and Dietz, 1994)."Overweight" rather than obesity is the term preferred for describing children andadolescents with a BMI-for-age equal to or greater than the 95th percentile of BMI-for-ageor weight-for-length.The 85th percentile is included on the BMI-for-age and the weight-for-stature charts toidentify those at risk of overweight.The cutoff for underweight of less than the 5th percentile is based on recommendations bythe World Health Organization Expert Committee on Physical Status (World HealthOrganization, 1996).
CDC: Safer - Healthier - People 8Classifications of Overweight and Underweight for AdultsClassification of overweight and underweight is different for adults than it is for children andadolescents. For adults, overweight and underweight categories are defined by fixed BMIcutpoints derived from morbidity and mortality data. Adults with low and very high BMIs areat a higher relative mortality risk compared to those with BMIs of 18.5 or greater and lessthan 30.0 (Strawbridge et al., 2000). For adults, BMI is not age- or gender-specific as it isfor children and adolescents.Clinical guidelines established in 1998 by the National Heart, Lung, and Blood Institute areas follows:BMI less than 18.5underweightBMI of 18.5 through 24.9normalBMI of 25.0 through 29.9overweightBMI of 30.0 or greaterobesePerformance of BMI-for-Age As A Screening Tool"The validity of selected cutoff points to identify adolescents with the highest percentage ofbody fat has been investigated. In general, common cutoff points for BMI and relativeweight have low sensitivities but high specificities. For example, BMIs 85th percentile hasa sensitivity of 29% and 23% for identifying adolescent males and females, respectively,who are above the 90th percentile for percentage body fat; corresponding specificities are99% and 100% (Himes and Bouchard, 1989). In screening for adolescent overweight,specificity may be more important than sensitivity. Maximizing specificity minimizes theproportion of adolescents who will be incorrectly considered overweight by the screen"(Himes and Dietz, 1994).Recently it has been shown that cardiovascular risk factors are associated with theestablished BMI-for-age cutoffs. Freedman et al., (1999) found that approximately 60% of 5to 10 year-old children with BMI-for-age values the 95th percentile had at least onebiochemical or clinical risk factor for cardiovascular disease such as hypertension, elevatedinsulin levels, and hyperlipidemia. Twenty percent of children had two or more risk factors.6. CALCULATING BMIBMI can be calculated using either the metric system or the English system.
CDC: Safer - Healthier - People 9CALCULATING BMI USING THE METRIC SYSTEMFormula: weight (kg) / [height (m)]2Calculation: [weight (kg) / height (cm) / height (cm)] x 10,000With the metric system, the formula for BMI is weight in kilograms divided by height inmeters squared. Since height is commonly measured in centimeters, an alternatecalculation formula, dividing the weight in kilograms by the height in centimeters squared,and then multiplying the result by 10,000, can be used.It is necessary to multiply by 10,000 to convert BMI to meters since stature measurementsare generally taken in centimeters. There are 100 centimeters in a meter and since statureis squared we must convert as such: 100 x 100 10,000.When using a hand-held calculator: if your calculator has a square function, divide weight (kg) by height (cm)squared, multiply by 10,000 and round to one decimal place. if your calculator does not have a square function, divide weight by height twiceas shown in the calculation formula above, multiply by 10,000 and round to onedecimal place.Calculations for BMI can be completed as a continuous equation. (Note that the formula forthe latter calculation is on the CDC Clinical Growth Charts and will be the calculation used inthis module).Example: We know that Sam’s weight is 16.9 kg and his height is 105.4 cm. What is Sam’sBMI?Answer: (16.9 kg / 105.4 cm / 105.4 cm ) x 10,000 15.2Practice calculating BMI using the metric systemComplete the following two calculations, rounding to one decimal place.Calculation 1: Georgia’s weight is 16.6 kg and her height is 99.1 cm. What is Georgia’s BMI?Answer: (16.6 kg / 99.1 cm / 99.1 cm) x 10,000 16.9Calculation 2: Jose’s weight is 18.3 kg and his height is 103.5 cm. What is Jose’s BMI?Answer: (18.3 kg / 103.5 cm / 103.5 cm) x 10,000 17.1CALCULATING BMI USING THE ENGLISH SYSTEMFormula: weight (lb) / [height (in)]2 x 703Calculation: [weight (lb) / height (in) / height (in)] x 703
CDC: Safer - Healthier - People 10When using English measurements, ounces (oz) and fractions must be changed to decimalvalues. Then, calculate BMI by dividing weight in pounds (lbs) by height in inches (in)squared and multiplying by a conversion factor of 703. When using a hand-held calculator, if your calculator has a squarefunction, divide weight (lbs) by height (in) squared, multiply by 703 andround to one decimal place. If your calculator does not have a square function, divide weight by heighttwice as shown in the calculation above, multiply by 703 and round to onedecimal place.Calculations for BMI can be completed as a continuous equation. Note that the formula forthe latter calculation is on the CDC Clinical Growth Charts and will be the calculation used inthis module.Example: Let’s calculate Sam’s BMI using the English numeric system. His weight is 37pounds and 4 ounces and his height is 41 1/2 inches.Convert ounces and fractions to decimals:Weight of 37 lbs and 4 oz 37.25 lbs (16 ounces 1 pound so 4 oz/16 oz 0.25).Height 41.5 in.(37.25 lbs / 41.5 in / 41.5 in) x 703 15.2Practice calculating BMI using the English systemComplete the following two calculations, rounding to one decimal place.Calculation 1: Georgia’s weight is 36 ½ pounds and her height is 39 inches. What isGeorgia’s BMI?Answer: Convert fractions to decimals:Weight of 36 ½ lbs 36.5 lbs(36.5 lbs / 39 in / 39 in) x 703 16.9Calculation 2: Jose’s weight is 40 ¼ pounds and his height is 40 ¾ inches. What is Jose’sBMI?Answer: Convert fractions to decimals:Weight of 40 ¼ lbs 40.25 lbsHeight of 40 ¾ in 40.75 in(40.25 lbs / 40.75 / 40.75) x 703 17.0Note: There is a difference of 0.1 between BMI calculations when using the metric system(17.1) versus the English system (17.0). This is due to the conversion factor.
CDC: Safer - Healthier - People 117. OTHER METHODS TO OBTAIN BMI CDC Table for Calculated Body Mass Index Values for SelectedHeights and Weights for Ages 2 to 20In addition to calculations, BMI can also be determined by looking it up on the CDC Tablefor Calculated Body Mass Index Values for Selected Heights and Weights for Ages 2 to 20 inwhich BMI has been calculated.Example:Using the metric system, find the BMI for a child with a weight of 17.0 kg and a height of105.4 cm.Using the English system, find the BMI for a child with a weight of 37.5 lb and a height of41.5 in.See BMI TABLE in Appendix. Epi Info 2000 has an anthropometric data component calledNUTSTAT that can be used to look at population-based data orgroup data. SAS program to calculate BMI and percentiles for all indices.8. VISUAL ASSESSMENT VERSUS CALCULATION OF BMI How accurately can you screen for risk of overweight in children bylooking?It has been said that "few medical conditions can be diagnosed as confidently by untrainedindividuals as gross obesity." Yet it is very difficult to distinguish children who are at risk ofoverweight from normal children. In childhood, the distinction is made more difficult by agerelated physiological variations (Poskitt, 1995).Take a look at three photos of preschool aged children to see how accurately you can screenfor risk of overweight in children solely by looking at them. We want you to try to identifychildren with a BMI-for-age equal to or greater than the 85th percentile and less than the95th percentile.
CDC: Safer - Healthier - People 12FIRST EXAMPLEThe first photo is of Mike, a 3 year-old boy.Does he appear:1.2.3.4.UnderweightNormalAt risk of overweightOverweightLet’s assess for risk of overweight by calculating BMI.Mike’s height is 39.7 inches and his weight is 41.0 pounds.BMI (weight / height²) x 703Mike’s BMI: (41.0 / 39.7 / 39.7) x 703 18.3Now, plot his BMI on the appropriate chart for his age and interpret the findings.Mike's BMI-for-age falls above the95th percentile on the BMI-for-agechart for boys so he would beconsidered overweight.
CDC: Safer - Healthier - People 13SECOND EXAMPLEHere is Mindy, a 4 year-old girl.Does she appear:1.2.3.4.UnderweightNormalAt risk of overweightOverweightLet’s assess for risk of overweight by calculating BMI.Mindy’s height is 41.9 inches and her weight is 35.5 pounds.BMI (weight / height²) x 703Mindy’s BMI: (35.5 lbs / 41.9 in / 41.9 in) x 703 14.2Now, plot her BMI on the appropriate chart for her age and interpret the findings.Plotted on the BMI-for-age chartfor girls, Mindy's BMI-for-age fallsjust above the 10th percentileindicating that her BMI is withinnormal range.
CDC: Safer - Healthier - People 14THIRD EXAMPLELisa is another 4 year-old girl.Does she appear:1.2.3.4.UnderweightNormalAt risk of overweightOverweightLet’s assess for risk of overweight by calculating BMI.Lisa’s height is 39.2 inches and her weight is 38.6 pounds.BMI (weight / height²) x 703Lisa’s BMI: (38.6 lbs / 39.2 in / 39.2 in) x 703 17.7Now, plot her BMI on the appropriate chart for her age and interpret the findingsPlotted on the BMI-for-age chartfor girls, Lisa's BMI-for-age fallson the 94th percentile so shewould be classified as at risk ofoverweight.The point of this exercise is to demonstrate the difficulty of making a consistently accuratevisual assessment of at risk of overweight. To make a consistently accurate determinationof at risk of overweight, BMI must be determined and plotted on the appropriate growthchart for the appropriate age.
CDC: Safer - Healthier - People 159. ACCURACY OF MEASUREMENTSMeasurements must be obtained and recorded accurately if they are to be used as aneffective screening tool. Stature and weight should be measured following recommendedprotocols:Stature: mWeight: mThe following examples illustrate the importance of accurate measurements and shows thatinaccurate measurements can result in an inaccurate growth assessment.EXAMPLE 1:Sanjay is a 5.5-year-old boy, weighing 41.5 pounds with a height of 43.0 inches. Hiscalculated BMI is 15.8. When plotted on the BMI-for-age chart for boys, his BMI falls justabove the 50th percentile (shown by the green dot).Inaccurate measurementIf his height were measured orrecorded inaccurately at 42.25 inches(3/4 inch below his actual height of43.0 inches), his BMI-for-age would be16.3 and fall on the 75th percentile(shown by the red dot). In thisexample, the measurement error didnot cause a change in classificationbecause growth remained within thenormal range but you see what couldhappen.EXAMPLE 2:Maria is an 8.5-year old girl with a weight of 58.0 pounds and a height of 47.5 inches. HerBMI is 18.1. When plotted on the BMI-for-age chart for girls, her BMI falls between the 75thand 85th percentiles (shown by the green dot).
CDC: Safer - Healthier - People 16Inaccurate measurementIf her weight were measured orrecorded inaccurately at 60.0 pounds(2.0 pounds above her actual weightof 58.0 pounds), her BMI-for-agewould be 18.7 and fall on the 85thpercentile (shown by the red dot) andthus Maria would be considered atrisk of overweight. An error in weightcould occur if scales are notadequately maintained, standardprotocol is not followed for weighing,or a recording error is made.10. INTERPRETATIONInterpretation of the plotted BMI-for-age is based on the established cutoff valuespreviously shown. 95th percentile85th to 95th percentile 5th percentileOverweightRisk of overweightUnderweightThese percentiles indicate the rank of BMI in a group of 100 children of the samegender and age. For example, in a group of 100 children: 5 children will have a BMI-for-age that is at or above the 95th percentile 10 will have a BMI-for-age that is between the 85th and 95th percentiles 5 will have a BMI-for-age less than the 5 percentile, and 80 children will have a BMI-for-age that is within the normal range.
CDC: Safer - Healthier - People 17When assessing physical growth, it is desirable to have a series of accurate measurementsto establish an observed growth pattern. Having a series of measurements takes intoconsideration short- and longer-term conditions and provides a context for individualmeasurements in interpretation.Growth patterns that fall outside the established parameters, the 5th and 95th percentile forany given anthropometric indices, suggest the need to recheck measurements, plots, andcalculations and make any necessary corrections or adjustments. If measurements arecorrect, further evaluation is needed to determine the cause.11. SUMMARY BMI-for-age is the method recommended for screening overweight andunderweight in children and adolescents from 2 to 20 years of age. BMI-for-age is a screening tool that may lead to further assessment todiagnose a specific health condition. For children, BMI is age and gender specific and nutritional status isidentified based on percentiles. For adults, BMI is neither age nor genderspecific and nutritional status is defined by fixed cut points. Periodic, accurate measurements and growth records are importantelements of growth screening. An accurate interpretation of growthdepends on the accuracy of weighing and measuring.12. STEPS TO PLOT AND INTERPRET BMI-FOR-AGEThe six steps outlined here to plot and interpret BMI-for-age are similar to those used for ageneral growth assessment.Step 1: Obtain accurate weights and height measurementsStep 2: Select the appropriate growth chart(based on the age and gender of the child being weighed and measured)Step 3: Record the dataStep 4: Calculate BMIStep 5: Plot measurementsStep 6: Interpret the plotted measurementsAn instruction sheet on Using and Interpreting the CDC Growth Charts contains detailedinstructions for the above steps.Example Case Study
CDC: Safer - Healthier - People 18The following case is an example of an anthropometric assessment of "Sam’s" physicalgrowth using the steps recommended to determine, plot and interpret BMI-for-age. You canchoose to view this example using the metric system or the English system.PLOTTING AND INTERPRETING BMI-FOR-AGE USING THE METRIC SYSTEMA Case Study of ‘Sam’Step 1. Obtain accurate weights and height measurementsDate of Birth (DOB): 9/15/94Date of Visit (DOV): 4/4/98Weight 16.9 kgHeight 105.4 cmStep 2. Select the appropriate growth chartBecause Sam is a normal 3.5 years old, a standing height was obtained. The appropriatechart to use is the ‘Boys 2 to 20 BMI-for-age’ chart.Step 3. Record the dataOn the data entry table found on the clinical growth chart, information relevant to thegrowth chart is recorded. Here data has been recorded for the date of visit, the child’s age,weight and height at the visit.DateAgeWeightStature4/4/983.5 yrs16.9 kg105.4 cmBMIStep 4. Calculate BMICalculate BMI at the time of the clinic visit.BMI (weight / height / height) x 10,000BMI: (16.9 kg/ 105.4 cm/ 105.4 cm) x 10,000 15.2Then the BMI of 15.2 is entered on the data entry table.DateAgeWeightStatureBMI4/4/983.5 yrs16.9 kg105.4 cm15.2Step 5. Plot measurementsAll the necessary information is recorded and Sam’s BMI can be plotted. On the BMI-for-agechart, find Sam’s age on the horizontal axis and visually draw a vertical line up from that
CDC: Safer - Healthier - People 19point. Then find his BMI on the vertical axis and visually draw a horizontal line across fromthat point. The point where the two intersect represents Sam’s BMI-for-age.When plotted on the growth chart, Sam’s BMI-for-age falls just below the 25th percentilecurve.Step 6. Interpret the plotted measurementsSince Sam’s BMI-for-age falls just below the 25th percentile curve, this means that of 100children with the same gender and age as Sam’s, fewer than 25 children have a BMI-for-agelower than his and more than 75 have a BMI-for-age higher than his. Sam is notoverweight, underweight or at risk of overweight.When a child’s plotted measurement falls between the 5th and 85th percentiles it isconsidered to be within the normal range. Sam’s BMI-for-age is in the normal range basedon this measurement.PLOTTING AND INTERPRETING BMI-FOR-AGE USING THE ENGLISH SYSTEMA Case Study of ‘Sam’Step 1. Obtain accurate weights and height measurementsDate of Birth (DOB): 9/15/94Date of Visit (DOV): 4/4/98Weight: 37 pounds 4 ouncesHeight: 41 1/2 inchesStep 2. Select the appropriate growth chartBecause Sam is a normal 3.5 years old, a standing height was obtained. The appropriatechart to use is the ‘Boys 2 to 20 BMI-for-age’ chart.Step 3. Record the data
CDC: Safer - Healthier - People 20On the data entry table found on the clinical growth chart, information relevant to thegrowth chart is recorded. Here data has been recorded for the date of visit, the child’s age,weight and height at the visit.DateAgeWeightStature4/4/983.5 yrs37.25 lbs41.5 inBMIStep 4. Calculate BMICalculate BMI at the time of the clinic visit.Convert ounces and fractions to decimals:Weight of 37 lbs and 4oz 37.25 lbs (16 ounces 1 pound so 4oz/12 oz 0.25).Height 41.5 inBMI (weight / height / he
Full text is included in the Appendix. CDC: Safer - Healthier - People 6 4. CHARACTERISTICS OF BMI-FOR-AGE The shape of the weight-for-stature curve versus the BMI-for-age curve The shapes of the weight-for-stature and the BMI-for-age growth curves differ, as you can see. The weight-for-stature curve shows how weight increases in relation .