Transcription
2009 Investment CompanyFact Book49 th editionA Review of Trends and Activity in the Investment Company Industrywww.icifactbook.org
significant events forFunds in the Financial Crisis2007AUGUST 14, 2007 »Sentinel Management Group closes a commodity cash fund,mistakenly identified in the media as a money market fund.AUGUST 2007 »Investors added 157 billion in new cash to money market funds,the second largest inflow since 1984.2008JANUARY 17, 2008 »A Securities and Exchange Commission sweep of money marketfunds for structured investment vehicle holdings is reported.JANUARY 18, 2008 »Credit rating agencies start to downgrade bond insurers.JANUARY 24, 2008 »Reports surface of failed auctions for auction-rate securities (ARS).JANUARY 2008 »Executive Committee of ICI Board of Governors establishes a taskforce of senior industry executives to monitor the credit crisis impacton money market funds.Investors added 159 billion in new cash to money market funds,the largest inflow since 1984.FEBRUARY 14, 2008 »More than 80 percent of ARS auctions fail; major banks declarethe market frozen.MARCH 11, 2008 »Federal Reserve makes 200 billion available to banks through anewly created securities lending facility.MARCH 16, 2008 »The Bear Stearns Company is sold to JPMorgan Chase with 29 billion in federal assistance.JUNE 2008 »Securities and Exchange Commission and Department of theTreasury grant relief on liquidity-protected preferred shares torefinance closed-end funds’ auction-market preferred shares.JULY 2008 »Fannie Mae and Freddie Mac shares fall sharply on estimates of largecapital needs.AUGUST 2008 »Financial institutions begin entering into agreements to buy back ARS.SEPTEMBER 7, 2008 »Fannie Mae and Freddie Mac placed in federal conservatorship.SEPTEMBER 15, 2008 »Lehman Brothers Holdings Inc. declares bankruptcy.Bank of America agrees to acquire Merrill Lynch for 50 billion.(continued inside back cover)
2009 Investment CompanyFact Book49 th editionA Review of Trends and Activity in the Investment Company Industrywww.icifactbook.org
The Investment Company Institute (ICI) is the national association of U.S. investment companies. ICI seeks to encourageadherence to high ethical standards, promote public understanding, and otherwise advance the interests of funds, theirshareholders, directors, and advisers.Although information or data provided by independent sources is believed to be reliable, ICI is not responsible for its accuracy,completeness, or timeliness. Opinions expressed by independent sources are not necessarily those of the Institute. If you havequestions or comments about this material, please contact the source directly.Forty-Ninth EditionISBN 1-878731-46-7Copyright 2009 by the Investment Company Institute
Table of ContentsA LETTER FROM ICI’S CHIEF ECONOMIST . . . . . . . . . . . . . . . . . . . . . . . . . . . . . . . . . . . . . . . . . 2ICI RESEARCH: STAFF AND PUBLICATIONS. . . . . . . . . . . . . . . . . . . . . . . . . . . . . . . . . . . . . . . . . 4Part 1: Analysis and Statistics . . . . . . . . . . . . . . . . . . . . . . . . . . . . . . . . . . . . . . . . . . . . . . . . . . 6SECTION 1: OVERVIEW OF U.S.-REGISTERED INVESTMENT COMPANIES . . . . . . . . . . . . . . . . . . . . . . 6SECTION 2: RECENT MUTUAL FUND TRENDS . . . . . . . . . . . . . . . . . . . . . . . . . . . . . . . . . . . . . . . .18SECTION 3: EXCHANGE-TRADED FUNDS . . . . . . . . . . . . . . . . . . . . . . . . . . . . . . . . . . . . . . . . . . 38SECTION 4: CLOSED-END FUNDS . . . . . . . . . . . . . . . . . . . . . . . . . . . . . . . . . . . . . . . . . . . . . . . 50SECTION 5: MUTUAL FUND FEES AND EXPENSES . . . . . . . . . . . . . . . . . . . . . . . . . . . . . . . . . . . . 58SECTION 6: CHARACTERISTICS OF MUTUAL FUND OWNERS . . . . . . . . . . . . . . . . . . . . . . . . . . . . 70SECTION 7: THE ROLE OF MUTUAL FUNDS IN RETIREMENT AND EDUCATION SAVINGS . . . . . . . . . . 84Part 2: Data Tables . . . . . . . . . . . . . . . . . . . . . . . . . . . . . . . . . . . . . . . . . . . . . . . . . . . . . . . . .106LIST OF DATA TABLES . . . . . . . . . . . . . . . . . . . . . . . . . . . . . . . . . . . . . . . . . . . . . . . . . . . . . . .106SECTION 1: U.S. MUTUAL FUND TOTALS . . . . . . . . . . . . . . . . . . . . . . . . . . . . . . . . . . . . . . . . . . 110SECTION 2: CLOSED-END FUNDS, EXCHANGE-TRADED FUNDS, AND UNIT INVESTMENT TRUSTS . . . 120SECTION 3: U.S. LONG-TERM MUTUAL FUNDS . . . . . . . . . . . . . . . . . . . . . . . . . . . . . . . . . . . . . . 126SECTION 4: U.S. MONEY MARKET MUTUAL FUNDS . . . . . . . . . . . . . . . . . . . . . . . . . . . . . . . . . .146SECTION 5: ADDITIONAL CATEGORIES OF U.S. MUTUAL FUNDS . . . . . . . . . . . . . . . . . . . . . . . . . . 152SECTION 6: INSTITUTIONAL INVESTORS IN THE U.S. MUTUAL FUND INDUSTRY . . . . . . . . . . . . . . .164SECTION 7: WORLDWIDE MUTUAL FUND TOTALS . . . . . . . . . . . . . . . . . . . . . . . . . . . . . . . . . . . 167Appendices: More Information on Investment Companies . . . . . . . . . . . . . . . . . . . . . . . . . . . 170APPENDIX A: HOW MUTUAL FUNDS AND INVESTMENT COMPANIES OPERATE . . . . . . . . . . . . . . . 170APPENDIX B: ICI STATISTICAL RELEASES AND RESEARCH PUBLICATIONS . . . . . . . . . . . . . . . . . . . . 182APPENDIX C: SIGNIFICANT EVENTS IN FUND HISTORY . . . . . . . . . . . . . . . . . . . . . . . . . . . . . . . .184GLOSSARY . . . . . . . . . . . . . . . . . . . . . . . . . . . . . . . . . . . . . . . . . . . . . . . . . . . . . . . . . . . . . . . . . 186INDEX . . . . . . . . . . . . . . . . . . . . . . . . . . . . . . . . . . . . . . . . . . . . . . . . . . . . . . . . . . . . . . . . . . . .194
A LETTER FROMICI’s Chief EconomistThe fires of the global credit crisis have been burning for nearly two years. What at first appearedas a wisp of smoke in a corner of the U.S. mortgage market turned into a global firestorm thathas since cut through the housing, bond, and stock markets. U.S. households alone have suffered a 13 trillion drop in their financial and housing assets since the crisis started. As homeowners andinvestors survey the damage, they are left to wonder when it will end and how the eventual rebuildingof their lives and their savings will begin. The uncertainty is unsettling, especially after nearly twodecades during which many Americans shared in general economic prosperity and growing wealth.The government’s efforts to contain the damage called upon the analytic skills of private and publicsector experts alike. One of ICI’s core missions is to gather and consolidate information on registeredinvestment companies and their investors to help government officials and the general public betterunderstand market developments. During the credit crisis, the ICI Research Department has workedalongside many other Institute staff to provide data, research, and analysis to policymakers and thepress.A key example is the high-frequency estimates of stock and bond fund flows that we provided topolicymakers in October and November. As the credit crisis pushed beyond housing and into thebroader financial markets, weekly outflows from stock and bond funds began to accelerate, reaching1 percent of fund assets in mid-October. Policymakers, wanting to stay abreast of these developments,sought out accurate and timely information on investor flows, and ICI provided them with steadyupdates. Many member firms, along with the press, were also seeking a more contemporaneousmeasure of fund flows than what ICI provided through our monthly Trends report. The desire for higherfrequency data led ICI to launch a new weekly public release of stock and bond fund flow estimatesin January 2009.Policymakers continue to watch over and support the financial markets. But they also are beginning tosift through the ashes to see what they can learn as they reexamine the rules and regulations that serveas the financial industry’s fire code. The lessons that they draw and the rule changes that they make willshape the financial and regulatory landscape for another generation or more.The regulatory overview includes how the money market will operate in the future and the role thatmoney market funds will play after the near-freeze in that market last fall.To participate in the public dialogue, ICI established the Money Market Working Group in November2008. This panel of fund industry leaders conducted a wide-ranging study of the money market, moneymarket funds, and other participants in that market with the assistance of ICI staff.22009 INVESTMENT COMPANY FACT BOOK
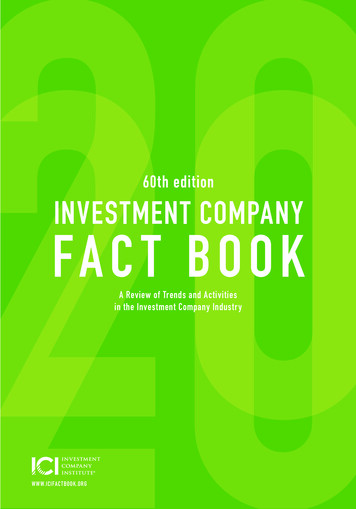
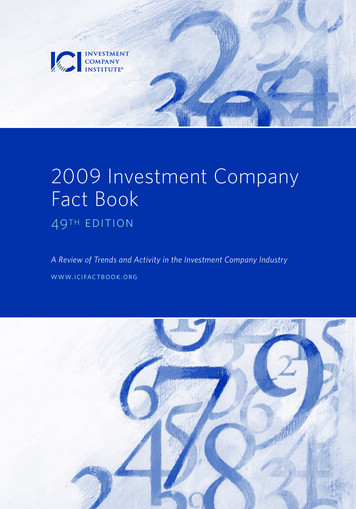
SPREAD BETWEEN THREE-MONTH LIBOR AND OVERNIGHT INDEX SWAP RATE*BASIS POINTS, DAILY, JANUARY 2007–DECEMBER 2008September 15400350300250200150100500Mar 2007Jun 2007Sep 2007Dec 2007Mar 2008Jun 2008Sep 2008Dec 2008*Ninety-day LIBOR (London Interbank Offered Rate) less the 90-day Overnight Index Swap (OIS) rate. An OIS is an interest rate swapwith the floating rate tied to an index of daily overnight rates, such as the effective federal funds rate. At maturity, two parties exchange,on the basis of the agreed notional amount, the difference between interest accrued at the fixed rate and interest accrued by averagingthe floating, or index, rate.Source: BloombergThe Report of the Money Market Working Group, released in March 2009, forms an important part ofthe public record and discourse about the future regulation of money market funds and their role inthe financial markets. It draws on the difficult experience of the last year and develops a series ofrecommendations designed to make money market funds more resilient in the face of extreme marketconditions. The proposals address a variety of issues, but taken together will increase the liquidityof money market funds and reduce the credit and interest rate risk that investors in these funds willexperience.We are in an environment in which investors, regulators, and legislators have a dramatically reducedtolerance for risk. Rules and regulations can provide additional investor protections, but can also reducemarket efficiency at a great cost to borrowers and investors alike. Finding the right balance is thechallenge, and is one that necessitates a wide-ranging discussion of proposals on the table. Our roleas economists and researchers is to engage in this discussion on behalf of funds and their investors.This dialogue fleshes out strengths and weaknesses of proposals before they are enacted.While these efforts become all the more focused during periods of market stress, our ability to assistdraws upon data collection and research that are part of our normal activities. The annual exercise ofwriting the Investment Company Fact Book, for example, hones our understanding of the markets andfund investors. The project is also a collaborative effort across the research, legal, editorial, and designgroups within ICI, and this joint experience is what was leveraged during the events of the past twoyears. I hope that this year’s volume is as valuable to the reader as it is to the staff who worked to bringit together.Brian ReidInvestment Company InstituteMay 2009As Chief Economist, Brian Reid leads the Institute’s Research Department and is a member of the Institute’ssenior management team.2009 INVESTMENT COMPANY FACT BOOK3
ICI RESEARCHStaff and PublicationsICI Senior Research StaffCHIEF ECONOMIST » Brian Reid leads the Institute’s Research Department. Thedepartment serves as a source for statistical data on the investment companyindustry and conducts public policy research on fund industry trends, shareholderdemographics, the industry’s role in U.S. and foreign financial markets, and theretirement market. Prior to joining ICI in 1996, Reid served as an economist at theFederal Reserve Board of Governors. He has a PhD in economics from the Universityof Michigan and a BS in economics from the University of Wisconsin–Madison.INDUSTRY AND FINANCIAL ANALYSIS » Sean Collins, Senior Director of Industryand Financial Analysis, heads ICI’s research on the structure of the mutual fundindustry, industry trends, and the broader financial markets. Collins, who joined ICI in2000, is responsible for conducting and overseeing research on the flows, assets, andfees of mutual funds, as well as a major recent research initiative to better understandthe costs and benefits of laws and regulations governing mutual funds. Prior to joiningICI, Collins was a staff economist at the Federal Reserve Board of Governors and atthe Reserve Bank of New Zealand. He has a PhD in economics from the University ofCalifornia, Santa Barbara, and a BA in economics from Claremont McKenna College.RETIREMENT AND INVESTOR RESEARCH » Sarah Holden, Senior Director ofRetirement and Investor Research, leads the Institute’s research efforts on investordemographics and behavior, retirement and tax policy, and international issues.Holden, who joined ICI in 1999, conducts and oversees research on the U.S.retirement market, retirement and tax policy, and the worldwide mutual fundindustry. She leads ICI efforts to track trends in household retirement saving activityand ownership of funds and other investments inside and outside retirementaccounts. Prior to joining ICI, Holden served as an economist at the Federal ReserveBoard of Governors. She has a PhD in economics from the University of Michigan anda BA in mathematics and economics from Smith College.STATISTICAL RESEARCH » Judy Steenstra, Senior Director of Statistical Research,oversees the collection and publication of weekly, monthly, quarterly, and annual dataon open-end mutual funds, as well as data on closed-end funds, exchange-tradedfunds, unit investment trusts, and the worldwide mutual fund industry. Steenstrajoined ICI in 1987 and was appointed Director of Statistical Research in 2000. Shehas a BS in marketing from The Pennsylvania State University.42009 INVESTMENT COMPANY FACT BOOK
ICI Research Department StaffThe ICI Research Department consists of 41 staff members, including economists, research assistants,policy analysts, and data assistants. This staff collected and disseminated data for all types of registeredinvestment companies and published 16 public policy reports in 2008 offering detailed analyses of fundshareholders, the economics of investment companies, and the retirement and education savings markets.2008 ICI Statistical and Research PublicationsIn 2008, the Institute’s Research Department released more than 100 statistical reports examining thebroader investment company industry as well as specific segments of the industry: money market funds,closed-end funds, exchange-traded funds, and unit investment trusts. ICI also regularly compiles andreleases specialized statistical reports that measure mutual funds in the retirement, institutional, andworldwide markets. See Appendix B on page 182 for a more detailed description of ICI’s regular statisticalreleases and about how to obtain copies of these releases.INDUSTRY AND FINANCIAL ANALYSIS RESEARCH PUBLICATIONS» “Proxy Voting by Registered Investment Companies: Promoting the Interests of Fund Shareholders,”Perspective, July 2008» Cost-Benefit Analysis of the Summary Prospectus Proposal, February 2008INVESTOR RESEARCH PUBLICATIONS» “Ownership of Mutual Funds, Shareholder Sentiment, and Use of the Internet,” Fundamentals,December 2008» Equity and Bond Ownership in America, 2008, December 2008» “Ownership of Mutual Funds Through Professional Financial Advisers, 2007,” Fundamentals,September 2008» Profile of Mutual Fund Shareholders, April 2008» “Characteristics of Mutual Fund Investors, 2007,” Fundamentals, April 2008» Investor Views on the U.S. Securities and Exchange Commission’s Proposed Summary Prospectus,March 2008RETIREMENT AND TAX RESEARCH PUBLICATIONS» “The U.S. Retirement Market, Second Quarter 2008,” Fundamentals, December 2008» Retirement Saving in Wake of Financial Market Volatility, December 2008» “The Economics of Providing 401(k) Plans: Services, Fees, and Expenses, 2007,” Fundamentals,December 2008» “401(k) Plan Asset Allocation, Account Balances, and Loan Activity in 2007,” Perspective,December 2008» Defined Contribution Plan Distribution Choices at Retirement, October 2008» “Who Gets Retirement Plans and Why,” Perspective, September 2008» “The U.S. Retirement Market, 2007,” Fundamentals, July 2008» “The Role of IRAs in U.S. Households’ Saving for Retirement,” Fundamentals, January 2008A complete, updated list of ICI research publications is available on the Institute’s website.AcknowledgementsPublication of the 2009 Investment Company Fact Book was directed by Rochelle Antoniewicz, SeniorEconomist, working with Miriam Moore, Senior Editor, and Jodi Kessler, Director, Design.2009 INVESTMENT COMPANY FACT BOOK5
investment companies held one-third ofU.S. Municipal Securities in 200833%of municipal securitiesheld by investmentcompanies
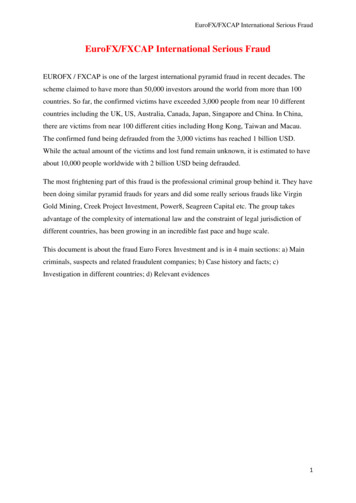
SECTION 1:Overview of U.S.Registered InvestmentCompaniesU.S.-registered investment companies play a significant role in the U.S. economy and worldfinancial markets. These funds managed more than 10 trillion in assets at the end of 2008for 93 million U.S. investors. Funds supplied investment capital in securities markets aroundthe world and were among the largest group of investors in the U.S. stock, commercialpaper, and municipal securities markets.
SECTION 1: OVERVIEW OF U.S.-REGISTERED INVESTMENT COMPANIESthis section provides a broad overview of u.s.-registered investment companies—mutualfunds, closed-end funds, exchange-traded funds, and unit investment trusts—and theirsponsors.Investment Company Assets in 2008. . . . . . . . . . . . . . . . . . . . . . . . . . . . . . . . . . . . . . . . . . . . . . . . . . . . . . . . . . . . . . 8Americans’ Continued Reliance on Investment Companies. . . . . . . . . . . . . . . . . . . . . . . . . . . . . . . . . . . . . . . . . . . 8Role of Investment Companies in Financial Markets . . . . . . . . . . . . . . . . . . . . . . . . . . . . . . . . . . . . . . . . . . . . . . . . . 11Number of Investment Companies and Types of Intermediaries . . . . . . . . . . . . . . . . . . . . . . . . . . . . . . . . . . . . . 12Investment Company Employment . . . . . . . . . . . . . . . . . . . . . . . . . . . . . . . . . . . . . . . . . . . . . . . . . . . . . . . . . . . . . . . 16Investment Company Assets in 2008U.S.-registered investment companies managed 10.3 trillion at year-end 2008 (Figure 1.1), a 2.6 trillion decrease from year-end 2007. Major U.S. stock price indexes declined about 40 percentduring the year, significantly lowering total net assets of funds invested in domestic equity markets.Declines in stock prices abroad had a similar effect on funds invested in foreign stocks. U.S. stock andbond funds holding international assets decreased further from the strengthening of the U.S. dollarand the resulting decrease in the dollar value of foreign securities. Including funds offered in foreigncountries, worldwide mutual fund assets decreased by 7.2 trillion to 19.0 trillion as of year-end 2008.The decline in the value of U.S. fund assets was tempered somewhat by new investments. Shareholdersadded 411 billion in new cash to mutual funds in 2008 and reinvested 214 billion of income dividendsthat mutual funds distributed during the year. Although investors pulled 234 billion from stock fundsas negative stock market returns reduced demand for these funds, these outflows were offset by stronginflows to fixed-income funds as investor concerns about the global economy and inflows from othercash investments boosted flows (into money market funds in particular). Other types of registeredinvestment companies experienced mixed results in investor demand. Flows into exchange-traded funds(ETFs) continued to expand, with net share issuance (including reinvested dividends) reaching a record 177 billion. Unit investment trusts (UITs) had gross issuance of 24 billion, while closed-end fundsissued only 329 million in new shares during 2008.Americans’ Continued Reliance on Investment CompaniesHouseholds are the largest group of investors in funds, and registered investment companies managed19 percent of households’ financial assets at year-end 2008 (Figure 1.2). This share is down from 2007,reflecting the drop in the value of stocks held in equity and hybrid funds. Nevertheless, the share ofhousehold assets held in funds remained above levels seen in the early 1990s. As households haveincreased their reliance on funds, their demand for directly held stocks and bonds has grown moreslowly. For example, over the period 2004 to 2008, households purchased, on net, a total of 2.4 trillionin mutual funds (including through variable annuities), ETFs, and closed-end funds, while they sold 2.5 trillion of directly held stock (Figure 1.3). Much of this shift by households toward funds has beenthrough net purchases of mutual funds.The growth of 401(k) and other defined contribution (DC) plans and the important role that mutualfunds play in these plans explain some of households’ heavier reliance on investment companies during82009 INVESTMENT COMPANY FACT BOOK
SECTION 1: OVERVIEW OF U.S.-REGISTERED INVESTMENT COMPANIESFIGURE 1.1INVESTMENT COMPANY TOTAL NET ASSETS BY TYPEBILLIONS OF DOLLARS, YEAR-END, 1995–2008Mutual funds1Closed-end fundsETFs2UITsTotal 31995 2,811 143 1 73 03136085312,97420089,6011885312910,3491 Mutualfund data exclude mutual funds that primarily invest in other mutual funds.2 ETF data prior to 2001 were provided by Strategic Insight Simfund; ETF data include investment companies not registered under theInvestment Company Act of 1940 and exclude ETFs that primarily invest in other ETFs.3Total investment company assets include mutual fund holdings of closed-end funds and ETFs.Note: Components may not add to the total because of rounding.Sources: Investment Company Institute and Strategic Insight Simfundthe past two decades. At year-end 2008, 9 percent of household financial assets were invested in401(k) and other DC retirement plans, up from 6 percent in 1990. Mutual funds managed 44 percentof the assets in these plans. Households also have invested in mutual funds outside of DC plans.Individual retirement accounts (IRAs) made up 9 percent of household financial assets, and mutualfunds managed 44 percent of IRA assets in 2008. Mutual funds also managed 3.6 trillion of assetsthat households held in taxable accounts.As individuals have increased their reliance on funds, so have nonfinancial businesses and otherinstitutional investors such as life insurance companies and other financial institutions. Manyinstitutions rely on mutual funds to manage a portion of their cash and other short-term assets. Moneymarket funds geared toward institutional investors attracted 525 billion in new cash during 2008.Increased economic uncertainty during the year and ongoing turmoil in the money markets encouragedthese investors to increase their holdings of money market funds, especially those funds invested inTreasury and government agency debt. Part of the increased demand came from some investors movingtheir cash holdings into money market funds and out of unregistered cash pools and direct investmentsin money market instruments. By the end of the year, for example, nonfinancial businesses held a record32 percent of their cash in money market funds.2009 INVESTMENT COMPANY FACT BOOK9
SECTION 1: OVERVIEW OF U.S.-REGISTERED INVESTMENT COMPANIESFIGURE 1.2SHARE OF HOUSEHOLD FINANCIAL ASSETS HELD IN INVESTMENT COMPANIESPERCENTAGE, YEAR-END, 042008Sources: Investment Company Institute and Federal Reserve BoardFIGURE 1.3HOUSEHOLD NET PURCHASES OF FINANCIAL ASSETS1BILLIONS OF DOLLARS, eldstockDirectlyheldbonds31 NewU.S. bankdepositsGovernment Non–mutualpensions fund privateDC pensioncash and reinvested dividends are included.funds (including variable annuities), closed-end funds, and ETFs are included.3 Commercial paper and seller-financed mortgages are included.4 Net acquisition of assets in the form of equity in noncorporate business, DB plans, foreign deposits, security credit, reserves for certainlife insurance policies, and other miscellaneous assets are included.Sources: Investment Company Institute and Federal Reserve Board2 Mutual102009 INVESTMENT COMPANY FACT BOOK
SECTION 1: OVERVIEW OF U.S.-REGISTERED INVESTMENT COMPANIESInstitutional investors have also contributed to the growing demand for ETFs. Investment managers,including mutual funds and pension funds, use ETFs to manage liquidity. This strategy allows them tokeep fully invested in the market while holding a highly liquid asset to manage their investor flows. Assetmanagers also use ETFs as part of their investment strategies, including as a hedge for their exposure toequity markets.For more statistics on investment companies, see the Data Tables listed on pages 106–109.Role of Investment Companies in Financial MarketsInvestment companies have been among the largest investors in the domestic financial markets formuch of the past 15 years and held a significant portion of the outstanding shares of U.S.-issued stocks,bonds, and money market securities at year-end 2008. Investment companies as a whole were thelargest group of investors in U.S. companies, holding 27 percent of their outstanding stock at year-end2008 (Figure 1.4).Investment companies also held the largest share of U.S. commercial paper—an important sourceof short-term funding for major U.S. and foreign corporations. Money market funds account for themajority of funds’ commercial paper holdings, and the share of outstanding commercial paper thesefunds hold tends to fluctuate with investor demand for money market funds and the overall supply ofcommercial paper. During the second half of 2007 and early 2008, when money market funds hadstrong cash inflows, their holdings of commercial paper rose, along with their holdings of Treasury andagency securities, certificates of deposit, and other money market instruments.FIGURE 1.4INVESTMENT COMPANIES CHANNEL INVESTMENT TO STOCK, BOND, ANDMONEY MARKETSPERCENTAGE OF TOTAL MARKET SECURITIES HELD BY INVESTMENT COMPANIES, YEAR-END 2008Other registered investment companiesMutual funds4433274241598U.S. corporateequity1U.S. and foreigncorporate bonds344 0.53015U.S. Treasuryand governmentagency securitiesU.S. municipalsecuritiesCommercialpaperNote: Components may not add to the total because of rounding.Sources: Investment Company Institute, Federal Reserve Board, and World Federation of Exchanges2009 INVESTMENT COMPANY FACT BOOK11
SECTION 1: OVERVIEW OF U.S.-REGISTERED INVESTMENT COMPANIESAs the financial crisis intensified in 2008, increased uncertainty about firms’ credit quality, higherdemand for money market funds invested only in Treasury and government agency debt, and a severelack of liquidity in the commercial paper market prompted many money market funds to reduce theirpurchases of commercial paper. In addition, some money market funds utilized the Federal Reserve’sAsset-Backed Money Market Mutual Fund Liquidity Facility and sold asset-backed commercial paperin September 2008. During the last three months of the year, money market funds increased theirholdings of commercial paper considerably, largely in response to government programs seeking tofoster liquidity in the commercial paper market and the money market in general. Nevertheless, holdingsof commercial paper by money market funds at year-end 2008 were still moderately below those ofyear-end 2007. Over the same period, total outstanding commercial paper declined by 11 percent asinvestor demand for asset-backed commercial paper and financial commercial paper dropped sharply.This percentage decline in the overall supply of commercial paper just about offset the percentagereduction in money market funds’ holdings of commercial paper. As a result, mutual funds’ share ofthe commercial paper market edged down to 44 percent at year-end 2008, from 45 percent atyear-end 2007.At year-end 2008, investment companies held 33 percent of tax-exempt debt issued by U.S.municipalities, which is on par with direct household ownership. Funds’ share of the tax-exempt markethas risen only slightly in the past several years despite the strong flows into these funds, as the overallsupply of tax-exempt debt has grown. Funds held 15 percent of U.S. Treasury and government agencysecurities at year-end 2008. Funds played a more modest role in the corporate bond market, but stillheld approximately 9 percent of the outstanding debt securities in this market.Number of Investment Companies and Types of IntermediariesIn 2008, there were nearly 700 financial firms from around the world that competed in the U.S. marketto provide investment management services to fund investors. Sixty percent of U.S. fund and trustsponsors were independent fund advisers (Figure 1.5), and these sponsors managed more than half ofinvestment company assets. Banks, thrifts, insurance companies, brokerage firms, and non-U.S. fundadvisers are other types of fund sponsors in the U.S. marketplace.Historically, low barriers to entry have attracted a large number of investment company sponsors to thefund marketplace in the United States. These low barriers to entry led to a rapid increase in the numberof fund sponsors in the 1980s and 1990s. However, competition among these sponsors and pressurefrom other financial products have reversed this trend. About 400 fund advisers left the fund businessover the period 2000 to 2008; in the same time, about 300 new firms entered (Figure 1.6). The overalleffect has been a net reduc
2 2009 INVESTMENT COMPANY FACT BOOK A LETTER FROM ICI's Chief Economist The fi res of the global credit crisis have been burning for nearly two years. What at fi rst appeared as a wisp of smoke in a corner of the U.S. mortgage market turned into a global fi restorm that has since cut through the housing, bond, and stock markets.