Transcription
Scale-up x Scale-out: A Case Study using Nutch/LuceneMaged Michael, José E. Moreira, Doron Shiloach, Robert W. WisniewskiIBM Thomas J. Watson Research CenterYorktown Heights, NY 10598-0218{magedm, jmoreira, doron, bobww}@us.ibm.comAbstractScale-up solutions in the form of large SMPs haverepresented the mainstream of commercial computingfor the past several years. The major server vendorscontinue to provide increasingly larger and morepowerful machines. More recently, scale-out solutions,in the form of clusters of smaller machines, havegained increased acceptance for commercialcomputing. Scale-out solutions are particularlyeffective in high-throughput web-centric applications.In this paper, we investigate the behavior of twocompeting approaches to parallelism, scale-up andscale-out, in an emerging search application. Ourconclusions show that a scale-out strategy can be thekey to good performance even on a scale-up machine.Furthermore, scale-out solutions offer betterprice/performance, although at an increase inmanagement complexity.1. IntroductionDuring the last 10 years of commercial computing,we have witnessed the complete replacement ofuniprocessor computing systems by multiprocessorones. The revolution that started in the early to mideighties in scientific and technical computing finallycaught up with the bulk of the marketplace in the midnineties.We can classify the different approaches to employmultiprocessor systems for computing (bothcommercial and technical/scientific) into two largegroups: Scale-up: The deployment of applications on largeshared-memory servers (large SMPs). Scale-out: The deployment of applications onmultiple small interconnected servers (clusters).1-4244-0910-1/07/ 20.00 2007 IEEEDuring the first phase of the multiprocessorrevolution in commercial computing, the dominance ofscale-up was clear. SMPs of increasing size, withprocessors of increasing clock rate, could offer evermore computing power to handle the needs of even thelargest corporations. SMPs currently represent themainstream of commercial computing. Companies likeIBM, HP and Sun invest heavily in building bigger andbetter SMPs with each generation.More recently, there has been an increase in interestin scale-out for commercial computing. For many of thenew web-based enterprises (e.g., Google, Yahoo, eBay,Amazon), a scale out approach is the only way todeliver the necessary computational power. Also,computer manufacturers have made it easier to deployscale-out solutions with rack-optimized and bladedservers. (Scale-out has been the only viable alternativefor large scale technical scientific computing for severalyears, as we observe in the evolution of the TOP500systems [10].)In this paper, we study the behavior of an emergingcommercial application, search of unstructured data, intwo distinct systems: One is a modern scale-up systembased on the POWER5 multi-core/multi-threadedprocessor [8],[9]. The other is a typical scale-outsystem based on IBM BladeCenter [3]. The systemswere configured to have approximately the same listprice (approximately 200,000), allowing a fairperformance and price-performance comparison.One of the more important conclusions of our workis that a “pure” scale-up approach is not very effectivein using all the processors in a large SMP. In purescale-up, we run just one instance of our application inthe SMP, and that instance uses all the resources(processors) available. We were more successful inexploiting the POWER5 SMP with a “scale-out-in-abox” approach. In that case, multiple instances of theapplication run concurrently, within a single operating
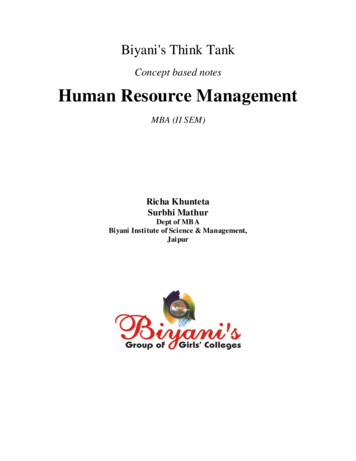
system. This latter approach resulted in significantgains in performance while maintaining the singlesystem image that is one of the great advantages oflarge SMPs.Another conclusion of our work is that a scale-outsystem can achieve about four times the performance ofa similarly priced scale-up system. In the case of ourapplication, this performance is measured in terms ofqueries per second. The scale-out system requires theuse of multiple system images, so the gain inperformance comes at a convenience and managementcost. Depending on the situation, that may be worth theimprovement in performance or not.The rest of this paper is organized as follows.Section 2 describes the configuration of the scale-outand scale-up systems we used in our study. Section 3presents the Nutch/Lucene workload that ran in oursystems. Section 4 reports our experimental findings.Finally, Section 5 presents our conclusions.2. Scale-up and scale-out systemsIn the IBM product line, Systems z, p, and i are allbased on SMPs of different sizes that span a widespectrum of computational capabilities. As an exampleof a state-of-the art scale-up system we adopted thePOWER5 p5 575 machine [7]. This 8- or 16-waysystem has been very attractive to customers due to itslow-cost, high-performance and small form factor (2Uor 3.5-inch high in a 24-inch rack). A picture of aPOWER5 p5 575 is shown in Figure 1.Figure 1: The POWER5 p5 575 SMP server.The particular p5 575 that we used for our scale-upmeasurements has 16 POWER5 processors in 8 dualcore modules and 32 GiB (1 GiB 1,073,741,824bytes) of main memory. Each core is dual-threaded, soto the operating system the machine appears as a 32way SMP. The processor speed is 1.5 GHz. The p5 575connects to the outside world through two (2) Gigabit/sEthernet interfaces. It also has its own dedicatedDS4100 storage controller. (See below for adescription of the DS4100.)Scale-out systems come in many different shapesand forms, but they generally consist of multipleinterconnected nodes with a self-contained operatingsystem in each node. We chose BladeCenter as ourplatform for scale-out. This was a natural choice giventhe scale-out orientation of this platform.The first form of scale-out systems to becomepopular in commercial computing was the rackmounted cluster. The IBM BladeCenter [3],[5]solution(and similar systems from companies such as HP andDell) represents the next step after rack-mountedclusters in scale-out systems for commercial computing.The blade servers [6] used in BladeCenter are similar incapability to the densest rack-mounted cluster servers:4-processor configurations, 16-32 GiB of maximummemory, built-in Ethernet, and expansion cards foreither Fiber Channel, Infiniband, Myrinet, or 10 Gbit/sEthernet. Also offered are double-wide blades with upto 8-processor configurations and additional memory.Figure 2 is a high-level view of our clusterarchitecture. The basic building block of the cluster is aBladeCenter-H (BC-H) chassis. We couple each BC-Hchassis with one DS4100 storage controller through a2-Gbit/s Fiber Channel link. The chassis themselves areinterconnected through two nearest-neighbor networks.One of the networks is a 4-Gbit/s Fiber Channelnetwork and the other is a 1-Gbit/s Ethernet network.The cluster consists of 8 chassis of blades (112 bladesin total) and eight DS4100 storage subsystemsThe BladeCenter-H chassis is the newestBladeCenter chassis from IBM. As with the previousBladeCenter-1 chassis, it has 14 blade slots for bladeservers. It also has space for up to two (2) managementmodules, four (4) switch modules, four (4) bridgemodules, and four (4) high-speed switch modules.(Switch modules 3 and 4 and bridge modules 3 and 4share the same slots in the chassis.) We have populatedeach of our chassis with two 1-Gbit/s Ethernet switchmodules and two Fiber Channel switch modules.
Fiber ChannelEthernetBC-H chassis1 GEDS41001 GE4G2G2GFC-SWFC-SW1 GE1 GEFC-SWFC-SW1 GE1 GEFC-SWFC-SW1 GE1 GEFC-SWFC-SW2G2G1G1GFigure 2: Hardware architecture of our BladeCenter cluster.Three different kinds of blades were used in ourcluster: JS21 (PowerPC processors), HS21 (IntelWoodcrest processors), and LS21 (AMD Opteronprocessors). Each blade (JS21, HS21, or LS21) hasboth a local disk drive (73 GB of capacity) and a dualFiber Channel network adapter. The Fiber Channeladapter is used to connect the blades to two FiberChannel switches that are plugged in each chassis.Approximately half of the cluster (4 chassis) iscomposed of JS21 blades. These are quad-processor(dual-socket, dual-core) PowerPC 970 blades, runningat 2.5 GHz. Each blade has 8 GiB of memory. For theexperiments reported in this paper, we focus on theseJS21 blades.The DS4100 storage subsystem consists of dualstorage controllers, each with a 2 Gb/s Fiber Channelinterface, and space for 14 SATA drives in the maindrawer. Although each DS4100 is paired with a specificBladeCenter-H chassis, any blade in the cluster can seeany of the LUNs in the storage system, thanks to theFiber Channel network we implement.3. The Nutch/Lucene workloadNutch/Lucene [4] is a framework for implementingsearch applications. It is representative of a growingclass of applications that are based on search ofunstructured data (web pages). We are all used tosearch engines like Google and Yahoo that operate onthe open Internet. However, search is also an importantoperation within Intranets, the internal networks ofcompanies. Nutch/Lucene is all implemented in Javaand its code is open source. Nutch/Lucene, as a typicalsearch framework, has three major components: (1)crawling, (2) indexing, and (3) query. In this paper, wepresent our results for the query component. Forcompleteness, we briefly describe the othercomponents.Crawling is the operation that navigates andretrieves the information in web pages, populating theset of documents that will be searched. This set ofdocuments is called the corpus, in search terminology.Crawling can be performed on internal networks(Intranet) as well as external networks (Internet).Crawling, particularly in the Internet, is a complexoperation. Either intentionally or unintentionally, manyweb sites are difficult to crawl. The performance ofcrawling is usually limited by the bandwidth of thenetwork between the system doing the crawling and thesystem being crawled.The Nutch/Lucene search framework includes aparallel indexing operation written using theMapReduce programming model [2]. MapReduceprovides a convenient way of addressing an important
(though limited) class of real-life commercialapplications by hiding parallelism and fault-toleranceissues from the programmers, letting them focus on theproblem domain. MapReduce was published by Googlein 2004 and quickly became a de-facto standard for thiskind of workloads. Parallel indexing operations in theMapReduce model works as follows. First, the data tobe indexed is partitioned into segments ofapproximately equal size. Each segment is thenprocessed by a mapper task that generates the (key,value) pairs for that segment, where key is an indexingterm and value is the set of documents that contain thatterm (and the location of the term in the document).This corresponds to the map phase, in MapReduce. Inthe next phase, the reduce phase, each reducer taskcollects all the pairs for a given key, thus producing asingle index table for that key. Once all the keys areprocessed, we have the complete index for the entiredata set.In most search applications, query represents thevast majority of the computation effort. Whenperforming a query, a set of index terms is presented toa query engine, which then retrieves the documents thatbest match that set of terms. The overall architecture ofthe Nutch/Lucene parallel query engine is shown inFigure 3. The query engine part consists of one or morefront-ends, and one or more back-ends. Each back-endis associated with a segment of the complete data set.The driver represents external users and it is also thepoint at which the performance of the query ismeasured, in terms of queries per second dDriverFront-endthroughput measurementFigure 3: Nutch/Lucene query.A query operation works as follows. The driversubmits a particular query (set of index terms) to one ofthe front-ends. The front-end then distributes the queryto all the back-ends. Each back-end is responsible forperforming the query against its data segment andreturning a list with the top documents (typically 10)that better match the query. Each document returned isassociated with a score, which quantifies how good thatmatch is. The front-end collects the response from allthe back-ends to produce a single list of the topdocuments (typically 10 overall best matches). Oncethe front-end has that list, it contacts the back-ends toretrieve snippets of text around the index terms. Onlysnippets for the overall top documents are retrieved.The front-end contacts the back-ends one at a time,retrieving the snippet from the back-end that had thecorresponding document in its data segment.4. Experimental resultsWe present three different kinds of experimentalresults. First, we present performance counter data thatallows us to characterize how applications behave at theinstruction level in our JS21 PowerPC blades. We showthat the behavior of the Nutch/Lucene query is similarto other standard benchmarks in the SPECcpu suite.We then report performance results from runs in ourreference POWER5 p5 575 SMP machine. Wecompare a pure scale-up and a scale-out in a boxconfiguration. Finally, we present scalability resultsfrom runs in the BladeCenter scale-out cluster.4.1. Performance counter dataUsing the PowerPC hardware performance countersand tools from University of Toronto [1], weperformed stall breakdown analysis for theNutch/Lucene query operation. We ran a configurationwith one front-end and one back-end, each on aseparate JS21 blade. The back-end operated on 10 GBof search data. We collected performance data only forthe back-end, since that is the more computationallyintensive component. Performance data was collectedfor a period of 120 seconds during steady-stateoperation of the back-end, and reported second-bysecond.Figure 4 is a plot of number of instructionscompleted per second during the measurement interval,by all four PowerPC processors. We observe that thenumber of instructions completed stays mostly in therange of 5 to 7 billion instructions per second. Sincethere are four (4) PowerPC 970 processors running at2.5 GHz and the PowerPC 970 can complete up to 5instructions per cycle, the maximum completion rate ofthe JS21 is 50 billion instructions per second. Figure 5is a plot of clocks per instruction (CPI) as a function oftime. It is obtained by dividing, for each second, thenumber of cycles executed by all processors (10 billion)by the number of instructions executed during thatsecond (from Figure 4). The CPI stays in the range of1.5-2. We note that most of the CPI values forSPECcpu 2000 in the PowerPC 970, as reported in theliterature [1], are in the range 1-2. We also note that thebest possible CPI for the PowerPC 970 is 0.2.
Figure 4: Instructions executed over timeFigure 5: CPI over time.From the CPI data, we can conclude that (1) the CPIfor query is very far from peak, but (2) it is within whatwould be expected from previous experience withSPEC. More detailed information can be obtainedusing a stall breakdown analysis, as shown in Figure 6.The figure is a plot of the breakdown for each 1 secondperiod during the analysis interval. (We note that ineach second there are a total of 10 billion processorcycles – 4 processors @ 2.5 GHz.) The order of thecomponents in the plot corresponds to the order in thelegend, from bottom to top. Figure 7 shows the averageover time of the data in Figure 6, separated for cycles inuser mode, kernel mode, and total (all).We observe that instruction complete on only 20%of the cycles. (Multiple instructions can complete percycle. Instructions in the PowerPC 970 complete inbundles.) From the average number of instructionsexecuted per second (10 billion cycles/second 1.7cycles per instruction 5.9 billion instructions/second),we conclude that the average bundle size isapproximately 3 instructions (out of a maximum of 5).Figure 6: Stall breakdown for query.Figure 7: Average stall breakdown for query.Another metric we can derive is the non-stall CPIfor query, computed dividing the number of non-stall(completed) cycles by the number of instructions. Thatnumbers comes out at 0.34, which again is very similarto the non-stall CPI for SPECcpu [1].Another important observation is that for asignificant number of cycles ( 25%), the processor isidle. That is, Linux is in its idle loop, without work todo. In principle, we should be able to reduce that idletime by increasing the load on the node. In our moreextensive experiments, we found that we could keep theidle time down to between 10-15%.Finally, we observe that cycles wasted on the I-cacheor on branch mispredictions is relatively small (a fewpercent), stalls due to the fixed-point units account for10% of the cycles, and stalls because of the memoryhierarchy (D-cache, reject, ERAT, and other LSU)represent approximately 20% of the cycles. Thefraction of cycles wasted in the memory hierarchy issimilar to the fraction of cycles doing useful work. Thatmeans that a perfect memory system would only be able
4.2. Experiments in a scale-up systemTo run query on the p5 575, we first configuredNutch/Lucene as shown in Figure 8. We ran a singlefront-end and a single back-end in the machine. Theactual data to be searched was stored in the externalDS4100 storage controller, connected to the p5 575through Fiber Channel. The driver was running on aseparate machine, and we measured the throughput atthe driver.p5 575Front-endp5 575Back-endFront-endDriverBack-enddatathroughput measurementFigure 8: Query on p5 575: pure scale-up.Throughput results for the configuration in Figure 8,for different data set sizes, are shown in Figure 9. Weplot both the absolute queries per second (blue line, lefty-axis) and the more meaningful metric of queries persecond times the data set size (magenta line, right yaxis). We observe that the latter metric peaks at about1100 queries/second*GB, for a data set size of 250 GB.We found these results disappointing, since we hadmeasured the peak value for a JS21 blade (with onlyfour processors) at approximately 900 queries/second*GB.Query throughput x data set size45120040dataBack-enddatadataBack-endthroughput measurementFigure 10: Running query on the POWER5 p5575: scale-out in a box configuration.Throughput results for the configuration in Figure10, for different data set sizes, are shown in Figure 11.We show the results for the pure scale-up and scale-outin-a-box in the same figure so that we can bettercompare them. We see a much improved behavior withthis configuration. The throughput * data set size metricpeaks at approximately 4000 queries/second*GB for adata set size of 250 GB.Query throughput x data set size7045004000603500Queries per secondDriverTo investigate ways to improve the performance ofquery on an SMP, we experimented with theconfiguration shown in Figure 10. In that configurationwe ran multiple back-ends inside the SMP. Each backend is responsible for 10 GB of data. So, a larger dataset will use more back-ends. We call this 150020100010003080025600201540010Q u e r ie s p er s e co n d *G BQ u e rie s p e r s e c o n d3520050010020030040050060070080090001000Data set size (GB)Figure 9: Throughput as a function of data setsize for query on the p5 575: pure scale-up.10Queries per second*GBto at most double the performance of the existingprocessors. A similar benefit could be obtained bydoubling the number of processors and maintaining thememory hierarchy per a set size (GB)Figure 11: Throughput as a function of dataset size for query on the p5 575: pure scale-upand scale-out-in-a-box.
4.3. Scale-out experimentsWe start by reporting results from the experimentsusing the configuration shown in Figure 12. In thisparticular implementation of the architecture shown inFigure 3, there is one front-end running on a JS21 bladeand a variable number of back-ends, each on their ownJS21 blade. The data segment for each back-end isstored in an ext3 file system in the local disk of eachblade.Driverthroughput nddataFigure 12: Configuration with each datasegment in an ext3 file system in the localdisk of each JS21 back-end blade.Throughput measurements (queries per second) as afunction of the number of back-ends are shown inFigure 13 for three different data segment size (perback-end): 10, 20, and 40 GB/back-end. The total dataset size, therefore, varies from 10 GB (one back-endwith 10 GB) to 480 GB (12 back-ends with 40 GBeach). Figure 14 is a plot of the average CPU utilizationin the back-ends as a function of the number of backends. This latter plot shows that the CPUs are wellutilized in this workload. (100% utilization correspondsto all 4 cores in the JS21 running all the time.)Figure 13: Total queries per second as afunction of number of back-ends. Data setson local disk and ext3 file system.Figure 14: average processor utilization in theback-ends as a function of number of backends. Data sets on local disk and ext3 filesystem.We observe in Figure 13 that the throughputincreases with the number of back-ends. At first, this isa surprising result, since as we increase the number ofback-ends, each query is sent to all the back-ends. Wewould expect a flat throughput or maybe evendeclining, as the front-end has to do more work.We can explain the observed behavior as follows.Each query operation has two main phases: the searchfor the indexing terms in the back-ends (including thedistribution and aggregation by the front-end) and theretrieval of the document snippets (including therequests from the front-end). In both of those phases,the work in the front-end is negligible for the size ofsystems we could experiment with. The work per backends is constant with the number of back-ends for thefirst phase, but it actually decreases for the secondphase. Since the total number of snippets retrieved isthe same (10) independent of the number of back-ends,the more back-ends the less average work per back-end.This results in an increase in query throughput with thenumber of back-ends. The increase is less pronouncedwith larger data segment sizes because the back-endwork in the first phase grows with the data size, but thework in the second phase does not change.We also observe in Figure 13 that query throughputdecreases with the data segment size. This behavior isexpected because a larger data segment results in largerindices and more document entries per index term. Thedecrease is less than linear with the increase in datasegment size, so larger sizes are more efficientaccording to the queries/second * data size metric. Thepeak value for that metric, 15840 queries/second*GB,
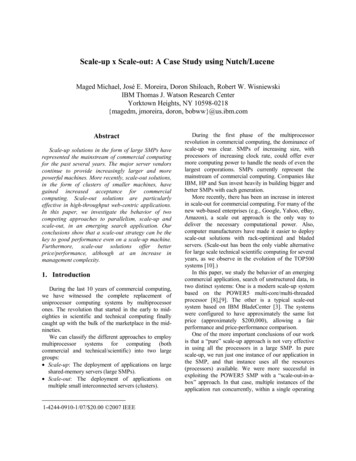
occurs with 12 back-ends and 40 GB/backend. Weadopt this number as the throughput that we can getfrom a BladeCenter chassis populated with JS21blades. (The chassis has 14 blades, out of which we useone for front-end, 12 for back-ends, and one extra forredundancy and other services.)We conclude this section with a comparison ofperformance and cost/performance between ourreference scale-up system (POWER5 p5 575) and ourscale-out solution. Figure 15 shows the value of themetric (throughput * data set size) for two similarlypriced systems: our reference POWER5 p5 575 SMPsystem and one chassis of our BladeCenter cluster withJS21 blades. We see that the peak performance of thescale out solution (BladeCenter) is approximately 4times better.Query throughput vs. data set sizeQ u er ies p er se co n d * G B o f d ata1800016000140001200010000p5 575BC-H JS2180006000400020000020040060080010001200Data set size (GB)Figure 15: Comparison of two similarly priced(IBM list price) systems: a POWER5 p5 575(scale-up) and a fully configured JS21BladeCenter (scale-out).5. ConclusionsThe first conclusion of our work is that scale-outsolutions have an indisputable performance andprice/performance advantage over scale-up for searchworkloads. The highly parallel nature of this workload,combined with a fairly predictable behavior in terms ofprocessor, network and storage scalability, makessearch a perfect candidate for scale-out.Furthermore, even within a scale-up system, it wasmore effective to adopt a “scale-out-in-a-box” approachthan a pure scale-up to utilize its processors efficiently.This is not too different from what has been observedin large shared-memory systems for scientific andtechnical computing. In those machines, it is often moreeffective to run an MPI (scale-out) application withinthe machine than relying on shared-memory (scale-up)programming.Scale-out systems are still in a significantdisadvantage with respect to scale-up when it comes tosystems management. Using the traditional concept ofmanagement cost being proportional to the number ofimages, it is clear that a scale-out solution will have ahigher management cost than a scale-up one.References[1] R. Azimi, M. Stumm, and R. W. Wisniewski. Onlineperformance analysis by statistical sampling ofmicroprocessor performance counters. Proceedings ofthe 19th annual International Conference onSupercomputing (ICS’05). Cambridge, MA, 2005.[2] J. Dean and S. Ghemawat. MapReduce: Simplified DataProcessing on Large Clusters. Proceedings of the SixthSymposium on Operating System Design andImplementation (OSDI'04). San Francisco, CA,December, 2004.[3] D. M. Desai, T. M. Bradicich, D. Champion, W. G.Holland, and B. M. Kreuz. BladeCenter systemoverview. IBM Journal of Research and Development.Vol. 49, no. 6. 2005.[4] E. Hatcher and O. Gospodnetic. Lucene in Action.Manning Publications. 2004.[5] J. E. Hughes, P. S. Patel, I. R. Zapata, T. D. Pahel, Jr.,J. P. Wong, D. M. Desai, and B. D. Herrman.BladeCenter midplane and media interface card. IBMJournal of Research and Development. Vol. 49, no. 6.2005.[6] J. E. Hughes, M. L. Scollard, R. Land, J. Parsonese,C. C. West, V. A. Stankevich, C. L. Purrington, D. Q.Hoang, G. R. Shippy, M. L. Loeb, M. W. Williams,B. A. Smith, and D. M. Desai. BladeCenter processorblades, I/O expansion adapters, and units. IBM Journalof Research and Development. Vol. 49, no. 6. 2005.[7] H. M. Mathis, J. D. McCalpin, and J. Thomas. IBM p5 575 ultra-dense, modular cluster node for highperformance computing. IBM Systems and TechnologyGroup. October 2005.[8] H. M. Mathis, A. E. Mericas, J. D. McCalpin, R. J.Eickemeyer, and S. R. Kunkel. Characterization ofsimultaneous multithreading (SMT) efficiency inPOWER5. IBM Journal of Research and Development.Vol. 49, no. 4/5. 2005.[9] B. Sinharoy, R. N. Kalla, J. M. Tendler, R. J.Eickemeyer, and J. B. Joyner. POWER5 systemmicroarchitecture. IBM Journal of Research andDevelopment. Vol. 49, no. 4/5. 2005.[10] University of Mannheim, University of Tennessee, top500.org/.
Created Date: 1/23/2007 5:16:00 AM