Transcription
The Tipping Point:over-indebtedness andinvestment in microfinanceMicrofinance Information ExchangeAn exploration into whether investment contributed tomicrofinance repayment crises, and whether measures ofinvestment activity might serve as early warning signalsfor future microfinance crisesWritten by:Luis A. Viada, EVP (MicroRate)Scott Gaul, Director of Analysis (MIX)MicroBanking BulletinFebruary 2012Page 1
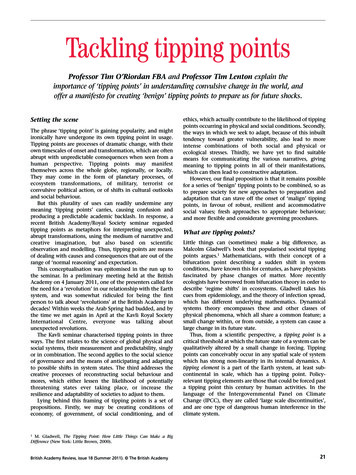
2005 marked a turning point for the microfinance industry. The industry burst into publicconsciousness – the year of microcredit. One year later, one of its brightest lights wasawarded the Nobel Peace Prize. Yet, in a number of countries, the first signs of structuralproblems began to appear, most notably in India, where the first cases of large scaledefaults and related suicides appeared in southern India. As Damian von Stauffenbergremarked, “microfinance had entered its adolescence.”Early reports of these events cited rapid growth in loan volume and client over-indebtednessas common denominators. In a 2010 paper, CGAP looked into the origins of crises in Morocco,Nicaragua, Bosnia and Pakistan. The report concluded that in each case, three majorvulnerabilities lay at the heart of the problems: Concentrated market competition and multiple borrowingOverstretched MFI systems and controlsErosion of MFI lending disciplineThe above suggests a relationship between the level of MFI lending activity in a given marketand the deterioration in underwriting standards and operational effectiveness of the MFIs.The premise behind this is that when multiple MFIs compete in a given market, the targetedclients are at risk of taking on additional borrowing beyond the point where they can meetdebt service payments without serious difficulty. Lacking adequate information onindividuals’ indebtedness and in circumstances where lenders’ credit standards may beloosening, this borrower saturation point may be reached before lenders realize. Thus, thereis a need to look for reliable early signs of potential over-lending by MFIs.This article explores whether funding to MFIs contributes to over-lending by those MFIs, andwhether various measures of funding activity might serve as early warning signals formicrofinance crises.Funding supply and portfolio qualityMicrofinance institutions have three main sources of funds: debt, equity and deposits. Forthe purposes of this article, we will focus primarily on debt financing (borrowings). We havedetailed information through 2010 on the sources of roughly 15 billion USD in debt, anincrease of 5.5 billion USD from 2007 levels.Figure 1 below shows the global growth in funding by type of lender and source of funds.Due to the overwhelming size of the Indian market, we graph India separately from the restof the world. By 2010, local sources (primarily banks) provided the majority of funding most notably in India. After peaking at 3.2 billion USD in 2009, investment funds representthe second largest source of debt funding, followed by DFIs. The decline in 2010 in foreignsources was the result of the drop in MFI activity following the global financial crisis of2008/2009.MicroBanking BulletinFebruary 2012Page 2
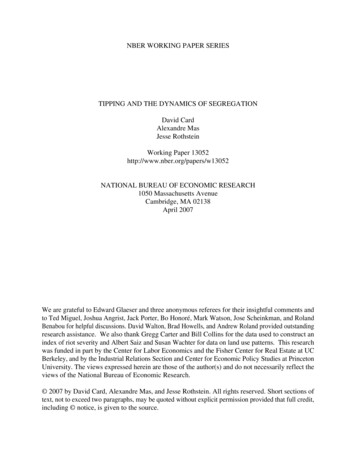
Figure 1: Sources of funds and types of lendersFor the four countries cited earlier, figure 2 suggests that portfolio quality began to declinefollowing rapid increases in funding. By 2007, portfolio-at-risk (PAR 30) levels in these fourcountries began to deteriorate, with delinquency rates rising from between 1 and 3 percentto 7 to 13 percent in just two years.MicroBanking BulletinFebruary 2012Page 3
In several cases, delinquency problems continued to rise even after funders reduced theirexposures. In Nicaragua, the government’s explicit support of the grassroots repaymentmoratorium contributed to a steep and persistent increase in delinquencies notwithstandingthe equally steep withdrawal of foreign funding sources.Fig.2: Growthand riskthroughmajor crisesFigure2: Growthandrisk throughmajor crisesThe most dramatic and thoroughly-documented crisis, however, is the one playing out inIndia. The evolution of that crisis suggests that excessively fast growth in lending, combinedwith intense competition and market saturation can lead to a relaxation of credit standardsand a strain on MFI systems and practices. Figure 3 displays the rapid increase in the supplyof debt funding, particularly from domestic banks, although growth from equity investors hasbeen similarly rapid.This suggests that, at the aggregate country level, there may be a relationship betweenrapidly increasing funding to the sector and declining portfolio quality. We now look atfunding at the MFI level to see if there are patterns of activity that could contribute to anearly-warning picture of an overheating environment.MicroBanking BulletinFebruary 2012Page 4
Figure 3: Growth and risk in IndiaSuccess and unintended consequencesIn the same way that individuals can over-borrow, can competition among funding sources toMFIs encourage MFIs to push the limits of their underwriting and risk management processes?In the past, one of the main constraints to unbridled loan growth was the relative scarcity offunding sources. But in recent years, the business success of microfinance has attracted newand abundant sources of both local and international funding, making it much easier for MFIsto pursue faster growth strategies.Under these circumstances, MFIs may be encouraged to increase loan portfolios to meetambitious outreach goals or shareholder demands for increasing revenue growth. Boards mayexpect the MFI to increase or at least maintain market share when facing increasedcompetition. These competitive pressures can foster aggressive loan origination policies andstaff incentives based on loan volume. These will simultaneously contribute to decliningportfolio quality and hastening of the market saturation process.At the same time, the funders’ credit standards may limit the number of MFIs that theyconsider qualified as borrowers. This can lead to the concentration of large volumes offunding on a small number of leading MFIs in a particular location. Current informalinformation sharing among certain MFI funders is inadequate.The situation is further affected by the time and resources required for MFIs to reports tomultiple funders and stakeholders. Survey results from Africa (a region with generally lowexternal investment) indicate the typical MFI there spends roughly 60 days a year solely onreporting to investors and other stakeholders. While credit bureaus may provide informationMicroBanking BulletinFebruary 2012Page 5
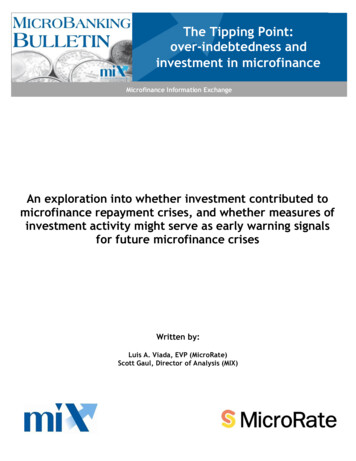
on MFI client borrowing, they will not shed light on aggregate borrowing at the MFI level. Inthis vein, David Roodman has recently called for such a public credit bureau to track lendingto microcreditors.Absent such a resource, are there any data that can provide an early indication of increasingmultiple borrowing by MFIs and is it correlated to declining loan quality?Multiple lender indicatorsFigure 4 compares the number of distinct lenders per MFI in 2007 with changes in countryrisk indicators in that country for the period 2007 - 2010.FigureFigure 4:4: NumberNumberofoflenderslendersinin 20072007 vs.vs. changes inin riskrisk20072007––20102010 Figure 4:Note: For this chart, for each MFI, we count the number of distinct lenders. If a lender has multiple loans to the same MFI, we countthe lender only once. We then take the average number of distinct lenders across all MFIs by country. For the risk indicat or, we takethe weighted average of both PAR over 30 days and write-offs by country and compute the log change in risk levels from 2007 2010. We use the log of risk levels to better reflect the relative change within a given market. Risk data available here. We includeonly countries with at least 3 MFIs receiving debt financing in 2007 and 2010. Correlations are significant at the 1% level; data forthe charts can be extracted by clicking the extract icon.MicroBanking BulletinFebruary 2012Page 6
The data shows a reasonable correlation between higher numbers of lenders and increasedsystemic risk: in general, countries that had more lenders providing debt financing to MFIs in2007 saw increasing risk over the next four years. The upper-right quadrant of the graphespecially highlights markets that have seen crises or the threat of crises in recent times:India, Bosnia, Nicaragua, Morocco. (You can highlight individual countries by mousing overthe graph. The first chart shows all sources of funds, while the second shows only thenumber of cross-border lenders.)Another way to look at this relationship is to rank individual countries by the average numberof lenders per MFI. Figure 5 lists the countries with the highest number of active lenders perMFI in 2007. Again, countries such as India, Nicaragua, Morocco and Bosnia appeared at theupper end of this range in 2007, further suggesting that this kind of data may be anotherpotentially useful early indicator of increasing market risk.Marketswithwiththethemostmost lenderslenders on and2010For the 2010 figures, we can track countries that have moved into the range that the crisiscountries occupied in 2007. A number of them are “watchlist” countries (e.g. Peru,Kyrgyzstan, Cambodia and Colombia) identified by several MIV managers in MicroRate’srecent “State of Microfinance Investment” survey.MicroBanking BulletinFebruary 2012Page 7
Averagenumbernumber of lendersmarketsFigure 6:6: Averagelenders gure 4:Figure 6 demonstrates the transition of these groups of countries from 2007 to 2010 - wegroup countries that have had repayment crises, countries on investor 'watchlists' and thosewith no crises to date. Those that have experienced a crisis have seen a reduction in thenumber of borrowing relationships, while the 'watchlist' countries have seen a steadyincrease in the average number of lenders per MFI during that period. We can track portfolioquality in these markets going forward to see if it follows the same deterioration as in theearlier 'crisis' countries.Favored market concentrationWe have seen that MFI activity can sometimes gravitate towards preferred territories withina country, which reach saturation more quickly than the rest of the country, such as thesouthern states of India. Aggregate funding patterns may thus mask localized areas ofemerging problems. Thus, it is important that future analysis also consider data that look atpossible intra-country clusters of “over-serviced” locations.Local concentration can be aggravated by credit considerations of funders that limit theirlending to a limited number of institutions within the country, leading to potentialoversupply in the areas covered by those few MFIs. Figure 7 indicates considerableconcentration of MIV funding among the top MFIs. Fifty percent of total MIV funding (almost5 billion USD) is concentrated in 33 MFIs. The top 100 MFIs receive seventy-five percent ofthe funding, while 90 percent of funding goes to the top 200 MFIs - the remaining 10 percentis allocated to an additional 400 MFIs around the world.MicroBanking BulletinFebruary 2012Page 8
A fuller analysis of concentration at the country level is beyond the scope of this article butwould be an important contribution to a more detailed understanding of leading indicators ofoverheating market conditions.ConcentrationofofMIVMIV fundingfunding byFigure 7:7: ConcentrationFigureby MFI,MFI,2010ConclusionMicrocredit markets are fragile. The poor have limited absorptive capacity for debt and caneasily overextend themselves by taking on debt obligations in excess of what they canreasonably hope to service. While ambitious MFI outreach goals are to be applauded inprinciple, the reality is that overly zealous loan origination activities can overridegovernance and control systems, leading to less rigorous credit standards and destructive,unintended consequences.While the best deterrent to over-indebtedness will come from improved credit reportingsystems at the individual and institutional level, the data presented here suggests that wecan find warnings for these problems by tracking the supply of credit to microfinanceinstitutions. Those microfinance markets with the most lenders and most competition for MFIclients have seen the highest increases in risk, and likely, client over-indebtedness.MicroBanking BulletinFebruary 2012Page 9
The Tipping Point: over-indebtedness and investment in microfinance Microfinance Information Exchange Written by: Luis A. Viada, EVP (MicroRate) Scott Gaul, Director of Analysis (MIX) An exploration into whether investment contributed to microfinance repayment crises, and whether measures of investment activity might serve as early warning signals