Transcription
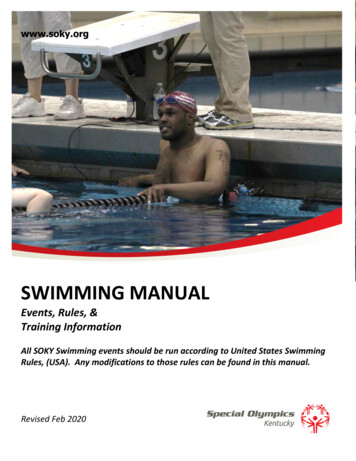
2.671 Measurement and InstrumentationTuesday PMProf. Swithenbank5/4/2015SWIMMING STARTS: A COMPARISON OF RELAY AND INDIVIDUAL RACING DIVEREACTION TIME, SPEED, AND DISTANCEMichael EverettMITCambridge, MA, USAABSTRACTIn competitive swimming, relay starts are known tobe faster than starts from a standstill but exactly howmuch faster and why are unknown. Measurements weremade using iPhone video recordings and Logger Prosoftware for analysis. The average reaction time for arelay start is 0.26 0.03 seconds and 0.71 0.03seconds for a flat start. With 95% confidence, the averagerelay start reaction time is 0.39 seconds shorter than theflat start time. The maximum speeds reached during relayand flat starts are statistically indistinguishable with 95%confidence, as are horizontal distance traveled and angleof entry. This indicates the difference in times for relaysplits and individual races is mainly due to the advantageof anticipating the start and not due to the extra steps orarm swings allowed when aggregated over all swimmers.significantly faster times on relays as compared to “flat”starts, but the difference varies from athlete to athlete.There are many common ideas of why this differenceoccurs including the mental aspect of being in a team racesuch as a relay, or a higher speed upon entering the waterdue to arm swings or steps forward.Reaction times and speed upon entering the water ofthese different types of dives were measured using videoanalysis. These factors are then related to real race timesto determine how important the dive is compared to otherfactors. Section 1 explains the background and theory ofthe racing dive; the experimental setup is covered inSection 3; Section 4 contains results and trends; andSection 5 has conclusions.INTRODUCTIONCompetitive swimming is all about racing andbecoming faster. In one season of collegiate swimming,each athlete spends about 500 hours in practice and issatisfied with an improvement of only a few tenths of asecond. Most of the time at practice is spent swimminglaps back and forth to improve aerobic ability and racestrategy. Often only a few hours are dedicated to moretechnical aspects of the race, like the start and turns at thewall. This paper focuses on the start of the race, which isa dive off of starting blocks for three of the four strokes.The dive in an individual race is very different fromthat of a relay race (Figure 1) and the exact rules arecovered in Section 2.1. Essentially, in an individual race,the swimmer must be completely still and listen to thevoice of the announcer. In a relay, the swimmer cananticipate the start by gauging how fast the previousswimmer is moving toward the wall, and can step into thedive. Due to this advantage, swimmers often haveFigure 1: 2 Types of Starts. On the left is the flatstart. Before the race starts, swimmers must becompletely still. On the right is a relay exchange.Notice how the incoming swimmer (red box)touches the wall before the diver’s feet (yellow box)leave the starting blockBACKGROUNDNCAA RULESThe specifics of the individual event start (flat start)are described in NCAA Rulebook [1] Rule 2, Section 1,Article 1:12.671 Go Forth and Measure
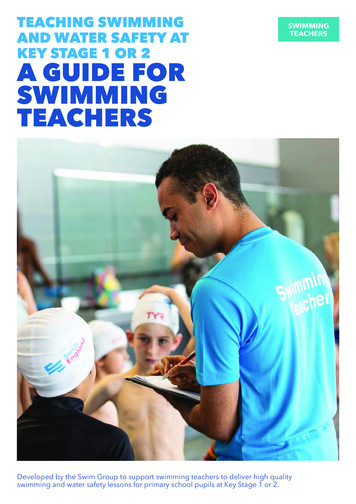
In all swimming races with theexception of backstroke and medleyrelay races, upon a signal by whistlefrom the referee, the swimmers shallstep onto his or her starting platform andshall stand, without excessive noise ormovement, with both feet on the top ofthe platform. The referee then shall turncontrol of the competitors over to thestarter. The starter may give briefinstructions deemed necessary. Then,upon the starter’s verbal command“Take your mark,” each swimmer, withno unnecessary noise or movement,immediately shall assume any desiredstarting position with at least one foot onthe front edge of the starting platform.(With prior approval of the referee, aswimmer may start in the water but musthave at least one hand on the wall orstarting platform.) Sufficient time shallbe allowed to enable each swimmer toassume a stationary starting position;however, all swimmers are expected totake their starting positions atapproximately the same time, andunnecessary noise, movement or delaysshall not be permitted. When the startersees that the swimmers are stationary,the starter shall start the race with anelectronic-sound device.NCAA Rulebook Rule 2, Section 1, Article 7cexplains the relay start:1. The swimmer is allowed (but notrequired) to use a step-forward start (i.e.,to move forward on the top of thestarting platform immediately beforetakeoff); however, all velocity in thestart must be generated after theswimmer is on the platform.2. The swimmer may be in motion whenthe preceding teammate finishes his orher leg of the race; however, theswimmer must have at least one foot incontact with the starting platform when(or after) the teammate finishes.3. If the swimmer leaves the startingmark before the preceding teammatefinishes his or her leg of the race, thatrelay team shall be disqualified.IMPORTANT PARAMETERS OF A STARTThere are many parameters involved in a swimmingstart, including speed, reaction time, horizontal distancetraveled, angle of entry, and time in the air. A good startdepends on all of these characteristics and the relativeimportance of each varies depending on the athlete. Lyttleet al. [2] proposed that there is a compromise betweengetting off of the blocks as quickly as possible (fastreaction time) and pushing hard off of the blocks (highmaximum speed, horizontal distance). Ruschel et al. [3]found that horizontal distance traveled is most correlatedwith performance of a swimming start, but time in the airis not as relevant. Accordingly, many parameters weremeasured to determine how they vary between the twotypes of start: relay and flat.One way to measure reaction time and speed uponentering water starts with video recording. Video analysissoftware calculates ! and !, which are horizontal andvertical positions as explained in the Experimental Designsection. With ! and !, it is possible to calculate morerace-relevant statistics. Speed is more important thanvelocity in ! or ! because maximizing a velocity could bedone with a “belly-flop” or vertical dive. In reality, duringa fast dive the swimmer’s body bends upon entering thewater to translate speed into ! velocity underwater.Once the swimmer’s feet leave the starting block, heis a complex body whose center of mass translates muchlike an inanimate point mass. Every swimmer doessomething different with their arms, head, and feet in theair to maximize the distance they travel and to enter thewater in an efficient shape. Thus, the video analysissoftware was used to track the approximate center ofmass (near the hips) during flight. A fit of ! and ! allowsextrapolation of body angle, !, upon entering the water(Figure 4).HISTORICAL RESULTSThe difference in relay times and flat start timesfrom the 2015 NCAA Championships [2] can becalculated using meet results (Figure 2). With 95%confidence, the average reaction time for a flat start is atleast 0.43 seconds greater than for a relay start. Theaverage relay start reaction time is 0.21 seconds whereasaverage flat start reaction time is 0.67 seconds. Thesetimes are measured using specialized force plates on thestarting blocks, capacitive touchpads on the walls, and acentralized timing system. The Experimental Designsection explains a less hardware-intensive setup tomeasure the same quantity.22.671 Go Forth and Measure
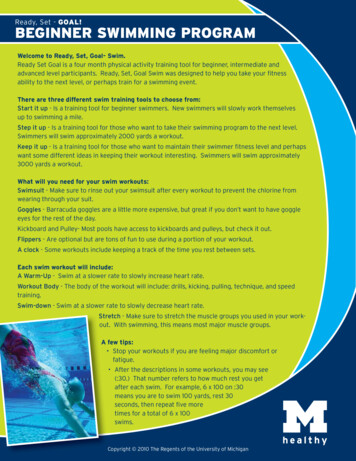
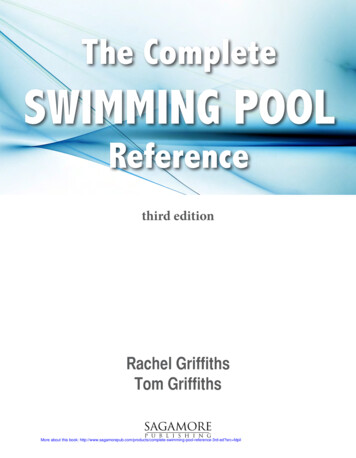
y)0.5"Figure 3: Flat start trajectory. The yellow lines arethe origin and axes and the blue dots show where theswimmer’s center of mass is as time passes. Theblurring on the right side image occurred in all trials.Both images are zoomed in to show detail.)Competition)Reaction)Time)(s))Figure 2: Competition Reaction Times. Relay startreaction times are faster on average and have a largervariance than flat starts. This data comes from 2015NCAA Division I Swimming Championships for 50Free and 200 Free Relay Finals.EXPERIMENTAL DESIGNEQUIPMENT AND SETUPThe data was collected with video analysis. AniPhone camera on a tripod shot at 30 frames/second andcaptured the starting block and about 5 yards of the 25yard lane. This was enough to see the entire dive fromstarting block to entry in water (Figure 4). To account forvariability between trials and swimmers, 5 maleswimmers each performed 5 flat starts and then 5 relaystarts in the span of about 30 minutes.The frame rate was used to convert frame number toelapsed time. This was assumed to be 30 frames/secondbut is not critical since the important results are relativetimes rather than absolute. Finally, the positions werecalibrated using the square tiles on the pool deck, whichare a standard 1” across. The origin for each measurementwas set at the front of the block for x-position, and thesurface of the water for y-position. This scale is shown inFigure 4 by the light green line in the bottom center.LOGGER PRO ANALYSISThe .mov files from the camera were inserted into aLogger Pro file for frame-by-frame viewing. One frame ata time, the location of the center of the upper ring of theswimsuit was recorded (Figure 3). There was someblurring which led to inaccuracy of position but withabout 40 positions per dive, this was minimal.For flat starts, the announcer waved a hand in frontof the camera at the same time as he said, “go,” in orderto begin the time count for reaction time. By advancingframe-by-frame, the number of frames between the handwave and the swimmer’s feet leaving the starting blockwere divided by the frame rate to calculate reaction time.For relay starts, the time count started when the incomingswimmer’s hand touched the wall. As expected, theswimmer on the block was already moving before thehand touch.Figure 4: Single dive trajectory. The viewable areafrom the camera setup was wide enough to see thestarting block all the way to the entry into water. Thetrail of blue dots shows the entire trajectory of asingle, flat start. The green line near the bottomshows the scale: its actual length was 27”. The angleΘ was calculated using the last two (x,y) pairs asdescribed in Section 2.2After extracting the blue dots from the Logger Proanalysis, nice trajectory curves are generated to displayheight and length of dives by different swimmers (Figure5).32.671 Go Forth and Measure
r"E"0" )10" )20" )30" )40" )50" )60" )70"X)position)(in))0.3"0.2"0.1"0"Figure 5: Flat Start Trajectories. 5 swimmers’ XYpositions are plotted at once to show the differenttrajectories to reach a similar end result. Swimmer Atraveled the farthest away from the starting block onhis dive and also jumped the highest off of the block.This figure does not show time, just n)Time)(s))Figure 6: Measured Reaction Times. Just like in theBackground, relay start reaction times are faster onaverage and have greater variance than flat starts.This data comes from video analysis of the five,filmed swimmers as opposed to the force-basedmeasurement used at high-level swim meets. Thissimilarity helps to assert value in video as ameasurement device.RESULTS AND DISCUSSIONFrequency)The average reaction time for a relay start is at least0.39 seconds shorter than flat starts, with 95%confidence. The average relay start reaction time is0.26 0.03 seconds and the average flat start reactiontime is 0.71 0.03 seconds. These were measured usingvideo as described in the previous section (Figure 6). Thedifference of 0.39 seconds is within 9% of the calculatedvalue in the Background section.With 95% confidence, the maximum speed reachedduring relay and flat starts are statisticallyindistinguishable (Figure 7) when all five swimmers’ datais aggregated. The same is suggested for horizontaldistance traveled (Figure 8). The average horizontaldistance during a relay start is 66.1 4.7 inches, and64.8 4.7 inches during a flat start. The averagemaximum speed is 7.75 0.43 mph during a relay start,and 7.84 0.62 mph during a flat .75"9"9.25"20" imum)Speed)(mph))Figure 7: Maximum Speed on Dive. There is nodifference in the maximum speed reached during arelay start as opposed to a flat start. The arm swingsand step-ups do not help move the swimmer fasterupon entry into the water.42.671 Go Forth and Measure
"69.5"71"72.5"74"75.5"0.05"increase and swimmers approach 10 mph flying throughthe 0.5"0.75"Time)(s))1"1.25"It is also interesting to compare MIT swimmers, whocompete in Division 3 and do not receive scholarships, tothe fastest collegiate swimmers in the world. While thefastest MIT sprinter [3] was 1.86 seconds slower than theDivision 1 champion (20.50 seconds vs. 18.64 seconds inthe 50 yard freestyle), the starts are very similar (Figure11). The reaction time of an MIT swimmer is at least 0.01seconds longer than that of an elite, Division 1 swimmer,with 95% confidence. Therefore, looking solely atreaction times, it is nearly impossible to tell who is goingto the Olympics and who is a typical college .5"54.5"Frequency)0.2"0.25"Figure 10: Speed over Time during Flat Start.Swimmers did a flat start and their speeds werecalculated over the 1 second of flight time. Speedincreases at first when the swimmer compresses hislegs and goes down to zero when fully “charged up.”Speed increases and reaches a maximum just beforea sharp decline when hands enter the water around 1second after the starter says, “go.”Figure 8: Horizontal Distance upon Entry. There isno difference in the average horizontal distancetraveled in a relay start versus a flat start. Thedifference between the best and worst start wasalmost 20 inches (1% of 50-yard race).The average angle of entry of a relay start is41.5 0.5 degrees and 41.2 0.5 degrees for a flat start.Just like with maximum speed and horizontal distance,with 95% confidence the angle of entry of a relay start isstatistically indistinguishable from a flat start whenaggregated over all five ivision"1"[1]"0.2"0.15"0.1"0.05"Figure 9: Angle of Entry. Relay start angle of entryis similar to flat start entry angle, and has a range ofalmost 30 degrees.0")0.1" 0" 0.1" 0.2" 0.3" 0.4" 0.5"Reaction)Time)(s))Figure 11: MIT vs. Elite swimmers. This graphcompares the relay reaction times of MIT and toplevel swimmers from Division 1 teams. There is noobvious difference between the two from this graph,unlike the relay vs. flat start graph.Speed is maximized just before the hands enter thewater (Figure 10). The acceleration from the reactionforce from the block and from gravity cause this speed52.671 Go Forth and Measure
Horizontal)Distance)Traveled)(in))In Figures 6 and 11 there are data points withnegative reaction times. This means the swimmer “falsestarted” and this would be a disqualification incompetition. The swimmer dove into the pool before theprevious swimmer touched the wall. It happens a fewtimes per meet regardless of level.Since speed and horizontal distance do not differsignificantly when all swimmers are combined (Figures 7,8), the statistics were also compared swimmer-byswimmer (Figures 12, 13). For example, swimmer Creaches a greater average maximum speed during a relaystart than flat start, but does not travel as far. Conversely,swimmer E shows opposite behavior. There is no trendthat covers all five of the swimmers in this experiment;instead there is now information available for eachswimmer to learn more about his technique and where eed)(mph))Figure 12: Horizontal Distance Traveled bySwimmer. Swimmer C travels further on a flat startthan a relay start but swimmer C does the re 13: Maximum Speed by Swimmer. Again,there is no clear trend across all five swimmers,since some reach a higher average maximum speedon one type of dive than the other.The swimmers in the experiment complained offatigue because 10 dives in quick succession is muchmore than a typical practice or competition. More trialsare required to draw insights about each swimmer’stechnique since error bars are large compared todifferences in magnitude (Figures 12, 13). Measuringmore than 5 different swimmers would better account forthe different start techniques (e.g. one foot forward versustwo, or a full forward step on a relay start versus a halfstep). A higher frame rate on the video would improveprecision and less blurring in the video footage wouldimprove accuracy of measured positions.CONCLUSIONSWith 95% confidence, the reaction time of a relaystart is 0.39 seconds shorter than that of a flat start. Theaverage relay start reaction time is 0.26 0.03 secondsand the average flat start reaction time is 0.71 0.03seconds. For each of the three statistics: horizontaldistance, maximum speed, and angle of entry, there is nostatistically significant difference between a flat and relaystart when aggregated over all five swimmers. Aswimmer enters the water at an average horizontaldistance of 66.1 4.7 inches during a relay start, and64.8 4.7 inches during a flat start. The averagemaximum speed is 7.75 0.43 mph during a relay start,and 7.84 0.62 mph during a flat start. A swimmerenters the water at an average angle of 41.5 0.5 degreesduring a relay start, and 41.2 0.5 degrees during a flatstart. There is only a small difference of 0.01 secondsbetween elite swimmers’ reaction times and MITswimmers’ on relays. Therefore the time in practice isbest spent working on components of the race other thanrelay start reaction time since there is little room toimprove.On an individual basis, for some swimmers there islittle difference between their relay and flat starts otherthan a faster reaction time. For other swimmers, there arestrengths and weaknesses exposed by video analysis,which can be accounted for in upcoming practices andcompetitions.Because swimmers train for so many hours and racefor only a few minutes each season, every race is animportant data point for a coach and athlete to learn from.A relation of reaction times of flat and relay starts ishelpful in comparing the time of a relay race and anindividual race. Currently, the two types of races aredisjoint and hard to compare. Now, a relay swim can62.671 Go Forth and Measure
accurately be equated to an individual swim time minus0.39 seconds.Future work will compare different styles of relaystarts, which was briefly mentioned in the Background, todetermine which is fastest. Some swimmers step forwardwith two feet, some do a big arm swing, and some juststand still but all involve anticipation of the start. It willalso be useful to automate the video analysis process ofthis experiment so that swim coaches can utilize thisinformation on their own swimmers using only an iPhoneand tripod.ACKNOWLEDGMENTSThe author would like to thank Dr. Barbara Hugheyand the 2.671 course staff for equipment and guidance, aswell as Brendon Chiu, Daryl Neubieser, Justin Chiu,Scott Mayberry, and John Matthews for help in dataacquisition.REFERENCES[1] 2014-15 NCAA Swimming and Diving nloads/SW15.pdf (accessed 5/3/15)[2] Ruschel C., Araùjo L., Pereira S., Roesler H.(2007) Kinematical analysis of the swimming start: block,flight and underwater phases. ISBS-Conference Proceedings 1,385-388[3] Lyttle A., Blanksby B., Elliot B., Lloyd D. (1999) Optimaldepth for streamlined gliding.: Biomechanics and Medicine inSwimming VIII, Jyväskylä, Finland: University of Jyväskylä.:Keskinen K.L., Komi P.V., Hollander A.P., editors. 165-170[4] 2015 NCAA Division 1 Championships Results, wim/ schedule(accessed 4/7/15)72.671 Go Forth and Measure
Competitive swimming is all about racing and becoming faster. In one season of collegiate swimming, each athlete spends about 500 hours in practice and is satisfied with an improvement of only a few tenths of a second. Most of the time at practice is spent swimming laps back and forth to improve aerobic ability and race strategy.