Transcription
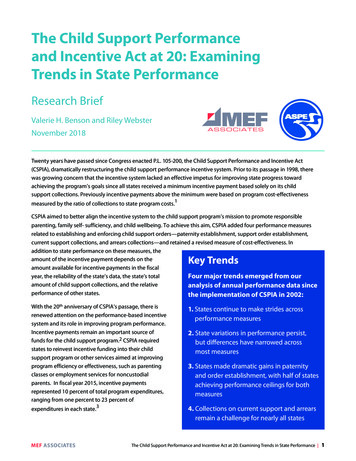
The Child Support Performanceand Incentive Act at 20: ExaminingTrends in State PerformanceResearch BriefValerie H. Benson and Riley WebsterNovember 2018Twenty years have passed since Congress enacted P.L. 105-200, the Child Support Performance and Incentive Act(CSPIA), dramatically restructuring the child support performance incentive system. Prior to its passage in 1998, therewas growing concern that the incentive system lacked an effective impetus for improving state progress towardachieving the program’s goals since all states received a minimum incentive payment based solely on its childsupport collections. Previously incentive payments above the minimum were based on program cost-effectivenessmeasured by the ratio of collections to state program costs.1CSPIA aimed to better align the incentive system to the child support program’s mission to promote responsibleparenting, family self- sufficiency, and child wellbeing. To achieve this aim, CSPIA added four performance measuresrelated to establishing and enforcing child support orders—paternity establishment, support order establishment,current support collections, and arrears collections—and retained a revised measure of cost-effectiveness. Inaddition to state performance on these measures, theamount of the incentive payment depends on theamount available for incentive payments in the fiscalyear, the reliability of the state’s data, the state’s totalFour major trends emerged from ouramount of child support collections, and the relativeanalysis of annual performance data sinceperformance of other states.the implementation of CSPIA in 2002:Key TrendsWith the 20th anniversary of CSPIA's passage, there isrenewed attention on the performance-based incentivesystem and its role in improving program performance.Incentive payments remain an important source offunds for the child support program.2 CSPIA requiredstates to reinvest incentive funding into their childsupport program or other services aimed at improvingprogram efficiency or effectiveness, such as parentingclasses or employment services for noncustodialparents. In fiscal year 2015, incentive paymentsrepresented 10 percent of total program expenditures,ranging from one percent to 23 percent ofexpenditures in each state.3MEF ASSOCIATES1. States continue to make strides acrossperformance measures2. State variations in performance persist,but differences have narrowed acrossmost measures3. States made dramatic gains in paternityand order establishment, with half of statesachieving performance ceilings for bothmeasures4. Collections on current support and arrearsremain a challenge for nearly all statesThe Child Support Performance and Incentive Act at 20: Examining Trends in State Performance 1
MethodsThis brief’s analysis is based on data reportedannually to the Office of Child SupportEnforcement. Since CSPIA required the incentivesystem to be phased-in, we examine the fiveperformance measures for all states and theDistrict of Columbia4 beginning in 2002, whenthe system was fully effective, through 2016when the most recent data was available.To understand how performance varies acrossstates over time, we examine the spread orvariation of performance scores by dividingthem into quartiles. We also examine medianvalues to understand state performance overall.What do quartiles tell us aboutperformance?Quartiles help illustrate the variability ofperformance scores across states. This allows usto compare performance to states at the top ofthe distribution (the highest-performing states)to states in the bottom of the distribution (thelowest-performing states). This also helps usunderstand patterns of change from year-toyear. For example, do differences between highperforming and low-performing states narrowovertime?What does the median tell us aboutperformance?Despite broad agreement that the child support programhas performed well since the passage of CSPIA, questionsremain over whether the current measures will continueto drive better performance on outcomes that reflect thechild support program’s core mission. To shed light onthis issue, this brief discusses differences in stateperformance across incentive measures, underscoringthe diversity of state experiences since CSPIA’s passage 20years ago.State child support programs operate in complexenvironments. There are considerable differences in thestructure of state programs, how they coordinate withother state agencies, the level of court involvementrequired by state law, and the policies and procedures towhich they adhere. The differences in states’ performanceon CSPIA’s measures may reflect such variances in localservice, economic, and administrative contexts in whichstate programs operate.This brief builds on previous work by Sorensen (2016)examining national trends in child support performanceby assessing the extent to which performance variesacross states and across measures.5 We discuss, for eachmeasure, how states’ performance has changed sincethe implementation of CSPIA, the extent to which states’performance varies, and opportunities for improvement.We then examine states’ recent performance byhighlighting measures that have significant improvementfrom 2011 through 2016. The brief concludes with adiscussion of next steps for future analyses.The median represents the middle performancescore, but unlike the mean, it is not sensitiveto outliers or unusual values. We examine themedian and how it compares to each measure’supper threshold (the score required for themaximum incentive amount) to understandhow states perform overall. For example, wemay see large differences between states in thetop and bottom quartiles on a given measure.However, if the median is at or near themeasure’s upper threshold and eligible for themaximum incentive, most states are performingwell on that measure.MEF ASSOCIATESThe Child Support Performance and Incentive Act at 20: Examining Trends in State Performance 2
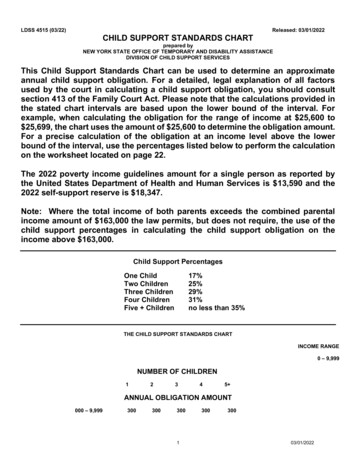
Paternity EstablishmentPerformanceSince 2002, states made great stridesto ensuring children have a legal claim tochild support by establishing paternity.In 2002, thirteen states had paternity establishmentpercentages below the upper threshold of eighty percentand not eligible to receive the maximum the federalincentive payment for paternity establishment (see textbox below for details). By 2011, however, almost all stateshad performance percentages at or above the upperthreshold. State paternity establishment percentages arepresented by year in Table 1 on page 17.Paternity Establishment PercentageScores by State 50%50–64%65–79% 80%20022006Measure 1: Paternity EstablishmentPercentage (PEP)The percentage of children for whom paternitywas established or acknowledged during thefiscal year. States have two options for reportingperformance. The first, IV-D PEP, is based onthe number of children in the IV-D caseload.The second, Statewide PEP, is based on thenumber of nonmarital births in the state duringthe preceding fiscal year for whom paternity was2011established.6 Since states report only onepaternity establishment score each year, ouranalysis does not distinguish between IV-D PEPand Statewide PEP.Since performance scores compare paternitiesestablished during the current year to thenumber of nonmarital births in the previousyear, percentages can exceed 100 percent.If performance for paternity establishment is ator above the upper threshold of 80 percent, thenstates are entitled to the maximum incentive. Ifstates do not attain a rate of at least 50 percent,they are not eligible for an incentive for thatmeasure, unless the state significantly improvesfrom its previous year’s performance.MEF ASSOCIATES2016The Child Support Performance and Incentive Act at 20: Examining Trends in State Performance 3
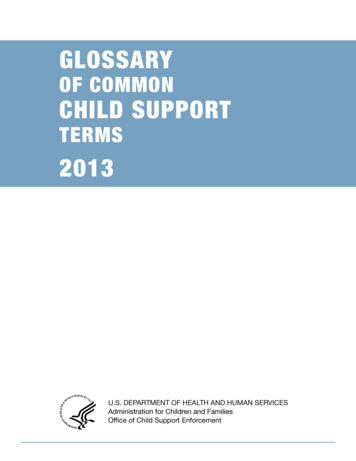
Paternity Establishment PerformanceState paternity establishment rates rosedramatically since 2002, narrowing statedifferences in paternity establishmentperformance.How to Interpret the StackedArea ChartsState paternity establishment rates dramatically improvedfrom 2002 to 2016, with the median percentage increasingnearly 11 percentage points from 86 percentto 97 percent during that period. It is important to note thatpaternity establishment rates can exceed 100 percent sincestates establish paternities for older children born before theprevious fiscal year. For states in the top quartile, the medianpaternity establishment rate exceeded 100 percent formuch of the 14-year period.Differences in state paternity establishment rates alsonarrowed during this period. Since 2002, the differencebetween the highest and lowest state score—a measure ofhow widely state rates vary—dropped nearly 14 percentagepoints in 2016 due to large improvements among states inthe bottom quartile.Our stacked area charts are a version of standardbox plots that display the full range of values, thelikely range of values (interquartile range), thetypical value (median), and any atypical values(outliers). By transforming yearly box plots of stateperformance scores into the stacked area chartshown below, we can see how the distribution ofperformance changed across states over time.Comparing performance at the top of thedistribution to the bottom captures the overallperformance across states. Top-to-middlecomparisons (above the median) or middle-tobottom (below the median) comparisons allowus to understand patterns of change across thedistribution, such as high-performers versus lowperformers from year-to-year. We also denoteoutliers with each dot representing one state.Distributionof PaternityEstablishmentPercentageDistributionof 20110Quartile 410090803ianMed217060504030201002002‘03MEF ‘12‘13‘14‘15‘16The Child Support Performance and Incentive Act at 20: Examining Trends in State Performance 4
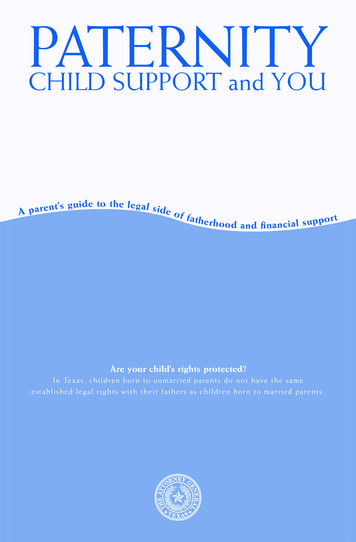
Order EstablishmentPerformanceChild Support Order Scores by State 50%50–64%65–79% 80%2002States’ performance establishing childsupport orders improved substantiallysince 2002.State order establishment rates increased from 2002through 2016. In 2002, 37 states fell below the upperthreshold for the order establishment and four statesfailed to meet the lower threshold (see text box belowfor details). By 2016, all but five states had establishedsupport orders for at least 80 percent of child supportcases, exceeding the upper threshold for performanceand eligible to receive the maximum incentive for thatyear. State support order establishment percentagesare presented by year in Table 2 on page 18.2006Measure 2: Child Support OrderEstablishment PercentageThe percentage of child support cases that havea child support order requiring the noncustodialparent to pay child support.If performance for order establishment is at orabove the upper threshold of 80 percent, thenstates are entitled to the maximum incentive.2011If states do not attain a rate of at least 50 percent,they are not eligible for an incentive for thatmeasure, unless the state significantly improvedfrom its previous year’s performance.2016MEF ASSOCIATESThe Child Support Performance and Incentive Act at 20: Examining Trends in State Performance 5
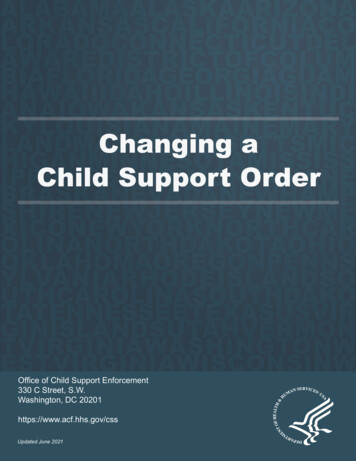
Order Establishment PerformanceThe rise in support order establishment rates was driven largely by improvedperformance among the lowest performing states.The median support order establishment percentage improved 14 percentage points from 73 percent in 2002to 87 percent in 2016, an even larger increase to that seen in paternity establishment rates. During the 14-yearperiod, improved performance among the lowest performing states that fell in the bottom quartile each yearhelped narrow state differences in order establishment performance.Distributionof Child SupportOrderEstablishmentRatesDistributionof e 43ianMed7021605040Outlier30201002002‘03MEF ‘12‘13‘14‘15‘16The Child Support Performance and Incentive Act at 20: Examining Trends in State Performance 6
Current CollectionsPerformanceThough states made strides on the collectionof current support since 2002, gains weresmaller relative to those made in paternityand order establishment.States improved their collection of current support from2002 to 2016. In 2002, 32 states had current supportcollections rates below 60 percent with one state fallingbelow the lower threshold of 40 percent. By 2016, states’performance improved dramatically with all but 11 statescollecting at least 60 percent of current support due. Onlyone state exceeded the upper performance threshold andeligible to receive the maximum incentive for currentcollections performance for that year. State currentsupport collections percentages are presented by year inTable 3 on page 19.Current Child Support CollectionsPercentage by State 40%40–59%60–79% 80%20022006Measure 3: Child SupportCollections ScoreThe percentage of total amount of support owedthat is collected on current support cases onbehalf of children in the child support caseload.2011If performance for child support collections is ator above the upper threshold of 80 percent, thenstates are entitled to the maximum incentive.If states do not attain a rate of at least 40 percentthey are not eligible for an incentive for thatmeasure, unless the state significantly improvedfrom its previous year’s performance.2016MEF ASSOCIATESThe Child Support Performance and Incentive Act at 20: Examining Trends in State Performance 7
Current Collections PerformanceVariation in state current collection rates decreased overall, with improvedperformance among the lowest performing states each year since 2002.The median current collections rate increased from 59 to 64 percent from 2002 to 2016, an increase of 5percentage points. The differences in state performance narrowed from 2002 to 2016. In 2002, the differencebetween the highest and lowest rates was 36 percentage points. By 2016, the separation between the highand lowest state decreased to 31 percentage points.Distribution of Current Support Collection RatesDistribution of Current Support Collection Rates100%90807060OutlierQuartile 43Median25014030201002002‘03MEF ‘12‘13‘14‘15‘16The Child Support Performance and Incentive Act at 20: Examining Trends in State Performance 8
Arrearage CollectionsPerformanceStates’ efforts to collect child supportfrom cases with an arrearage moderatelyimproved since 2002.States made progress on the number of cases payingtowards arrears from 2002 and 2016, but likeperformance on current support collections, only onestate attained a performance score above the upperthreshold of 80 percent and eligible for the maximumincentive for arrears collection each year since 2011(see text box below for additional details). In 2002, 18states collected past-due support from less than 60percent of their arrearage cases and two states lessthan 40 percent of their arrearage cases. By 2016,only 10 states had arrearage collection rates lowerthan 60 percent and no state below 40 percent. Statearrearage collections percentages are presented byyear in Table 4 on page 20.Child Support Arrearage CasesScores by State 40%40–59%60–79% 80%20022006Measure 4: Child Support ArrearageCases ScoresThe percentage of arrearage cases that hada collection of past-due support. Since statesvary in how they handle arrearages, such ascharging interest, the measure counts payingcases, not arrearage dollars collected.2011If performance for arrearage cases is at or abovethe upper threshold of 80 percent, then statesare entitled to the maximum incentive.If states do not attain a rate of at least 40 percent,they are not eligible for an incentive for thatmeasure unless the state significantly improvedfrom its previous year’s performance.MEF ASSOCIATES2016The Child Support Performance and Incentive Act at 20: Examining Trends in State Performance 9
Arrearage Collections PerformanceState arrearage collections performance fluctuated from 2002 to 2016. Thoughstate differences in performance narrowed for most of the period, they began towiden in 2014.Between 2002 and 2016, the median arrears score grew by three percentage points, increasing from 61 to64 percent. State variation in performance scores fluctuated during the 14-year period. States'performances differences briefly narrowed in 2011 until 2014 when they began to widen.Distribution of Child Support Arrearage Scores100%9080706050Quartile 43Median2140Outlier30201002002‘03MEF ‘12‘13‘14‘15‘16The Child Support Performance and Incentive Act at 20: Examining Trends in State Performance 10
Cost-EffectivenessPerformanceCost-Effectiveness Scores by State 2The cost-effectiveness of state programsimproved overall from 2002 to 2016.Cost-effectiveness scores improved across states from2002 to 2016. In 2002, 14 states had cost-effectivenessratios at or above the upper threshold of 5.00 andtwo states fell below the lower threshold of 2.00 (seetext box below for additional details). By 2016, 26states had cost-effectiveness ratios at or above 5.00and none were below the lower threshold of 2.00. State cost- effectiveness ratios are presented byyear in Table 5 on page 21.2–5 520022006Measure 5: Cost-EffectivenessThe ratio of total amount collected through thechild support program to the total programexpenditures to make these collections.If performance for cost- effectiveness is at orabove the upper threshold of 5.00, then statesare entitled to the maximum incentive for thatmeasure.If states do not attain a score of 2.00, they arenot eligible for an incentive for that measure,unless the state significantly improves from itsprevious year’s performance.20112016MEF ASSOCIATESThe Child Support Performance and Incentive Act at 20: Examining Trends in State Performance 11
Cost-Effectiveness PerformanceState differences in cost-effectiveness persisted from 2002 to 2016 driven by largeimprovements of higher-performing states each year.The median cost effectiveness ratio was 5.15 in 2016, up from 4.49 in 2002. The difference between thehighest and lowest state cost-effectiveness ratio remained large, increasing from 6.34 in 2002 to 9.20 in2016. Three states consistently achieved cost-effectiveness ratios above 8.00 with one state reaching acost-effectiveness ratio over 12.00 in 2010. States in the bottom quartile consistently had costeffectiveness ratios below 4.50 since 2002.Distributionof Cost Effectivenessby StateDistributionof Cost Effectivenessby State 1413121110987OutlierQuartile 465433nMedia212102002‘03MEF ‘12‘13‘14‘15‘16The Child Support Performance and Incentive Act at 20: Examining Trends in State Performance 12
Recent Trends in StateProgram PerformanceRecent program performance improved more than it declined acrossmeasures. States continued to gain ground on support order establishmentand collections on current support due.To understand the extent to which states have continued to make performance gains in recentyears, we examined the number of states that increased or decreased performance in each measureover the most recent five-year period for which data are available (2011 to 2016). Nearly all statesimproved on at least one performance measure, and half ofall states improved on multiple measures during the period.Only eleven states experienced a sizeable decline on onemeasure, and no state had a sizeable decline on morethan one measure.Thirty-one states had a sizeable improvement of nearlyfour percentage points on the establishment of childsupport orders while only one state sizably declined onthat mea-sure. No states’ performance on collections ofcurrent sup-port due substantially declined over the fiveyear period, with 17 states making a sizeableimprovement of at least 3.5 percentage points. Thoughthree states experienced a sizeable decline on paternityestablishment, state performance overall on this measurewas above the upper threshold of 80 percent since 2011.How do we define a sizeableimprovement or decline?We consider a change between 2011 and 2016 ofat least one-half of a standard deviation largerthan the measure’s combined distribution overthe two time periods to be meaningful. Thestandard deviation measures the “spread” of thedata—that is, the variation from the average.The higher the standard deviation, the fartheraway a data point is from the average. Here, if astate’s performance change is farther from theaverage (i.e., 0.5 standard deviations), it isconsidered a sizeable improvement or decline.Recent State Performance:Performance Measure Improvements and Declines from 2011 to 2016The Number of States that.The Number of States that.DeclinedLittle to no changeImprovedPaternity Establishment3408Support Orders Establishment11931Current Support Collection3417Arrearage Collection33216Cost-Effectiveness4MEF ASSOCIATES398The Child Support Performance and Incentive Act at 20: Examining Trends in State Performance 13
Looking AheadOur analysis of state performance measures finds that states have made strongprogress across measures with dramatic improvements in paternity and orderestablishment. For both measures, nearly all states are now exceeding performance ceilings. On theother hand, there is still room for improvement on current and arrearage collections measures with nearlyall states performing below performance ceilings. Half of states are performing above the performanceceiling for cost-effectiveness.We also find that variations in state performance persist, but differences have narrowed for paternityestablishment, order establishment, and current order collections measures. Though state variation inperformance on arrearage collections declined for most of the period between 2002 and 2013, it began towiden from 2014 to 2016. Additionally, state differences in cost-effectiveness have increased.While there is consensus that the child support program is performing well overall, our analysis showsimprovement is not uniform across states. Future analyses would benefit from a closer examination ofwhat is driving state variation on these measures. For example, shifts in the composition of state caseloads,variation in state expenditures, and policy changes all have the potential to influence states’ performance.Similarly, the amount and sources of child support collections influence the portion of the total incentivepool for which states are eligible. Future research could further explore how shifts in the national childsupport caseload have influenced incentive payments to states.Suggested CitationBenson, Valerie H. and Riley Webster (2018). The Child Support Performance and Incentive Act at 20: ExaminingTrends in State Performance. Washington, DC: Office of the Assistant Secretary for Planning and Evaluation,U.S. Department of Health and Human Services.DisclaimerThe views expressed in this publication do not necessarily reflect the views or policies of the Office of theAssistant Secretary for Planning and Evaluation, U.S. Department of Health and Human Services.MEF ASSOCIATESThe Child Support Performance and Incentive Act at 20: Examining Trends in State Performance 14
AcknowledgmentsThe authors gratefully acknowledge the efforts of several individuals who haveassisted in the preparation of this brief. They particularly thank Lauren Antelo for herguidance and support throughout the project. The authors also thank Jennifer Burnszynski and KellyKinnison at ASPE. Staff members at the federal Office of Child Support Enforcement provided valuableguidance for this project. In particular, the authors thank Elaine Sorensen and Angela Ingram-Jonesfor their insights and thoughtful feedback on this document. At MEF, Asaph Glosser, Mike Fishman,and Justin Germain provided helpful comments on earlier drafts. The authors also thank Mindi andRiley Raker at Blank Space who expertly designed this document.MEF ASSOCIATESThe Child Support Performance and Incentive Act at 20: Examining Trends in State Performance 15
Notes1U.S. Government Accountability Office, Child Support Enforcement: Reorienting Management toward Achieving BetterProgram Results, GAO-97-14, October 1996.2Since 2011, incentive funding is no longer matched due to the passage of the DRA of 2005, and while incentivefunding is still important to state, its relative importance to states has since declined.3Throughout this brief, references to years refer to the federal fiscal year. Note FY2015 is the most recent dataavailable on incentive payments.4 Thebody of this brief presents data from the 50 states and the District of Columbia. Detailed state tables at theconclusion of the brief also include data from Guam, Puerto Rico, and the U.S. Virgin Islands.5Sorensen, E. (2016). The Story Behind the Numbers. Prepared for the Office of Child Support Enforcement,Administration for Children and Families, U.S. Department of Health and Human Services.6Specifically, IV-D PEP is the ratio of the number of children in the caseload in the fiscal year, or as of the end of thefiscal year, who were born to unmarried parents with paternity established or acknowledged, to the number ofchildren in the caseload as of the end of the preceding fiscal year who were born to unmarried parents. StatewidePEP is the ratio of the number of minor children in the state who were born to unmarried parents for whompaternity has been established or acknowledged during the fiscal year, to the number of children in the state bornto unmarried parents during the preceding fiscal year.MEF ASSOCIATESThe Child Support Performance and Incentive Act at 20: Examining Trends in State Performance 16
Detailed State TablesTABLE 1: Paternity Establishment Percentage Scores by State husettsNew HampshireNew JerseyNew YorkPennsylvaniaRhode ganMinnesotaMissouriNebraskaNorth DakotaOhioSouth DakotaWisconsinSouth 80%2002 2003 2004 2005 2006 2007 2008 2009 2010 2011 2012 2013 2014 2015 ��16AlabamaArkansasDelawareDistrict of sissippiNorth CarolinaOklahomaSouth CarolinaTennesseeTexasVirginiaWest dahoMontanaNevadaNew MexicoOregonUtahWashingtonWyomingUS TerritoriesGuamPuerto RicoVirgin IslandsMEF ASSOCIATESThe Child Support Performance and Incentive Act at 20: Examining Trends in State Performance 17
Detailed State TablesTABLE 2: Support Orders Established Percentage ew HampshireNew JerseyNew YorkPennsylvaniaRhode ganMinnesotaMissouriNebraskaNorth DakotaOhioSouth DakotaWisconsinSouth 80%65–79%2002 2003 2004 2005 2006 2007 2008 2009 2010 2011 2012 2013 2014 2015 ��16AlabamaArkansasDelawareDistrict of sissippiNorth CarolinaOklahomaSouth CarolinaTennesseeTexasVirginiaWest dahoMontanaNevadaNew MexicoOregonUtahWashingtonWyomingUS TerritoriesGuamPuerto RicoVirgin IslandsMEF ASSOCIATESThe Child Support Performance and Incentive Act at 20: Examining Trends in State Performance 18
Detailed State TablesTABLE 3: Current Support Collection Percentage ew HampshireNew JerseyNew YorkPennsylvaniaRhode ganMinnesotaMissouriNebraskaNorth DakotaOhioSouth DakotaWisconsinSouth60–79% 80%2002 2003 2004 2005 2006 2007 2008 2009 2010 2011 2012 2013 2014 2015 ��16AlabamaArkansasDelawareDistrict of sissippiNorth CarolinaOklahomaSouth CarolinaTennesseeTexasVirginiaWest dahoMontanaNevadaNew MexicoOregonUtahWashingtonWyomingUS TerritoriesGuamPuerto RicoVirgin IslandsMEF ASSOCIATESThe Child Support Performance and Incentive Act at 20: Examining Trends in State Performance 19
Detailed State TablesTABLE 4: Arrearage Cases Percentage ew HampshireNew JerseyNew YorkPennsylvaniaRhode ganMinnesotaMissouriNebraskaNorth DakotaOhioSouth DakotaWisconsinSouth60–79% 80%2002 2003 2004 2005 2006 2007 2008 2009 2010 2011 2012 2013 2014 2015 ��16AlabamaArkansasDelawareDistrict of sissippiNorth CarolinaOklahomaSouth CarolinaTennesseeTexasVirginiaWest dahoMontanaNevadaNew MexicoOregonUtahWashingtonWyomingUS TerritoriesGuamPuerto RicoVirgin IslandsMEF ASSOCIATESThe Child Support Performance and Incentive Act at 20: Examining Trends in State Performance 20
Detailed State TablesTABLE 5: Cost Effectiveness Ratio 22–5NortheastConnecticutMaineMassachusettsNew HampshireNew JerseyNew YorkPennsylvaniaRhode ganMinnesotaMissouriNebraskaNorth DakotaOhioSouth DakotaWisconsinSouth 52002 2003 2004 2005 2006 2007 2008 2009 2010 2011 2012 2013 2014 2015 2
CSPIA aimed to better align the incentive system to the child support program's mission to promote responsible parenting, family self- sufficiency, and child wellbeing. To achieve this aim, CSPIA added four performance measures related to establishing and enforcing child support orders—paternity establishment, support order establishment,