Transcription
Application ReportSLVA194 – AUGUST 2004Single-cell Battery Discharge Characteristics Using theTPS61070 Boost ConverterSK Loo and Keith Keller . Power Management ProductsABSTRACTThis application report presents practical single-cell battery discharge characteristics inreal-world application, and primarily focuses on the varying internal impedance of abattery and how that affects the battery terminal voltage.Contents.1Introduction2Battery Chemistry and Circuit Model . 223Battery Terminal Voltage vs Internal Cell Voltage. 34Internal Resistance of a Battery vs Battery Energy State . 55Alkaline Battery Testing . 56NiMH Battery Testing . 77Device Start-up vs Temperature . 98Summary . 10List of Figures12345678910SLVA194 – AUGUST 2004Battery Structure, Basic Circuit Model, and Discharge Characteristics .Discharge Curve of Single-Cell Battery Under Different Load Conditions .A Typical AA-Size Alkaline Battery Voltageat No Load Versus at 330-mW Discharge .Open Load and 85-mW Step Load of Alkaline Batterywith Terminal Voltage of 1.4 V (Left) and 1.3 V (Right) .Open Load and 85-mW Step Load of Alkaline Batterywith Terminal Voltage of 1.25 V (Left) and 1.22 V (Right) .Pulse Load of 10-sec Duration Showing the BatteryOpen Load Voltage (Left) and Loaded VoltageUntil Device Shutdown (Right) .Open and Step Load of NiMH Battery at Almost-Full Energy Capacityof 800 mAH (Left)—Open and Step Load of NiMH Batteryat 1/2-Full Energy Capacity of 800 mAH (Right) .Open and Step Load of NiMH Battery at 1/4-Full Energy Capacityof 800 mAH (Left)—Open and Step Load of NiMH Batteryat 1/10-Full Energy Capacity of 800 mAH (Right) .Pulse Load of 10-sec Duration Showing theBattery Open-Load Voltage (Left) and Loaded VoltageUntil Device Shutdown (Right) .Pulse Load of 10-sec Duration Showing the AAA-Size NiMH BatteryOpen Load Voltage (Left) and Loaded VoltageUntil Device Shutdown (Right)—550 mAH Capacity .3346667889Single-cell Battery Discharge Characteristics Using the TPS61070 Boost Converter1
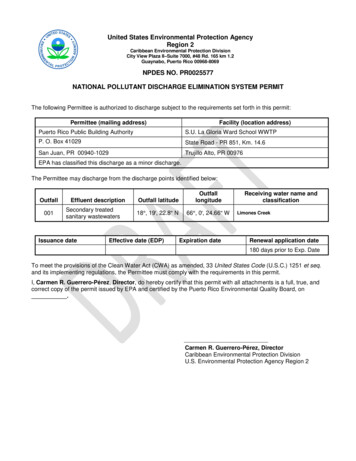
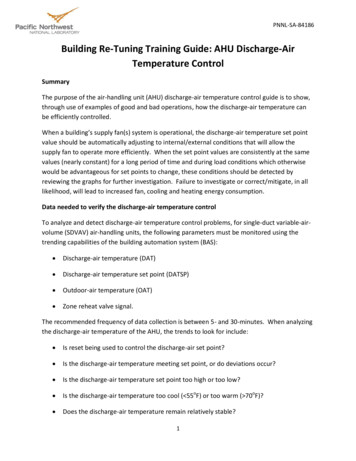
www.ti.comIntroduction11TPS61070 Start-up Voltage vs RL at Different Temperatures . 9List of Tables121TPS61070 Data Sheet Excerpt Showing Start-up Voltage . 2Specifications for an Alkaline and NiMH Battery. . 5IntroductionRegardless of battery chemistry—alkaline, nickel cadmium (NiCd), or nickel metal hydride (NiMH)—insingle-cell applications the battery voltage can be drained as low as 0.8 V 0.9 V when the battery isfinally empty. Ideally, the dc/dc boost converter start-up/operating voltage range should be specified downto this voltage range. This is true of Texas Instruments’ TPS6101x family of devices; the start-up voltage isspecified as 0.9 V to alleviate potential issues regarding start-up in such a low-voltage condition. After thedevice is started, it can be operated down to 0.8 V.Texas Instruments’ TPS61070/1 devices have a typical start-up voltage specified as 1.1 V (with a worstcase start-up voltage of 1.2 V). However, once started, these devices can operate at 0.9 V. The typicalspecified battery voltage in data specifications for NiMH batteries is 1.2 V. The typical discharge curve ofboth nickel and alkaline batteries is a non-linear curve from 1.5 V down to 0.9 V (with some batterycapacity remaining when the battery voltage is below 1.2 V). These battery voltage specifications, and thestart-up specifications of the TPS61070/1, generated some questions as to whether it is suitable forsingle-cell battery applications. In both cases, device start-up and battery energy utilization, the TPS61070works well in single-cell applications.Table 1. TPS61070 Data Sheet Excerpt Showing Start-up VoltageDC/DC STAGEPARAMETERVIVO2Minimum input voltage range for start-upTEST CONDITIONSMINRL 270 ΩTYPMAX1.11.2Input voltage range, after start-up0.95.5TPS61070 output voltage range1.85.5UNITVVBattery Chemistry and Circuit ModelTo address the differences between start-up voltage and operating voltage, it is necessary to understandthe basic structure of the battery. A simple model is represented in Figure 1.When the battery is not loaded, the terminal voltage is equal to the internal cell voltage, because there isno current flowing through the battery’s internal series resistor. This is indicated by the solid blue line ofFigure 1 and shows the actual cell voltage and the terminal voltage at no load.2Single-cell Battery Discharge Characteristics Using the TPS61070 Boost ConverterSLVA194 – AUGUST 2004
www.ti.comBattery Terminal Voltage vs Internal Cell VoltageCathodeElectrolyteAnodeConstant Current Disgharge,Transient EffectONVoltage VOFFI .R0RcCcBat Ra1000 1500 2000 2500 3000 3500 4000 4500CapacitorCapacitor ResistorBatteryCaBat RserCc2500Ca2Figure 1. Battery Structure, Basic Circuit Model, and Discharge CharacteristicsVoltage VOnce a load is applied to the battery, current flowing through the cells induces a voltage drop (I R)across the internal series resistor (or sometimes referred to as the internal impedance of the battery),resulting in a lower terminal voltage versus the cell voltage. In steady-state conditions this I R voltage isdirectly proportional to the load current multiplied with the internal resistance, as shown in Figure 2.However, during transient load conditions, due to the internal equivalent capacitance between theelectrode, electrolyte, and separator, the actual terminal voltage is non-linear and does not represent adirect relationship with the I R drop. At the initial condition of the load, due to this internal batterycapacitance, the terminal voltage drops slightly slower due to the discharge of the equivalent capacitancevoltage. After removal of the load, the terminal voltage does not recover to the cell voltage immediately.Rather, it takes several tens to hundreds of seconds for the terminal voltage to recover back to the cellvoltage as shown in Figure 1.Actual capacityI*RUsable capacityCapacity, AhQuseQmaxFigure 2. Discharge Curve of Single-Cell Battery Under Different Load Conditions3Battery Terminal Voltage vs Internal Cell VoltageA commonly misunderstood concept of battery voltage is that the specified discharge voltage curve in thedata sheet indicates the voltage under a specified load condition. The data sheet fails to mention the cellvoltage internal to the battery, hence, misleading the engineer into thinking that the terminal voltage at noload is the same as the terminal voltage under a load condition. This case only exists if the load on theSLVA194 – AUGUST 2004Single-cell Battery Discharge Characteristics Using the TPS61070 Boost Converter3
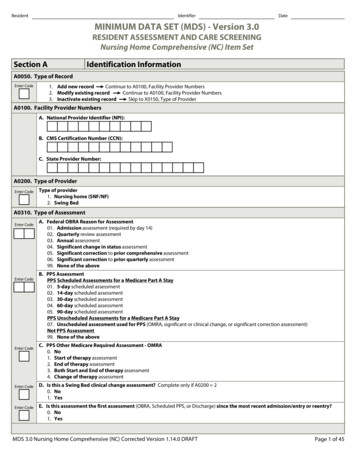
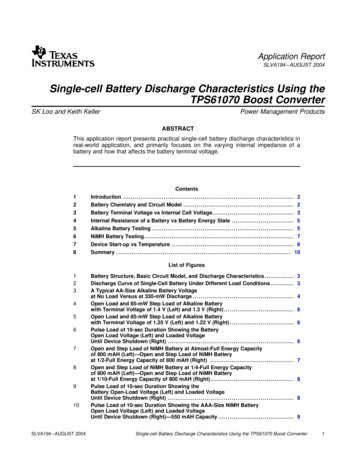
www.ti.comBattery Terminal Voltage vs Internal Cell Voltagebattery is so small that it does not generate noticeable voltage drop across the battery's internalresistance. This leads to discussion on whether the TPS61070/1 may not start up using analmost-depleted battery, and subsequently, not fully use the battery's capacity. The following experimentshows that in an actual application of a few tens of milliWatts, almost all energy in the battery is used andthe device readily starts up.Figure 3 shows the test results of a AA-size alkaline battery under a constant power discharge of 330 mWwith TPS61070 output voltage of 3.3 V. As evident from the two curves, when the terminal voltage isdischarged to 0.9 V, almost all of the battery's usable energy is depleted. However, sometime after theload is removed, the terminal voltage recovers to nearly 1.2 V although the battery energy is still almostempty.1.61.51.4VIN V,Rload Open1.31.21.11VIN V,Rload 33.17 0.90.80.70.6020 40 60 80 100 120 140 160 180 200 220 240 260 280 300 320t (Rload 33.17 ) [min]Figure 3. A Typical AA-Size Alkaline Battery Voltageat No Load Versus at 330-mW Discharge4Single-cell Battery Discharge Characteristics Using the TPS61070 Boost ConverterSLVA194 – AUGUST 2004
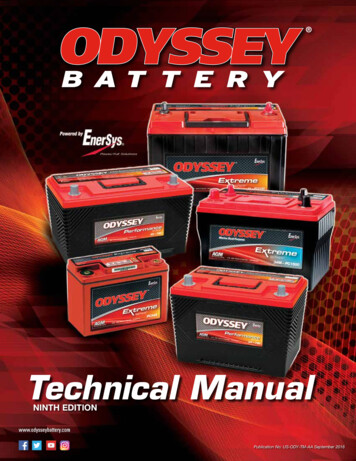
www.ti.comInternal Resistance of a Battery vs Battery Energy State4Internal Resistance of a Battery vs Battery Energy StateAn important parameter that usually is not well specified in a battery specification is the internal resistanceof the battery throughout the discharge cycle. When a battery discharges, its internal resistance increasesas its energy capacity decreases. Table 2 compares the specification of a typical AAA-size alkaline batteryand NiMH battery side-by-side. Note the change in internal resistance at different capacities of the NiMHbattery. This should also be specified for alkaline batteries.Table 2. Specifications for an Alkaline and NiMH Battery.Chemical System:AlkalineZinc-Manganese Dioxide (Zn/MnO2)(No Added Mercury or Cadmium)Description:Chemical System:Rechargeable 1.2 VNickel-Metal Hydride (NiMH)Designation:ANSI-24A, IEC-LR03Designation:ANSI-1.2H1Battery Voltage:1.5 VoltsBattery Voltage:1.2 VoltsInternal Resistance:Operating Temp:205 milliohms (Fresh)–18 C to 55 C (0 F to 130 F)Average Capacity:850 mAh ( to 1.0 volts)(Based on 170 mA (0.2C) discharge rate)Average Capacity:1,250 mAh (to 0.8 volts(Rated capacity at 25 mA continuousdrain)Average Weight:Volume:12.0 grams (0.4 oz)3.8 cubic centimeters )0.2 cubic inch)Average Weight:Volume:11.5 grams (0.4 oz)3.8 cubic centimeters (0.2 cubic inch)Jacket:Plastic LabelCell:One No. 3-312 (size AAA)Jacket:Plastic LabelShelf Life:7 years (80% of rated capacity)Internal ResistanceThe internal resistance of the cell varies with state of charge, as follows:Cell ChargedCell 1/2 Discharged100 milliohms1200 milliohms(tolerance of 20% applies to above values)How this parameter affects the start-up voltage and usable capacity of the battery in reality can be seen inthe following experiments. The TPS61070 EVM boosts the battery output voltage to 1.8 V while loaded at40 mA (constant power discharge of 72 mW at the output equates to about 85 mW discharge from thebattery because of 85% efficiency at this Vin). All waveforms are captured from an almost fullydischarged battery; the upper (yellow) waveform indicates the battery terminal voltage and the lower (blue)waveform indicates the output load current of 40-mA peak5Alkaline Battery TestingFigure 4 and Figure 5 show screen captures of the loading voltage waveform of a AAA-size alkalinebattery at different stages of battery discharge. The left image of Figure 4 shows that the open-loadbattery voltage of 1.4 V drops to 1.28 V when it is loaded at 85 mW. The right image shows that when thebattery is further discharged down to open-load battery voltage of 1.3 V the battery voltage drops to 1.14V, when it is loaded at 85 mW.When the battery is discharged even further to almost empty, the internal resistance continues toincrease, and the left image of Figure 5 shows the open-load battery voltage of 1.25 V, which drops to 1 Vwhen it is loaded at 85 mW. The right image shows open-load battery voltage of 1.22 V, which drops to0.9 V when it is loaded at 85 mW.Notice the increasing voltage drop from the initial test results of 112 mV (with open-load battery voltage of1.4 V) to 320 mV (with open-load battery voltage of 1.22 V). The internal resistance increases more thantwofold.SLVA194 – AUGUST 2004Single-cell Battery Discharge Characteristics Using the TPS61070 Boost Converter5
www.ti.comAlkaline Battery TestingFigure 4. Open Load and 85-mW Step Load of Alkaline Batterywith Terminal Voltage of 1.4 V (Left) and 1.3 V (Right)Figure 5. Open Load and 85-mW Step Load of Alkaline Batterywith Terminal Voltage of 1.25 V (Left) and 1.22 V (Right)Figure 6. Pulse Load of 10-sec Duration Showing the BatteryOpen Load Voltage (Left) and Loaded VoltageUntil Device Shutdown (Right)6Single-cell Battery Discharge Characteristics Using the TPS61070 Boost ConverterSLVA194 – AUGUST 2004
www.ti.comNiMH Battery TestingFigure 6 shows battery voltage under pulse load of 10-seconds-on / 10-seconds-off. Note the drop ofbattery voltage below 0.9 V when the battery is practically empty and the open-load battery voltagerecovers to 1.15 V when unloaded.These results show that in most applications the TPS61070 (with specified start-up voltage of 1.1 V) doesnot exhibit start-up issues, because the open-load battery voltage of an almost empty alkaline cell isaround 1.1 V. With a worst case start-up voltage of 1.2 V, the capacity losses due to this higher start-upvoltage is less than 5% of the battery capacity which should not be prohibitive in most applications.Remember that once the device is started, it readily operates down to 0.9 V.6NiMH Battery TestingThe same testing was also carried out using rechargeable NiMH batteries (tested in AAA-size with800-mAH and 550-mAH battery capacity).Figure 7 and Figure 8 show screen captures of the loading voltage waveform for a AAA-size 800-mAHnew NiMH battery at different stages of discharge. The left image of Figure 7 shows the open-load batteryvoltage of 1.34 V when the battery is almost full, which drops to 1.29 V when it is loaded at 85 mW. Theright image shows the voltage waveform of the battery when it is discharged to about half its capacity. Theopen-load battery voltage is about 1.23 V and then drops to 1.18 V when it is loaded at 85 mW. Figure 8shows the voltage waveform of the battery when it is discharged to about 1/4 its capacity (left image); theopen-load battery voltage is about 1.17 V and then drops to 1.11 V when it is loaded at 85 mW.Subsequently, the right image of Figure 8 shows the same voltage characteristics when the battery isdischarged to about 1/10 the capacity; the open-load battery voltage is about 1.16 V and then drops to1.10 V when it is loaded at 85 mW.Figure 9 shows the battery voltage with a pulse load of 10-seconds-on / 10-seconds-off. The screencapture on the right shows the battery voltage dropping to a level which shuts down the TPS61070. Notethe drop of battery voltage below 0.9 V when the battery is practically depleted. However, the open-loadbattery voltage recovered back to 1.08 V within 1 minute and eventually back to about 1.15 V after 30minutes.Figure 7. Open and Step Load of NiMH Battery at Almost-Full Energy Capacityof 800 mAH (Left)—Open and Step Load of NiMH Batteryat 1/2-Full Energy Capacity of 800 mAH (Right)SLVA194 – AUGUST 2004Single-cell Battery Discharge Characteristics Using the TPS61070 Boost Converter7
www.ti.comNiMH Battery TestingFigure 8. Open and Step Load of NiMH Battery at 1/4-Full Energy Capacityof 800 mAH (Left)—Open and Step Load of NiMH Batteryat 1/10-Full Energy Capacity of 800 mAH (Right)Figure 9. Pulse Load of 10-sec Duration Showing theBattery Open-Load Voltage (Left) and Loaded VoltageUntil Device Shutdown (Right)8Single-cell Battery Discharge Characteristics Using the TPS61070 Boost ConverterSLVA194 – AUGUST 2004
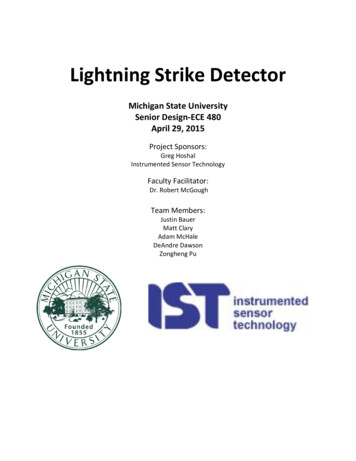
www.ti.comDevice Start-up vs TemperatureFigure 10. Pulse Load of 10-sec Duration Showing the AAA-Size NiMH BatteryOpen Load Voltage (Left) and Loaded VoltageUntil Device Shutdown (Right)—550 mAH CapacityFigure 10 shows the battery voltage with a pulse load of 10-seconds-on / 10-seconds-off with a 550-mAHNiMH battery after a few hundred cycles of usage. Notice the sharp drop in battery terminal voltage downto 0.9 V, and the recovery voltage up to 1.15 V when the load is removed due to increased batteryresistance after cyclic usage of the NiMH battery.7Device Start-up vs TemperatureVIN Input Voltage Minimum Startup VFigure 11 shows the start-up voltage versus temperature using the TPS61070 EVM with resistive loadconnected at the 1.8-V 01.081.061.041.0210.980.960.940.920.900Device Started With ENSet to HighTA 0 CTA 25 CTA 60 CTA 85 C100200300400500600700800900 1000RL Load Resistance Figure 11. TPS61070 Start-up Voltage vs RL at Different TemperaturesSLVA194 – AUGUST 2004Single-cell Battery Discharge Characteristics Using the TPS61070 Boost Converter9
www.ti.comSummary8SummaryThis application report presents practical single-cell battery discharge characteristics in real-worldapplication, and primarily focuses on the varying internal impedance of a battery and how that affects thebattery terminal voltage.The TPS61070/1 devices work well in most single-cell boost applications. Though in some cases thedischarging battery terminal voltage could be lower than the start-up voltage of the device, the batteryvoltage readily recovers above 1.1 V once the load is disconnected. Therefore, the TPS61070 does nothave difficulty starting up again even when the battery energy capacity is minimal at these terminalvoltages.On a final note, the discharging of the battery in an actual application exhibits constant power dischargerather than a constant current discharge. This shortens battery lifetime at lower voltages when nearing itsend of discharge, further reducing the battery voltage (during constant power discharge, the dischargecurrent increases as terminal voltage decreases to supply the same power to the load). However, oncethe load is disconnected, or the device is shut down, the battery voltage recovers to a higher voltage(typically above 1.1 V).10Single-cell Battery Discharge Characteristics Using the TPS61070 Boost ConverterSLVA194 – AUGUST 2004
IMPORTANT NOTICETexas Instruments Incorporated and its subsidiaries (TI) reserve the right to make corrections, modifications,enhancements, improvements, and other changes to its products and services at any time and to discontinueany product or service without notice. Customers should obtain the latest relevant information before placingorders and should verify that such information is current and complete. All products are sold subject to TI’s termsand conditions of sale supplied at the time of order acknowledgment.TI warrants performance of its hardware products to the specifications applicable at the time of sale inaccordance with TI’s standard warranty. Testing and other quality control techniques are used to the extent TIdeems necessary to support this warranty. Except where mandated by government requirements, testing of allparameters of each product is not necessarily performed.TI assumes no liability for applications assistance or customer product design. Customers are responsible fortheir products and applications using TI components. To minimize the risks associated with customer productsand applications, customers should provide adequate design and operating safeguards.TI does not warrant or represent that any license, either express or implied, is granted under any TI patent right,copyright, mask work right, or other TI intellectual property right relating to any combination, machine, or processin which TI products or services are used. Information published by TI regarding third-party products or servicesdoes not constitute a license from TI to use such products or services or a warranty or endorsement thereof.Use of such information may require a license from a third party under the patents or other intellectual propertyof the third party, or a license from TI under the patents or other intellectual property of TI.Reproduction of information in TI data books or data sheets is permissible only if reproduction is withoutalteration and is accompanied by all associated warranties, conditions, limitations, and notices. Reproductionof this information with alteration is an unfair and deceptive business practice. TI is not responsible or liable forsuch altered documentation.Resale of TI products or services with statements different from or beyond the parameters stated by TI for thatproduct or service voids all express and any implied warranties for the associated TI product or service andis an unfair and deceptive business practice. TI is not responsible or liable for any such statements.Following are URLs where you can obtain information on other Texas Instruments products and samplifier.ti.comAudiowww.ti.com/audioData andInterfaceinterface.ti.comDigital ilitarywww.ti.com/militaryPower Mgmtpower.ti.comOptical Telephonywww.ti.com/telephonyVideo & Mailing Address:Texas InstrumentsPost Office Box 655303 Dallas, Texas 75265Copyright 2004, Texas Instruments Incorporated
When the battery is discharged even further to almost empty, the internal resistance continues to increase, and the left image of Figure 5 shows the open-loadbattery voltage of 1.25 V, which drops to 1 V when it is loaded at 85 mW. The right image shows open-loadbattery voltage of 1.22 V, which drops to 0.9 V when it is loaded at 85 mW.