Transcription
Safety Analysis of Low-VolumeRural Roads in IowaFinal ReportDecember 2010Sponsored bythe Iowa Department of Transportation(InTrans Project 07-309)
About the Institute for TransportationThe mission of the Institute for Transportation (InTrans) at Iowa State University is to developand implement innovative methods, materials, and technologies for improving transportationefficiency, safety, reliability, and sustainability while improving the learning environment ofstudents, faculty, and staff in transportation-related fields.Iowa State University Disclaimer NoticeThe contents of this report reflect the views of the authors, who are responsible for the factsand the accuracy of the information presented herein. The opinions, findings and conclusionsexpressed in this publication are those of the authors and not necessarily those of the sponsors.The sponsors assume no liability for the contents or use of the information contained in thisdocument. This report does not constitute a standard, specification, or regulation.The sponsors do not endorse products or manufacturers. Trademarks or manufacturers’ namesappear in this report only because they are considered essential to the objective of the document.Iowa State University Non-discrimination StatementIowa State University does not discriminate on the basis of race, color, age, religion, nationalorigin, sexual orientation, gender identity, sex, marital status, disability, or status as a U.S.veteran. Inquiries can be directed to the Director of Equal Opportunity and Diversity,(515) 294-7612.Iowa Department of Transportation StatementsFederal and state laws prohibit employment and/or public accommodation discrimination onthe basis of age, color, creed, disability, gender identity, national origin, pregnancy, race, religion,sex, sexual orientation or veteran’s status. If you believe you have been discriminated against,please contact the Iowa Civil Rights Commission at 800-457-4416 or Iowa Department ofTransportation’s affirmative action officer. If you need accommodations because of a disability toaccess the Iowa Department of Transportation’s services, contact the agency’s affirmative actionofficer at 800-262-0003.The preparation of this (report, document, etc.) was financed in part through funds providedby the Iowa Department of Transportation through its “Agreement for the Management ofResearch Conducted by Iowa State University for the Iowa Department of Transportation,” andits amendments.The opinions, findings, and conclusions expressed in this publication are those of the authorsand not necessarily those of the Iowa Department of Transportation.
Technical Report Documentation Page1. Report No.InTrans Project 07-3092. Government Accession No.4. Title and SubtitleSafety Analysis of Low-Volume Rural Roads in Iowa3. Recipient’s Catalog No.5. Report DateDecember 20106. Performing Organization Code7. Author(s)Reginald R. Souleyrette, Mehmet Caputcu, Thomas J. McDonald, Robert B.Sperry, Zachary N. Hans, and Dan Cook8. Performing Organization Report No.InTrans Project 07-3099. Performing Organization Name and AddressInstitute for TransportationIowa State University2711 South Loop Drive, Suite 4700Ames, IA 50010-866410. Work Unit No. (TRAIS)12. Sponsoring Organization Name and AddressIowa Department of TransportationOffice of Traffic and Safety800 Lincoln WayAmes, IA 5001011. Contract or Grant No.13. Type of Report and Period CoveredFinal14. Sponsoring Agency Code15. Supplementary NotesVisit www.intrans.iastate.edu for color PDF files of this and other research reports.16. AbstractIowa features an extensive surface transportation system, with more than 110,000 miles of roadway, most of which is under thejurisdiction of local agencies. Given that Iowa is a lower-population state, most of this mileage is located in rural areas that exhibit lowtraffic volumes of less than 400 vehicles per day. However, these low-volume rural roads also account for about half of all recordedtraffic crashes in Iowa, including a high percentage of fatal and major injury crashes.This study was undertaken to examine these crashes, identify major contributing causes, and develop low-cost strategies for reducing theincidence of these crashes. Iowa’s extensive crash and roadway system databases were utilized to obtain needed data. Using descriptivestatistics, a test of proportions, and crash modeling, various classes of rural secondary roads were compared to similar state of Iowacontrolled roads in crash frequency, severity, density, and rate for numerous selected factors that could contribute to crashes.The results of this study allowed the drawing of conclusions as to common contributing factors for crashes on low-volume rural roads,both paved and unpaved. Due to identified higher crash statistics, particular interest was drawn to unpaved rural roads with trafficvolumes greater than 100 vehicles per day. Recommendations for addressing these crashes with low-cost mitigation are also included.Because of the isolated nature of traffic crashes on low-volume roads, a systemic or mass action approach to safety mitigation wasrecommended for an identified subset of the entire system. In addition, future development of a reliable crash prediction model isdescribed.17. Key Wordscrash mitigation—crash model—fatal and major injury crashes—low-volume roadsafety—rural road safety—unpaved road safety19. Security Classification (of thisreport)Unclassified.Form DOT F 1700.7 (8-72)20. Security Classification (of thispage)Unclassified.18. Distribution StatementNo restrictions.21. No. of Pages22. Price120NAReproduction of completed page authorized
Safety Analysis of Low-VolumeRural Roads in IowaFinal ReportDecember 2010Principal InvestigatorReginald R. SouleyretteGerald and Audrey Olson Professor of Civil EngineeringInstitute for Transportation, Iowa State UniversityGraduate AssistantMehmet CaputcuInstitute for Transportation, Iowa State UniversityCollaboratorsThomas J. McDonaldResearch EngineerInstitute for Transportation, Iowa State UniversityRobert B. SperryResearch EngineerInstitute for Transportation, Iowa State UniversityZachary N. HansResearch EngineerInstitute for Transportation, Iowa State UniversityPreparation of this report was financed in partfrom funds provided by the Iowa Department of Transportationthrough its research management agreement with theInstitute for Transportation(InTrans Project 07-309)A report fromInstitute for TransportationIowa State University2711 South Loop Drive, Suite 4700Ames, IA 50010-8664Phone: 515-294-8103Fax: 515-294-0467www.intrans.iastate.edu
TABLE OF CONTENTSACKNOWLEDGMENTS . IX1.INTRODUCTION AND PROBLEM IDENTIFICATION .1Background .2Survey of County Engineers .92.PREVIOUS WORK .10Low-Volume Road Safety Problems .10Low-Volume Road Safety Solutions .182006 CHSP Local Roads Team Strategy Plan .21Rural Local Road Trends .22Urban Local Road Trends .25General Trend Observations .28Proposed Strategies .29Recommended Programs and Projects.303.METHODOLOGY .321. Descriptive Statistics and Statistical Tests .32Test of Proportions.332. Crash Model Development .344.ANALYSIS AND RESULTS .36Statewide Descriptive Statistics and Statistical Tests .36Descriptive Statistics .36Test of Proportions.38Results .385.SUPPLEMENTAL ANALYSES.43Younger Drivers.43Crashes Involving Agricultural Equipment .43Crash Level Model.44Three-Leg Intersections .456.CONCLUSIONS AND RECOMMENDATIONS .46Conclusions .46Recommendations .497.REFERENCES .51APPENDIX 1. HISTORICAL SUMMARY OF RURAL CRASH AND FATALITY RATES .53APPENDIX 2. SUMMARY OF COUNTY ENGINEERS SURVEY .55APPENDIX 3. DETAILED STUDY OF CRASH RECORDS AND FIELD CONDITIONS .61Selection of Candidate Counties for Detailed Study .61Selected Counties .61Selection of Candidate Sites and Routes for Detailed Study .61v
Road Segment Selection .62Intersection Selection .64Field and Detailed Evaluation .65Field Visits and Imaging .66Video and Photo Processing .67Video Evaluation .68APPENDIX 4. PRELIMINARY CHARACTERISTICS OF INTEREST FOR SITE VISITS(DESIRED DATA FOR CRASH SITE REVIEW) .69APPENDIX 5. SAMPLE TABLE SHOWING THE TEST OF PROPORTIONS RESULTS(0-100 UNPAVED SECONDARY VS. TWO-LANE PRIMARY).71APPENDIX 6. SUMMARY OF RESULTS FROM TEST OF PROPORTIONS ON SEVENCOMPARISON PAIRS .77APPENDIX 7. COMPARISON DATA FOR VARIOUS ROAD CLASSES .83APPENDIX 8. LIMDEP MODEL .101Variables .101County Data .105Limdep Output .108vi
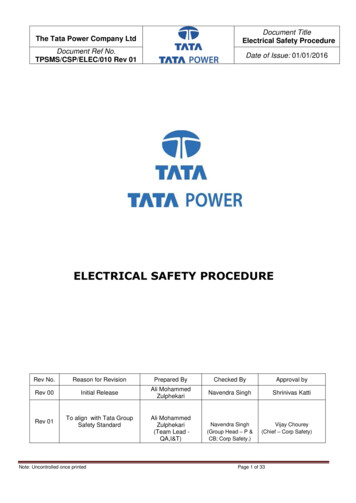
LIST OF FIGURESFigure 1. Percent distribution of roadway characteristics of undivided two-lane rural roadsin Iowa by road category.2Figure 2. Trends in safety performance of undivided two-lane rural roads in Iowa, by roadcategory and average annual daily traffic .5Figure 3. Historical trend of fatal crash rates on Iowa rural roads .6Figure 4. Historical trend of fatal and injury crash rates on Iowa rural roads .7Figure 5. Historical trend of total crash rates on Iowa rural roads .7Figure 6. Thematic maps showing crash frequency, density, and rate by county .8Figure 7. Unpaved roads 100 AADT.50Figure 8. Site visit map for Winneshiek County.62Figure 9. Sample “AADT-consistent” corridor .63Figure 10. Map marking style for segments .64Figure 11. Map marking style for intersections .65Figure 12. Screen snapshot of the resources used in the evaluation procedure .67vii
LIST OF TABLESTable 1. Nationwide summary of fatality rate and density on rural local roads by state.3Table 2. Characteristics of rural undivided two-lane roads in Iowa 2001-2007 total.4Table 3. Geometric features of undivided two-lane rural roads in Iowa by centerline milesand percent distribution.4Table 4. Summary of accident types and characteristics for low-volume road sites .11Table 5. Wyoming injury crash rates for selected unpaved road sections vs. all roads.13Table 6. Speed data based on road types .14Table 7. Speed data under different weather conditions .14Table 8. Percentage of crashes on gravel roads for different speed limits and crash severities .14Table 9. Categories of the variables for crashes on gravel roads.15Table 10. Characteristics of gravel road crashes in Kansas (1996-2005) .16Table 11. A proposed approach for functional classification of rural local roads .20Table 12. Serious single-vehicle run-off road and multiple-vehicle cross centerline crashes .22Table 13. Iowa rural local roads – serious crashes by age 2001-2005 .23Table 14. Iowa rural local roads – serious crashes by time of day 2001-2005 .24Table 15. Iowa rural local roads serious crashes – driver contributing circumstances2001-2005 .25Table 16. Iowa urban local roads serious crashes – driver contributing circumstances2001-2005 .26Table 17. Iowa urban local roads – serious crashes by time of day 2001-2005 .27Table 18. Iowa urban local roads – serious crashes by age 2001-2005 .28Table 19. Data sources utilized in the study .34Table 20. Partial summary of descriptive statistics for two-lane rural Iowa roads.37Table 21. Road category comparison.38Table 22. Highest relative differences ( 3.0) in crash proportions, low-volume(0-400 AADT) rural roads compared to primary two-lane rural roads 2001-2008 .39Table 23. Highest absolute differences in crash proportions ( 10%), secondary low-volume(0-400 AADT) rural roads compared to primary two-lane rural roads 2001-2008 .40Table 24. Highest relative differences ( 3.0), secondary unpaved ( 100 AADT)rural roads compared to primary two-lane rural roads 2001-2008 .41Table 25. Highest absolute differences ( 10%), secondary unpaved ( 100 AADT)rural roads compared to primary two-lane rural roads 2001-2008 .42viii
ACKNOWLEDGMENTSThe content of this report reflects the views of the authors, who are responsible for the facts andthe accuracy of the information presented herein. The opinions, findings, and conclusionsexpressed in this publication are those of the authors and not necessarily those of the sponsors.The sponsors assume no liability for the content or use of the information contained in thisdocument. This report does not constitute a standard, specification, or regulation.This project was supported by the Iowa Department of Transportation (DOT) Office of Trafficand Safety using Traffic Safety Improvement Program funds.The authors wish to thank the following individuals for their contributions to this report: Project advisory committee members:o Bill Belzer, Henry Countyo LeRoy Bergmann, Local Systems-Iowa DOTo Lee Bjerke, Winneshiek Countyo Jim George, Dallas Countyo Troy Jerman, Traffic Safety-Iowa DOTo Darren Moon, Story Countyo Michael Pawlovich, Traffic Safety-Iowa DOTProfessor Nadia Gkritza of the Center for Transportation Research and Education(CTRE)ix
1. INTRODUCTION AND PROBLEM IDENTIFICATIONEach year in the United States, about 40,000 people lose their lives in highway crashes. Many ofthese fatal crashes occur on high-speed, higher-volume roads. It is on these roads that mostefforts have been targeted, particularly by the engineering and enforcement communities. Also,most previous crash mitigation strategies have targeted high-crash locations or “black spots.”Naturally, because vehicular traffic, or exposure, is the greatest predictor of a road’s crashperformance, it has been logical to focus on higher-volume roads and intersections that,statistically speaking, have many more crashes than their lower-volume road (LVR)counterparts. These higher-volume roads were, and, in some cases, still are, the greatest “siteswith promise” for improvement.The focus of this study is a crash analysis of low-volume roads in Iowa. Low-volume roads aredefined as roads located in rural areas with daily traffic volumes of less than or equal to 400vehicles per day (vpd). Low-volume roads are typically undivided, two-lane roads, either pavedor unpaved. As the vast majority of state-owned and maintained (primary) rural roads in Iowahave daily volumes greater than 400 vpd, primary roads are not considered to be low-volumeroads in this study. LVRs in Iowa and in similar rural states experience a greater proportion ofthe total statewide number of severe crashes than do Rural LVRs in more populous states.During a seven-year period (2001–2007), more than 6,000 fatal and major injury crashes wereobserved on undivided, two-lane rural roads in Iowa. More than 4,000 of these crashes occurredon local roads, while less than 2,000 took place on primary roads. Half of the rural local roadcrashes were on facilities with 400 vpd or less traffic. Local roads in Iowa comprise the majorityof the rural surface transportation system, or about 90,000 miles of roads, of which almost 80%are unpaved (source: Iowa Department of Transportation (DOT) Office of Transportation Data).Most of these roads experience very low traffic volumes. Because of the roads’ low volumes,fewer crashes can be expected at given low-volume road locations. As a result, the traditional“black spot” approach to addressing safety problems on these low-volume roads is not as costeffective as on other roads. “Chasing fatals” can be the outcome of deploying such a strategy.Due to the random nature of low-volume road crashes, a more systematic or mass-actionapproach is necessary.While much work has been done to identify safety problems and develop mitigation strategiesfor higher-volume roads, less effort has gone toward rural LVR safety issues, especially in Iowa.However, interest in rural LVR safety is increasing nationally. Iowa is in a unique position tostudy rural LVR safety, primarily due to the state’s detailed crash and roadway feature databases.Therefore, this project was proposed to investigate low-volume rural road safety in Iowa,identify safety concerns, and propose safety mitigation strategies to address the identifiedproblems. The study focused on both paved and unpaved low-volume local roads (or secondaryroads) and compares the safety performance of these types of roads to each other and to the statemaintained, paved, two-lane roads that carry mostly higher volumes and generally benefit from amore consistent maintenance and traffic control policy. While the study focuses only on Iowa,results are extensible to other states and regions.1
Historically, most of the attention paid to safety improvements has been directed toward highervolume roadways. However, current crash data reveal that more than half of all fatal and seriousinjury crashes on Iowa’s local rural roads occur on facilities with less than 400 vpd. Moreinformation is needed to identify potential problem areas on these low-volume roads and devisemitigation strategies to address this serious public safety concern.This project addressed the problem of rural low-volume road safety by initiating an in-depthdatabase investigation of the history of total and serious crashes on very low-volume rural roads,paved and unpaved, over the most current years on record. Contributing cause, drivercharacteristics, and crash location were characterized to identify any areas of commonalityamong these crashes. Statistical tests (tests of proportions) were applied to identify the uniquesafety concerns on rural low-volume roads. Site-specific conditions were evaluated from videoand still photography, and individual crash records and narratives were reviewed. Finally, acrash-based model was developed to investigate key causal factors.BackgroundIowa is among the most rural states in the United States. It has the ninth largest network of rurallocal roads and the fifteenth highest fatality rate, as shown in Table 1. (Note: The FederalHighway Administration (FHWA) uses a different definition of local road than is used in thisreport, and, as such, numbers from this table are used to compare states only). The table alsoshows that some other Midwestern states demonstrate similarly high rankings and large rurallocal roads networks.Source: 2007 Iowa DOT GeographicInformation Management System (GIMS)Figure 1. Percent distribution of roadway characteristics of undivided two-lane rural roadsin Iowa by road category2
Table 1. Nationwide summary of fatality rate and density on rural local roads by stateStateGrand TotalU.S. orth th DakotaPennsylvaniaGeorgiaCaliforniaNorth uckyNew YorkNew MexicoMississippiWashingtonLouisianaVirginiaSouth CarolinaOregonIdahoArizonaFloridaUtahWest VirginiaNevadaMaineWyomingMarylandVermontNew HampshireAlaskaMassachusettsNew JerseyConnecticutDelawarePuerto RicoHawaiiRhode IslandNumber nk 20.0000.0010.0030.0030.0120.0190.0060.000Rank 332552Source: Adapted from Highway Statistics developed by the FHWA 2006Figure 1, Table 2, and Table 3present information on various characteristics of undivided twolane rural roads in Iowa. As shown in Table 2, the crash rate per 100 million vehicle milestraveled (100MVMT) is disproportionately high for the lowest-volume secondary roads beinginvestigated. As shown graphically in Figure 1, the reason for the extremely low crash density isclearly based on the vast mileage of the low-volume system.3
Table 2. Characteristics of rural undivided two-lane roads in Iowa 2001-2007 totalRoad Category(Road System;AADT Range)WeightedAverage Total Crashof ADT Frequency %Secondary; 0‐100Total DailyVMTTotalCrash Rate Crash DensityCenterline‐(per 100M (crash per%Miles%VMT)100 miles)3716,510 172,519,000967,963 71Secondary; 101‐40022013,105 142,588,000 1011,766 12Secondary; 401‐100063016,684 184,443,000 167,0531,70014,784 164,217,000 15Secondary; 1001‐13500Primary; 70‐1000Primary; 2761113426232,045 34 12,880,000 475,2025976161,9952583,600Source: 2001-2007 Iowa DOT Crash Database and 2007 GIMSTable 3. Geometric features of undivided two-lane rural roads in Iowa by centerline milesand percent distributionRoad System;AADT RangeSecondary;0‐100Length %Grand Total:67,963 71Surface Paved1,0632TypeUnpaved 66,900 98Surface 24 ft35,070 52Width 24 feet 32,893 48Yes63,044 93ShoulderNo4,9197Flat20,878 31Rolling43,351 64TerrainHilly3,3445N/A3901Secondary; Secondary; Secondary;Primary;Primary;Grand101‐400401‐1000 1001‐1350070‐10001001‐12200TotalLength % Length % Length % Length % Length % Length11,766 12 7,0537 2,54737611 5,202595,2917,421 63 6,986 99 2,537 100761 100 5,202 10023,9704,345 376611071,3214,372 37 1,382 20 1,047 41417 55 4,532 8746,8217,394 63 5,670 80 1,500 59344 45669 1348,47011,720 100 7,027 100 2,534 99760 100 5,186 10090,27145261311165,02030,9483,996 34 2,626 37940 37290 38 2,219 437,046 60 4,090 58 1,501 59420 55 2,819 5459,22872263365107451716434,7232392Source: 2001-2007 Iowa DOT GIMS4%2575495195532625Secondary;0‐400Length %79,7298,484 1171,245 8939,442 4940,286 5174,764 944,965624,873 3150,397 634,06653920
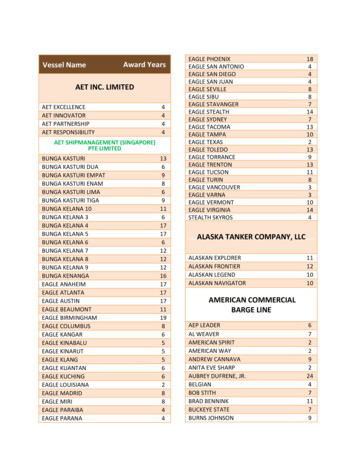
Source: 2001-2007 Iowa DOT CrashDatabase and 2007 GIMSFigure 2. Trends in safety performance of undivided two-lane rural roads in Iowa, by roadcategory and average annual daily trafficAs shown in Figure 2, the crash density of secondary roads with traffic volumes greater than1,000 vehicles per day (VPD) is similar to that of state highways with the same volumes,although the crash rate for the secondary roads is nearly one and a half times that of primaryroads. The road characteristics in Table 3 provide a partial explanation, as early design standardsfor secondary roads were not as high as those used for paving primary highways.Figures 3 through 5 summarize historical trends for fatal, fatal and injury, and total crash rates onroads belonging to three rural jurisdictional classes.5
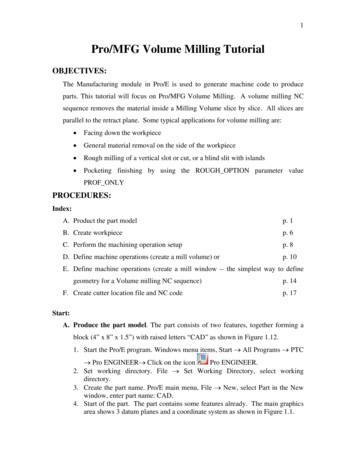
*Ratio of fatal crash rate on rural local roads to fatal crash rate on rural primary roads.**Because of the unavailable crash data for 1976, summary totals and rates don’tinclude 1976 data. ***For 2001, approximately 2000 crashes are missing due to asignificant crash report form change and resultant database repository changes.Source: 2001-2007 Iowa DOTOffice of Traffic and SafetyFigure 3. Historical trend of fatal crash rates on Iowa rural roadsFigure 3 shows a significant increase in the ratio of local to primary crash rates in the past fewyears. Figure 4 and Figure 5 show a similar increasing trend, although to a lesser degree. Thesetrends may be explained partially by the success of improvements made to the primary system.Pote
Safety Analysis of Low-Volume Rural Roads in Iowa December 2010 6. Performing Organization Code 7. Author(s) 8. . Price Unclassified. Unclassified. 120 NA Form DOT F 1700.7 (8-72) Reproduction of completed page authorized . Safety Analysis of Low-Volume Rural Roads in Iowa Final Report December 2010