Transcription
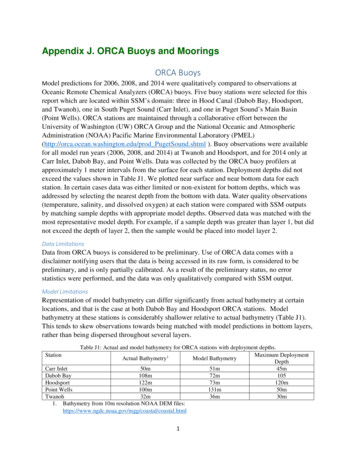
Appendix J. ORCA Buoys and MooringsORCA BuoysModel predictions for 2006, 2008, and 2014 were qualitatively compared to observations atOceanic Remote Chemical Analyzers (ORCA) buoys. Five buoy stations were selected for thisreport which are located within SSM’s domain: three in Hood Canal (Dabob Bay, Hoodsport,and Twanoh), one in South Puget Sound (Carr Inlet), and one in Puget Sound’s Main Basin(Point Wells). ORCA stations are maintained through a collaborative effort between theUniversity of Washington (UW) ORCA Group and the National Oceanic and AtmosphericAdministration (NOAA) Pacific Marine Environmental Laboratory (PMEL)(http://orca.ocean.washington.edu/prod PugetSound.shtml ). Buoy observations were availablefor all model run years (2006, 2008, and 2014) at Twanoh and Hoodsport, and for 2014 only atCarr Inlet, Dabob Bay, and Point Wells. Data was collected by the ORCA buoy profilers atapproximately 1 meter intervals from the surface for each station. Deployment depths did notexceed the values shown in Table J1. We plotted near surface and near bottom data for eachstation. In certain cases data was either limited or non-existent for bottom depths, which wasaddressed by selecting the nearest depth from the bottom with data. Water quality observations(temperature, salinity, and dissolved oxygen) at each station were compared with SSM outputsby matching sample depths with appropriate model depths. Observed data was matched with themost representative model depth. For example, if a sample depth was greater than layer 1, but didnot exceed the depth of layer 2, then the sample would be placed into model layer 2.Data LimitationsData from ORCA buoys is considered to be preliminary. Use of ORCA data comes with adisclaimer notifying users that the data is being accessed in its raw form, is considered to bepreliminary, and is only partially calibrated. As a result of the preliminary status, no errorstatistics were performed, and the data was only qualitatively compared with SSM output.Model LimitationsRepresentation of model bathymetry can differ significantly from actual bathymetry at certainlocations, and that is the case at both Dabob Bay and Hoodsport ORCA stations. Modelbathymetry at these stations is considerably shallower relative to actual bathymetry (Table J1).This tends to skew observations towards being matched with model predictions in bottom layers,rather than being dispersed throughout several layers.Table J1: Actual and model bathymetry for ORCA stations with deployment depths.StationMaximum DeploymentActual Bathymetry1Model BathymetryDepthCarr Inlet50m51m45mDabob Bay108m72m105Hoodsport122m73m120mPoint Wells100m131m50mTwanoh32m36m30m1. Bathymetry from 10m resolution NOAA DEM l.html1
Figure J1: Map of ORCA stations selected for this study2
Results and DiscussionFigure J2: 2006 SSM vs. Twanoh buoy data for DO, temperature, and salinity at surface and bottom layers. Modelresults are captured at a 1 hour frequency while ORCA data collection frequency largely varies.3
Figure J3: 2006 SSM vs. Hoodsport buoy data for DO, temperature, and salinity at surface and bottom layers.Model results are captured at a 1 hour frequency while ORCA data collection frequency largely varies.Figure J4: 2008 SSM vs. Twanoh buoy data for DO, temperature, and salinity at surface and bottom layers. Modelresults are captured at a 1 hour frequency while ORCA data collection frequency largely varies.4
Figure J5: 2008 SSM vs. Hoodsport buoy data for DO, temperature, and salinity at surface and bottom layers.Model results are captured at a 1 hour frequency while ORCA data collection frequency largely varies.Figure J6: 2014 SSM vs. Carr Inlet buoy data for DO, temperature, and salinity at surface and bottom layers. Modelresults are captured at a 1 hour frequency while ORCA data collection frequency largely varies.5
Figure J7: 2014 Model vs. Hoodsport buoy data for DO, temperature, and salinity at surface and bottom layers.Model results are captured at a 1 hour frequency while ORCA data collection frequency largely varies.Figure J8: 2014 Model vs. Dabob Bay buoy data for DO, temperature, and salinity at surface and bottom layers.Model results are captured at a 1 hour frequency while ORCA data collection frequency largely varies.6
Figure J9: 2014 Model vs. Twanoh buoy data for DO, temperature, and salinity at surface and bottom layers. Modelresults are captured at a 1 hour frequency while ORCA data collection frequency largely varies.Figure J10: 2014 Model vs. Point Wells buoy data for DO, temperature, and salinity at surface and bottom layers.Model results are captured at a 1 hour frequency while ORCA data collection frequency largely varies.7
A qualitative assessment of ORCA buoy and SSM output revealed an impressive amountof congruence in patterns and overall magnitudes between modeled and observed data. With theexception of Point Wells, temperature data, in particular, was very well represented by the modelat both surface and bottom layers for all stations and years. Model predictions at Point Wellsdisplayed an approximately 2 degree Celsius deviation from observations from August toNovember in Layer 4, which was the deepest layer with available data (Figure J10). Althoughtemperature predictions were relatively close to observations during all years, SSM showed anapparent more pronounced tendency to under-predict surface layer temperature during summermonths in 2014 when compared to previous years. Surface layer temperature, salinity, and DOmodel predictions have slightly greater deviation from observed data in the fall of 2014 atHoodsport and Twanoh (Figures J3, J4, J7 and Figures J2, J5, J9). This deviation may, in part, bedue to missing Department of Fisheries and Oceans Canada (DFO) data at the model openboundary used to force the model. Fourth quarter DFO data for temperature and salinity weremissing in 2014 and were interpolated using 2014 3rd quarter data and 2015 1st quarter data.In general, the model tended to capture variations in observed data for bottom layers well.As shown in Figures (J2-J9), the model had a near perfect fit with all parameters in the bottomlayers.DO variability at the surface is higher, and corresponding deviation between modelpredictions and observations is larger than for other parameters. This finding is not unexpected,as DO measurements in surface layers are highly variable in response to localized biological andphysical drivers. DO model predictions at Carr Inlet at the surface followed the same patterns asthe buoy data, with the model staying close to observed averages, but not following theobservations’ peaks and minimums. At Point Wells not enough buoy data is available to evaluatethe annual cycle. The model under-predicted both bottom and surface temperatures for theperiods for which buoy data are available at Point Wells. In terms of DO, the model overpredicted the minimum recorded at the near bottom layer at Point Wells. Overall, the model iscapturing larger scale DO fluctuations reasonably well (Figures J2-J9), while not resolvingfluctuations at the very fine temporal scale of the observations. It should be noted that the modelpredicts an average DO concentration for an entire grid area. Finer resolution events such as thepresence of floating algal masses during surface readings for example, would lead to spikes inDO concentrations not represented in the model nor reflected in an area-averaged DOconcentration.In terms of salinity, as shown in Figures (J3, J4, J7) for Hoodsport and Figures (J2, J5,J9) for Twanoh, the model shows excellent visual fit with observed data for 2006 and 2008 bothat the surface and the bottom layers, with some more deviation in 2014. Unlike DO, salinitymodel patterns appeared to be more influenced by year than by location. Generally, surfacelayer salinity in 2014 showed similar patterns to observations with a tendency for apparentunder-prediction during specific time periods.8
MooringsModel predictions close to, but not co-located with, mooring station observations, werequalitatively compared with each other. Mooring observations for the period of interest wereonly available at Quartermaster Harbor /Tacoma Yacht Club (QMH) and Seattle Aquarium, bothof which are maintained by King County (http://green2.kingcounty.gov/marine-buoy/). Sondeswere deployed at depths of approximately 1 and 10 meters for Seattle Aquarium, andapproximately 1 meter for the Quartermaster Harbor/ Tacoma Yacht Club. These depths varywith tidal fluctuation. Water quality observations in 2008 and 2014 for both moorings werecompared with SSM model outputs. Parameters compared includes: chlorophyll a (Chl a),temperature, salinity, and dissolved oxygen (DO).Data LimitationsData from both of the moorings were considered to be preliminary as a complete QA/QC processfor the data has not yet been undertaken. The data comes with the following disclaimer:“Marine Mooring data provided by King County are preliminary and have notreceived final approval. Most data are relayed by satellite or other telemetry and mayhave received little or no review. Inaccuracies in the data may be present because ofinstrument malfunctions or physical changes at the measurement site. Subsequentreview may result in significant revisions to the data”.As a result of the preliminary status of the data, no error statistics were computed to determinemodel performance. Instead, model output was compared qualitatively with the data.Qualitative comparison refers to assessing congruence of patterns and trends between model andobservations.Model LimitationsBoth moorings were located just outside the edge of model grid shoreline, so model grid cellswere not available at the exact locations of the Quartermaster Harbor/Tacoma Yacht Club orSeattle Aquarium moorings. To address this, both stations were compared to the nearest modelgrid (Figure J11).SSM model grid cells are too coarse to accurately portray steep changes in bathymetryparticularly in very shallow subtidal and intertidal regions of the nearshore. Model bathymetrynear both the Quartermaster Harbor Yacht Club and Seattle Aquarium moorings is considerablydeeper relative to actual bathymetry (Table J2). This tends to skew observations towards beingmatched with model predictions closer to surface layers, rather than being dispersed throughoutseveral deeper layers.1.Table J2: Actual and model bathymetry for mooring stationsStationActual Bathymetry1Nearest Model Node BathymetryQMH3.8 m16 mSeattle Aquarium12 m66 mBathymetry from 10m resolution NOAA DEM files: 9
Figure J11: Map of mooring stations and nearest model grid nodes to be assigned. Seattle Aquarium andQuartermaster Harbor Yacht Club were 486 and 1135 feet away respectively, from the nearest model node10
Results and DiscussionTemperature and salinity predictions and observations are shown in Figure J12 for 2008. Themodel phase and amplitude for temperature, in particular, displayed a high level of congruencewith observed data at both stations. Model predictions for salinity captured the cyclical phase,with apparent under-prediction at both stations. At the Seattle Aquarium station, observed andpredicted salinity both exhibited an upward trend during late spring and summer, with a degreeof fluctuations during the fall, likely due to dilution from high precipitation events.Model predictions and observations in 2014 are shown in Figure J13. Similar patterns to 2008 atthe Seattle Aquarium were found in 2014. Unfortunately, data collection at QMH for 2014 beganin late May, so a review of the annual cycle is not possible. Despite inconsistent data availabilityin 2014 at the QMH station, the model appears to: Underpredict temperature to a greater extent in 2014 from June to September (Figure J12and Figure J13).Display a similar offset from observations for salinity between 2008 and 2014 (FigureJ12 and Figure J13).Figure J12: 2008 Model vs. mooring data for temperature and salinity. Model results are captured at a 1 hourfrequency while mooring data are collected in 15 minute intervals. Data gaps are present for both temperature andsalinity observations for the Quartermaster Harbor Yacht Club station.11
Figure J13: 2014 Model vs. mooring data for temperature and salinity. Model results are captured at a 1 hourfrequency while mooring data are collected in 15 minute intervals. Despite continuous logging, data gaps are presentfor both temperature and salinity for the Quartermaster Harbor Yacht Club station.Model predictions for chlorophyll, as shown in Figures J14 and J15, poorly reflectedobservations from both mooring stations in 2008 and 2014. The model reasonably captured thetime period for the start and end of the algal bloom season. However, observations at bothstations were nearly an order of magnitude greater than predictions during discrete peak events.It is important to note that the model does not use chlorophyll as a state variable, but rather it iscomputed at a fixed chlorophyll to carbon ratio from the algal group variables. While the modelis expected to adequately predict means, it is unlikely to be able to predict peak chlorophyllevents at specific locations.Model predictions near the Seattle Aquarium mooring station show generally higher DO thanobservations in 2008 and 2014. The QMH station exhibited spikes during periods of highchlorophyll, and thus high photosynthetic activity, and low DO during die off periods fromNovember to January (Figure J14 and J15). Model predictions for DO near the Seattle Aquariumwere much less variable. Both model and observed values for DO were relatively high (10 mg/L)prior to the spring algal bloom season (Figure J14 and J15).12
Figure J14: 2008 Model vs. mooring data for DO and chlorophyll. Model results are captured at a 1 hour frequencywhile mooring data are collected in 15 minute intervals. Data gaps are present for both DO and chlorophyll for theQuartermaster Harbor Yacht Club station.13
Figure J15: 2014 Model vs. mooring data for DO and chlorophyll. Model results are captured at a 1 hour frequencywhile mooring data are collected in 15 minute intervals. Data gaps are present for DO and chlorophyll at bothstations.14
the buoy data, with the model staying close to observed averages, but not following the observations' peaks and minimums. At Point Wells not enough buoy data is available to evaluate the annual cycle. The model under-predicted both bottom and surface temperatures for the periods for which buoy data are available at Point Wells.