Transcription
WHITE PAPERData Management for Analytics:TitleFive Best Practices
iiContentsData Management: Why It’s So Essential. 1The Basics of Data Preparation. 11: Simplify Access to Traditional and Emerging Data. 22: Strengthen the Data Scientist’s Arsenal With AdvancedAnalytic Techniques. 33: Scrub Data to Build Quality Into Existing Processes. 44: Shape Data Using Flexible Manipulation Techniques. 45: Share Metadata Across Data Management and Analytics Domains. 6Trusted Data, Proven Analytics. 7
1Data Management: Why It’s So EssentialWe all know that good, clean water is core to life. Without it, we can only survive foraround three days. So what happens if your water source is polluted? Well, unless youfilter the water sufficiently, there will definitely be some negative consequences. To getbetter results, you could enrich the water with fluoride, filter out the arsenic, and deliverit at the right pressure and temperature.In a similar way, “unpolluted” data is core to a successful business particularly onethat relies on analytics to survive. But preparing data for analytics brings with it differentrequirements than storing data in a warehouse. How difficult is it to manage unfiltereddata and get it ready for analytics?Most data scientists spend 50 to 80 percent of their model development time on datapreparation. That cuts sharply into the time they could have spent generating insights.For data scientists and business analysts who prepare data for analytics, datamanagement technology from SAS acts like a data filter – providing a single platformthat lets them access, cleanse, transform and structure data for any analytic purpose. Asit removes the drudgery of routine data preparation, it reveals sparkling clean data andadds value along the way. And that can lead to higher productivity, better decisions andgreater agility.SAS adheres to five data management best practices that support advanced analyticsand deeper insights: Simplify access to traditional and emerging data. Strengthen the data scientist’s arsenal with advanced analytic techniques. Scrub data to build quality into existing processes. Shape data using flexible manipulation techniques. Share metadata across data management and analytics domains.The Basics of Data PreparationData scientists and business analysts often know ahead of time what data they wantto profile or visualize prior to preparing and modeling it. But what they don’t know iswhich variables are best suited with the highest predictive value for the type ofmodel being implemented and the variable being modeled. Identifying and accessingthe right data are crucial first steps. Because the intensely iterative data preparationprocess is what separates a good model from an exceptional one.The process starts when a business problem is identified. Let’s take customer churn asan example. The first step is to gather data that represents what you want to model (thechurned customers) along with all other data related to those churned customers. Thegoal is to increase the explanatory value of the churn model so you can predict whichcustomers might churn in the future. You can do this by analyzing the predictive valueof individual data elements and/or combinations of data elements.Data management foranalytics is not the samething as data management for an enterprisedata warehouse. Analytical data managementadds value along theway by completingsummarizations andadding metadata tovariables before puttingthem into memory.
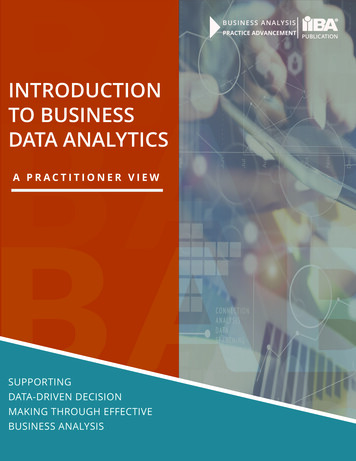
2Once you know that a data element does not have any effect on the behavior, you dropit then you start to analyze different data elements or combinations of data elements.The process repeats until you reach a certain confidence level in terms of how well themodel explains the behavior. Only then can the model accurately predict who willchurn next, and when.But before you can build an effective model, you’ll need consistent, reliable data that’sready for analytics. That’s where our five data management for analytics best practicescan help.Data Management for Analytics: Five Best PracticesSimplifyStrengthenScrubShapeRaw DataShareAnalyticsReady DataFigure 1: In preparing data for analytics, SAS recommends five data managementbest practices that transform raw data into analytics-ready data.1: Simplify Access to Traditionaland Emerging DataBusiness analysts and data scientists want as much data as they can get their hands on,whether it’s from emerging big data sources such as data lakes, S3, Spark, SAS datasets or their own Oracle or Teradata warehouses. The data preparation process involvesdetermining what data can best predict an outcome. And because more data generallymeans better predictors, bigger really is better in this case.But accessing all that data is challenging. One reason is that different data sources,formats and structures make it hard to bring the data together. And statistical analysisessentially only cares about two data types character and numeric. Yet some datasources, like relational databases, have 10 to 20 different numeric data types.SAS has a plethora of native data access capabilities that make working with a widevariety of data sources easy. Here’s why: SAS simplifies access to multiple data sources. From an Excel spreadsheet to arelational database table to data lakes, SAS removes the complexity of reconcilingdata types by automatically converting them. SAS minimizes data movement and improves governance and drastically boostsperformance by pushing data processing down to the data source via SQL passthrough and the SAS Embedded Process a portable, lightweight SAS executionengine that runs anywhere: in-memory, in data lakes, on Oracle or with otherdatabase technologies. SAS provides self-service data preparation capabilities with intuitive user interfacesthat make data accessible to more users, with less training. This, in turn, frees ITpersonnel from iterative data provisioning tasks so they can be more productive.
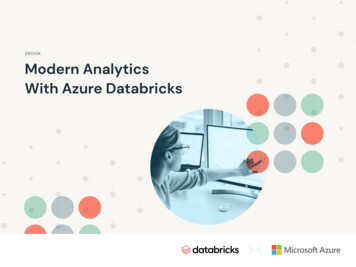
3 SAS enables agile, secure techniques for managing data. For example, SAS usesdata virtualization to quickly create virtual business views of data without moving it.And it can enforce security policies through dynamic data masking so sensitive datais not compromised.2: Strengthen the Data Scientist’s ArsenalWith Advanced Analytic TechniquesWith advanced analytic techniques from SAS, you can make better decisions from yourdata. That’s because traditional ETL and data integration technologies do not have themore sophisticated statistical analysis capabilities that SAS provides inside of the ETLflow. Here are some examples: Frequency analysis goes beyond simple counts to help identify outliers and missingvalues that can skew other measures like mean, average and median (measure ofcentral tendency), as well as effects analyses like forecasting. Frequency analysis isalso used to determine percentiles and binning limits for creating data segmentsthat require different treatment during the modeling and forecasting phases. Summary statistics describes the data by providing several measures, includingcentral tendency, variability, percentiles and cardinality. Cardinality shows howmany unique values exist for a given variable. Business analysts use this techniqueto understand the distribution and variance of the data because data may not benormally distributed, as many statistical methods assume. Correlation is used during the analytic model building process, when businessanalysts try to understand the data to determine which variables or combinationof variables will be most useful based on predictive capability strength. Businessanalysts have to understand which variables potentially influence one another, andto what degree (as in Figure 1). They need to understand all of this for standalonevariables, as well as for variables in combination with others.Figure 2: A correlation heatmap shows measures ofassociation – that is, the degreeof the relationship – between variables.
43: Scrub Data to Build QualityInto Existing ProcessesDid you know that up to 40 percent of all strategic processes fail because of poor data?An analyst-recognized leader in data quality, SAS recognizes the importance of havingdata you can trust.Data cleansing begins with understanding the data through profiling, correcting datavalues (like typos and misspellings), adding missing data values (like ZIP code), findingand dealing with duplicate data or customer records, and standardizing data formats(dates, monetary values, units of measure). Cleaning data can also include automatedselection of best records and cleaning data in multiple languages.SAS has an industry-leading data quality platform that: Incorporates the cleansing capability into your data integration flow to make ITresources more productive. Puts data quality in database that is, pushes this processing down to the databaseto improve performance. Removes invalid data from the data set based on the analytic method you’re using such as outliers, missing data, redundant data or irrelevant data. Enriches data via a process called binning – which simply means grouping togetherdata that was originally in smaller intervals. For example, the individual value of agealone may not have much relevance, but age groups could, such as “between 35and 45.” Or “high cholesterol” could be used to group (bin) cholesterol values thatare greater than 190. Binning is also a way to reduce cardinality, because it createsrelevant data where there was none before.4: Shape Data Using Flexible ManipulationTechniquesWithout flexible methods of manipulating data, it can be difficult to structure the finaldata set. Here’s why: Typical analytic methods expect a “flattened” data set, often called“one-row-per-subject.” A flattened data set is a single table that contains all the datafrom all the sources, organized so that each record holds all the relevant data for thesubject being analyzed.Getting data into a flattened data format can be problematic. If you’re trying to predictwhen your customers may churn, for example, the customer data you use has to becollected from multiple sources (data warehouses, data lakes, transactional and thirdparty data sources). Then it has to be organized into a single row for each customer.The resulting data set can become very wide, with potentially thousands of columns.
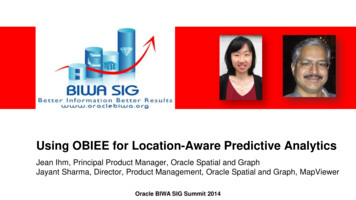
5CustomersProductsSource DataStoresChannelTypeSalesTerritories PurchaseTransactions3rd rmation De-NormalizationCustomer DataProduct DataStoreNew Derived ColumnsCustomer Average DistanceSpendTimeto( last 6Between NearestChannel Promotion Territory months) Purchases StoreAdditionalDerivedColumnsAnalytical Base TableFigure 3: Preparing data for analytics requires merging, transforming, denormalizingand sometimes aggregating yoursource data from multiple tables into one verywide table, often called an analytical base table (ABT), with potentiallythousandsof columns.Database systems are not designed with a single-row-per-customer data structure inmind. As a result, many database systems limit the number of columns a single tablecan have. Transaction systems record every transaction as it happens, resulting in ahigh volume of records for each customer. These transaction records need to beconsolidated and transposed to be joined with the customer records pulled fromthe data warehouse.Such data transposition is an example of what can be an arduous data manipulationtask. If done programmatically, it can involve hundreds of lines of code. That’s becausetransaction data needs to be sorted, groups of transactions for a particular customerneed to be identified, and transactions need to be summarized, perhaps per product.The resulting “new” data structure needs to be part of the one-row-per-subject tablethat will be used for analysis.SAS simplifies data transposition with intuitive, graphical interfaces for transformations.Plus, you can use other reshaping transformations. Those include frequency analysis toreduce the number of categories of variables; appending data; partitioning andcombining data; and a variety of summarization techniques.Data preparation is thekey to asuccessful analyticmodel. One companySAS worked with did notreuse metadata or datatransformation logic fromits analytical modeldevelopment area whenit deployed the modelinto operational systems.Because of this, thecompany spent 1 millionand engaged numerous ITpersonnel for six months just to recode, retestand deploy the model.
65: Share Metadata Across Data Managementand Analytics DomainsSAS has a common metadata layer that allows data preparation processes to beconsistently repeated. This promotes more efficient collaboration between thosewho initially prepare data and the business analysts and data scientists who ultimatelycomplete the data preparation process and analytic model development.Common metadata also provides lineage information on the data preparation process,so you can answer questions like: Where did the data come from? What was its quality?What data was used, and where else has it been used? How was the data transformed?What additional reports or information products are developed using this data?Because of a common metadata layer between the data preparation and modeldevelopment environments, SAS makes it easier to deploy models. As each modelis registered in metadata and made available along with its data requirements, itbecomes less of a challenge to adopt.Applying metadata across the analytics life cycle delivers savings on multiple levels.When a common metadata layer serves as the foundation for the model developmentprocess, it eases the intensely iterative nature of data preparation, the burden of themodel creation process and the challenge of deployment. Advantages include: Faster testing and increased productivity due to automated model developmentand scoring. Creation of more models with greater accuracy because of automated modelmanagement. Faster cycle times that increase profitability and result in more relevant andtimely models. Less time spent on mundane data work, and more focus on model developmentand evaluation. Knowledge that can be reused across the enterprise after it’s obtained duringthe data preparation process. Increased flexibility to accommodate changes because of better manageabilityand governance over the analytics life cycle. Auditable, transparent data that meets regulatory requirements you can tracedata from start to finish.
7Trusted Data, Proven AnalyticsFollowing these data management best practices from SAS can position yourorganization to get the full value from advanced analytics. Our industry-leadingapproach gives you access to all types of raw data and lets you cleanse, transformand shape it for any analytic purpose. As you glean continually deeper insights fromyour data, you can embed that knowledge into your analytical models, share yournew discoveries and automate decision-making processes across the business.Find out more about how SAS, an analyst-recognized leader in data quality, dataintegration and advanced analytics, supports data management best practices andhelps your business build competitive advantage: sas.com/data.
To contact your local SAS office, please visit: sas.com/officesSAS and all other SAS Institute Inc. product or service names are registered trademarks or trademarks of SAS Institute Inc.in the USA and other countries. indicates USA registration. Other brand and product names are trademarks of theirrespective companies. Copyright 2019, SAS Institute Inc. All rights reserved. 107769 G116254.1019
Database systems are not designed with a single-row-per-customer data structure in mind. As a result, many database systems limit the number of columns a single table can have. Transaction systems record every transaction as it happens, resulting in a high volume of records for each customer. These transaction records need to be