Transcription
TECHNICAL PAPER2021 Heatmaps – Sustainability of memberoutcomesMARCH 2022
Disclaimer TextWhile APRA endeavours to ensure the quality of this publication, it does not accept anyresponsibility for the accuracy, completeness or currency of the material included in thispublication and will not be liable for any loss or damage arising out of any use of, orreliance on, this publication. Australian Prudential Regulation Authority (APRA)This work is licensed under the Creative Commons Attribution 3.0 Australia Licence(CCBY 3.0). This licence allows you to copy, distribute and adapt this work, provided youattribute the work and do not suggest that APRA endorses you or your work. To view a fullcopy of the terms of this licence, visit TRALIAN PRUDENTIAL REGULATION AUTHORITY2
ContentsIntroduction4Chapter 1 - Heatmap coverage7Chapter 2 - Sustainability of member outcomes92.1Sustainability metrics92.1.1Total account growth rate102.1.2Net cash flow ratio112.1.3Net rollover ratio122.1.4Summary of sustainability metrics122.2Operating expenses142.3Mergers and simplification programs15AppendixAUSTRALIAN PRUDENTIAL REGULATION AUTHORITY183
IntroductionAs the Superannuation industry continues to grow Australians should rightly expect theirsuperannuation fund to be acting in their best financial interests continually striving toimprove the outcomes they receive.APRA publishes heatmaps on an annual basis to improve transparency and to driveaccountability for doing just that. Heatmaps provide clear and comparable information onproduct performance across multiple dimensions: investment returns, fees and costs andsustainability of member outcomes.In December 2021 APRA published the third annual MySuper Heatmap and the first iterationof the Choice Heatmap (collectively the Heatmaps), together with accompanying Insight andTechnical Papers. The insights published in December 2021 focused on investment returnsand fees and costs. Insights Paper – MySuper and Choice Heatmaps contained APRA’s keyfindings from the Heatmaps and more detailed information can be found in Technical Paper –MySuper Heatmap and Technical Paper – Choice Heatmap.In this paper APRA focuses on sustainability of member outcomes. For the purposes of theseinsights, a reference to the sustainability of member outcomes means an RSE licensee’sability to: deliver strong financial outcomes for its members now and in the future; and address areas requiring improvement.Sustainability of member outcomes metricsAPRA measures sustainability of member outcomes in the Heatmaps using the followingmetrics calculated at the RSE (or fund) level: Total Accounts Growth Rate (3-year average), which is an RSE’s rate of growth inmember accounts relative to total member accounts; Net Cash Flow Ratio (3-year average), which is an RSE’s rate of growth in net cashflows relative to net assets. Net cash flows include member benefit flows such asmember contributions and benefit payments, but excludes cash flows frominvestments; and Net Rollover Ratio (3-year average), an RSE’s rate of growth in net rollovers relative tonet assets.APRA considers that these three metrics together indicate an RSE’s growth outlook, withreference to whether the membership or asset base of an RSE is trending positively ornegatively. An RSE that is declining, particularly when it is already relatively small, will facechallenges both in keeping fees and costs low for members, and funding operationalimprovements that benefit members.AUSTRALIAN PRUDENTIAL REGULATION AUTHORITY4
Key pointsSustainability is a key indicator of the future ability of a superannuation fund to keepdelivering strong financial outcomes to members.Key findings in relation to sustainability are as follows: Scale is an important driver of outcomes for members now and in the future.oLarge RSEs (net assets greater than 50 billion) are able to leverage thebenefits of scale by spreading the cost of their operations over a largermembership base, thus improving operational efficiency and memberoutcomes (by way of lower fees).oThe administration and operating expenses (as a % of net assets) for largeRSEs are significantly less than that of small RSEs (net assets less than 10billion), 0.33% compared to 0.57%, respectively.Half of small RSEs face immediate sustainability challenges due to declining net cashflows and member accounts.o More than half of medium-sized RSEs have adverse trends in sustainability.o The MySuper and Choice Heatmaps identify 24 small RSEs that are declining.Such RSEs will likely face challenges in addressing areas ofunderperformance, such as high fees and poor investment returns, andfunding operational improvements that ultimately benefit members.11 medium-sized RSEs (with 10 to 50 billion net assets) are declining in netcash flows and member accounts. APRA considers that these RSEs will find itchallenging to compete for membership growth in the medium term withlarger RSEs as the large RSEs become even bigger and further leverage thebenefits of scale.The majority of mergers and simplification programs lead to immediate fee savings formembers. However further benefits of mergers, including improved operatingefficiency, will be realised over time particularly where full integration is not achievedon day one.oMergers since the release of the first MySuper Heatmap in 2019 have delivereda combined total fee savings of around 21 million per annum to approximately350,000 MySuper member accounts (or 60 per account).oSimplification programs, including product consolidations, have delivered feesavings to approximately 780,000 member accounts, with estimated totalsavings of almost 16 million per annum (or 20 per account).AUSTRALIAN PRUDENTIAL REGULATION AUTHORITY5
Sustainability of member outcomes – Business Performance ReviewAPRA expects RSE licensees to assess sustainability of member outcomes as part of theannual Business Performance Review.In the Business Performance Review an RSE licensee is required to assess whether itexpects to continue to deliver the financial outcomes it seeks for its members. To achievethis an RSE licensee must set strategic objectives in its Business Plan to deliver financialoutcomes and ensure the prudent management and resilience of its business operations.APRA expects that the financial projections in the Business Plan together with the RSElicensee’s assessment of current and future scale are key components of its analysis ofthe delivery of financial outcomes for members.APRA expects that an RSE licensee of an RSE with limited prospects of addressingsustainability concerns must consider its strategic options, such as whether its membersare likely to be better served in another RSE. This includes developing well-maintainedcontingency plans with clear triggers for when these plans will be enacted.An RSE licensee acting in the best financial interests of members is expected tocontinuously strive to improve the outcomes delivered to members. This may includemerging with another RSE where the result is an overall improvement in scale metricsand operating efficiency. Not only will members typically receive the benefit of lower fees,but larger RSEs with economies of scale often provide better long-term retirementoutcomes.AUSTRALIAN PRUDENTIAL REGULATION AUTHORITY6
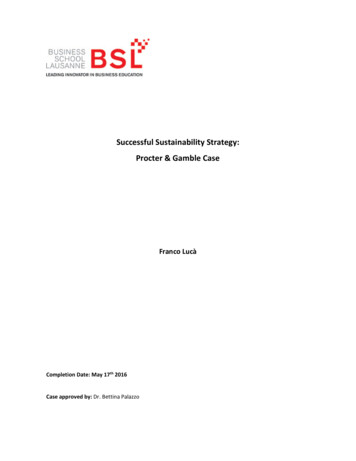
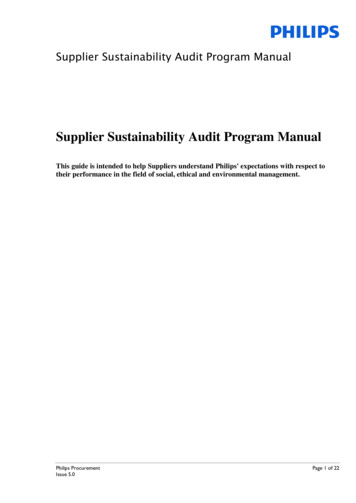
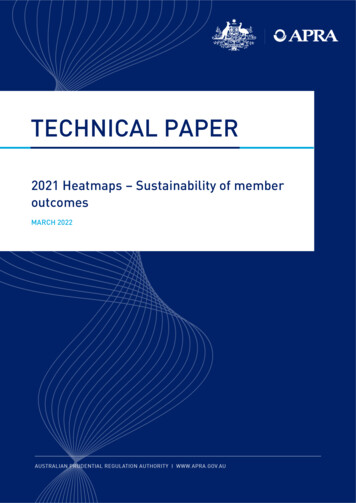
Chapter 1 - Heatmap coverageAPRA’s MySuper and Choice Heatmaps cover 78 RSEs of the overall population of 140 APRAregulated RSEs with more than four members (refer to Figure 1).1Figure 1.Sustainability of member outcomes is assessed at the RSE level(* MySuper options are single strategy MySuper products and lifecycle stages of lifecycle MySuper products.)61 of these RSEs offer a MySuper product and one or more choice products; the remaining 17offer choice products only (refer to Table 1). This sample includes each RSE with a productreflected in either the MySuper Heatmap or the Choice Heatmap. Combined, the RSEs in thesample represent aggregate assets in excess of 1.7 trillion, or 81% of all APRA-regulatedassets. The 17 RSEs with only choice products are generally smaller than RSEs that offerMySuper and/or choice products, with the majority having 2 billion or less in net assets.212The population and total net assets of APRA-regulated RSEs with more than four members are sourced fromAPRA’s Annual Fund-level Superannuation Statistics as at 30 June 2021.The sustainability metrics are calculated at the overall RSE level. This means that net assets, member accountsand RSE flows will reflect all products and investment options held by a RSE, including some options notcovered in either the MySuper or Choice Heatmap.AUSTRALIAN PRUDENTIAL REGULATION AUTHORITY7
Number of RSEs (by asset cohort) in the superannuation industry, andthe sample covered by the HeatmapsRSE net assets 10bn 10bn 50bn 50bnTotalTotal APRA-regulated RSEs1002317140Of which: RSEs in the Heatmaps47181378Of which: in the MySuper Heatmap31171361Of which: in the Choice Heatmaponly161017RSEs not covered in the Heatmaps include defined benefit-only funds, insurance-only funds,eligible rollover funds, multi-member approved deposit funds, RSEs offering only platformproducts and RSEs where SuperRatings do not have coverage over (for example certain nonpublic offer, corporate funds).AUSTRALIAN PRUDENTIAL REGULATION AUTHORITY8
Chapter 2 - Sustainability of memberoutcomesScale is an important driver of outcomes for members now and in thefuture.In promoting the best financial interests of members, RSE licensees must ensure sufficientscale in their business operations to deliver quality outcomes for members. While scale,which is typically measured by the total net assets or member accounts of RSE(s) under anRSE licensee, does not guarantee good outcomes, RSEs with greater scale typically have acompetitive edge by being able to leverage the benefits of it. Such benefits include:3 increased ability to negotiate scale discounts with service providers; access to a wider range of investment markets, such as unlisted assets; and the ability to spread the cost of their operations over a larger membership base.APRA considers that the sustainability metrics together indicate an RSE’s growth outlookwith reference to whether the membership or asset base of an RSE is trending positively ornegatively. An RSE that is declining, particularly when it is already relatively small, will facechallenges both in keeping fees and costs for members low, and funding operationalimprovements that benefit members.2.1Sustainability metricsLarge RSEs, in particular, are growing and are generally well-positionedto further leverage the benefits of scale.APRA has analysed the sustainability metrics of RSEs across different net assets cohorts(small RSE or less than 10 billion; medium-sized RSE or 10 to 50 billion; and large RSEor greater than 50 billion), as shown in Figures 2, 3 and 4.43APRA Executive Board Member, Margaret Cole - speech to the Financial Services Council webinar APRA4Refer to the Appendix for further information on interpreting box and whisker charts.AUSTRALIAN PRUDENTIAL REGULATION AUTHORITY9
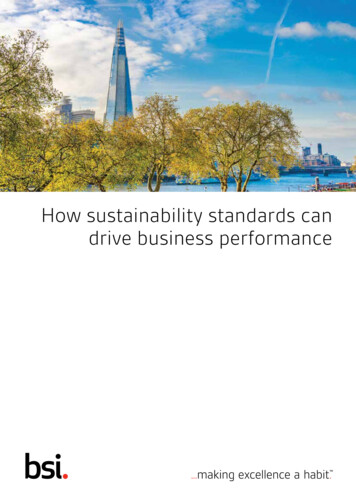
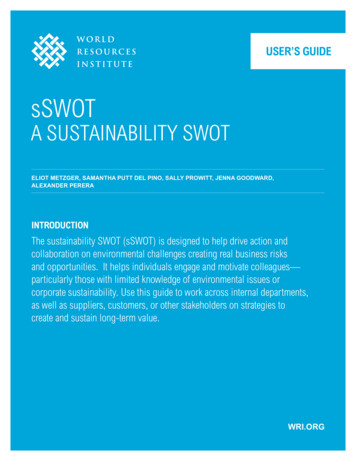
2.1.1Total account growth rateFigure 2.3-year average total account growth by RSE size (as at 30 June 2021)5Figure 2 illustrates that: All cohorts have a negative median account growth rate, which indicates that, for themajority of RSEs, the number of member accounts have reduced over the last threeyears. This reflects the recent trend in account consolidation, following legislativemeasures such as the Protecting Your Superannuation Package (movement of lowbalance, inactive accounts to the Australian Taxation Office) and the COVID-19 EarlyRelease Scheme in 2020. Small RSEs show a wide range in growth – from the most adverse reduction in memberaccounts to the fastest increase. Seven small RSEs exhibited strong growth in memberaccounts of more than 10%. The significant majority of medium-sized RSEs have lost member accounts (only 1 RSEhad total accounts growth rate above 0%).5Figure 2 does not display the following four RSEs in the small cohort due to large total account growth rates:Grosvenor Pirie Master Superannuation Fund Series 2 (66.87%), Tidswell Master Superannuation Plan (49.79%),Future Super Fund (49.68%), and Australian Defence Force Superannuation Scheme (35.82%).AUSTRALIAN PRUDENTIAL REGULATION AUTHORITY10
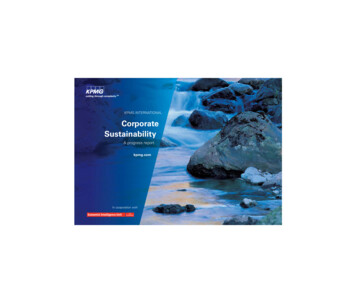
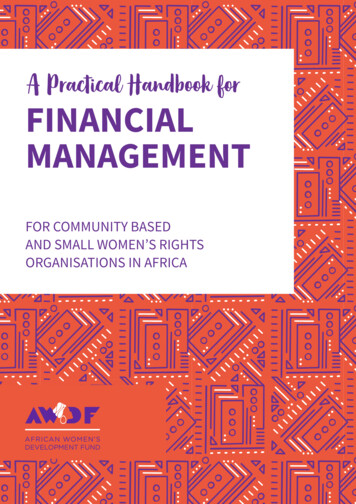
2.1.2Net cash flow ratioFigure 3.3-year average net cash flow ratio by RSE size (as at 30 June 2021)6Figure 3 illustrates that: Large RSEs are generally growing, as indicated by the median net cash flow ratio of3.01%. RSE licensees of these RSEs manage combined assets of 1.3 trillion, or 72% oftotal net assets of the sample covered in the Heatmaps. APRA views that these RSEs aregenerally well-positioned to realise further scale benefits and pass them on to members. Small RSEs have a wide range of growth in net cash flows: 6oSome small RSEs experience the most adverse trends – as illustrated by the net cashflow ratio at the 25th percentile level being the lowest across all cohorts.oHowever, six small RSEs demonstrated strong growth in net cash flows of more than10%. These RSEs generally provided new or niche product offerings, such asenvironmental, social, governance (ESG) focused products.Medium-sized RSEs generally displayed negative trends, with only six RSEs havingpositive net cash flow ratios.Figure 3 does not display the following four RSEs in the small cohort due to large net cash flow ratios :Australian Defence Force Superannuation Scheme (55.36%), DIY Master Plan (46.75%), Future Super Fund(36.10%) and Grosvenor Pirie Master Superannuation Fund Series 2 (25.21%).AUSTRALIAN PRUDENTIAL REGULATION AUTHORITY11
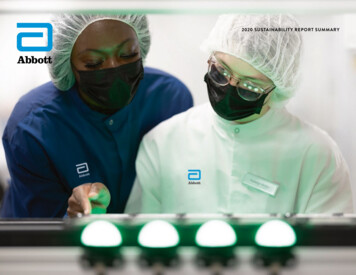
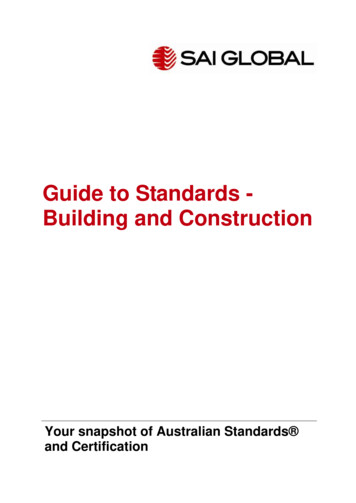
2.1.3Net rollover ratioFigure 4.3-year net rollover ratio by RSE size (as at 30 June 2021)7Figure 4 illustrates that: More than half the large RSEs are experiencing net asset growth due to members rollingtheir benefits in, indicated by a positive median net rollover ratio of 0.25%. Assets in small and medium-sized RSEs are declining due to members rolling theirbenefits out of the RSE, indicated by a negative median net rollover ratio.o2.1.4Rollovers for five small RSEs, however, exceeded 10%.Summary of sustainability metricsHalf of small RSEs face immediate sustainability challenges, and morethan half of medium-sized RSEs have adverse trends in sustainability.Table 2 outlines the distribution of RSEs in the sample with reference to the combined resultsacross all three sustainability metrics (total accounts growth rate, net cashflow ratio and net7Figure 4 does not display the following two RSEs in the small cohort due to large net rollover ratios: DIY MasterPlan (44.70%) and Future Super Fund (28.60%).AUSTRALIAN PRUDENTIAL REGULATION AUTHORITY12
rollover ratio), specifically whether RSEs are growing or declining on all, or some, of themetrics.Sustainability metrics by RSE sizeNet assets 10bn 10bn -50bn 50bnTotal81413No. of RSEs growing on 2 metricsand declining on 1 metric91313No.of RSEs growing on 1 metric anddeclining on 2 metrics65314No. of RSEs declining on all metrics2411338Total47181378No. of RSEs growing on all metrics89Table 2 illustrates that, of the 78 RSEs in the analysis: 13 (or 17% of RSEs) are growing across all sustainability metrics, suggesting a positivegrowth outlook. Of these 13 RSEs, eight are small and four are large. 38 (or 49% of RSEs) are declining across all three sustainability metrics, indicating thatthese RSEs are losing member accounts, and paying out more cash in benefit paymentsand outward rollovers. Of these 38 RSEs, 35 are small or medium-sized.In summary, the Heatmaps show that: 24 small RSEs (or 51%) generally have the most adverse sustainability metrics (refer toTable 4 in the Appendix). These RSEs manage a total of 84.7 billion in net assets (5% oftotal net assets of RSEs in the Heatmaps) and 1.1 million member accounts (6% of totalmember accounts in RSEs in the Heatmaps).8A reference to ‘growing’ means a sustainability metric value greater than 0%.9A reference to ‘declining’ means a sustainability metric value less than 0%.AUSTRALIAN PRUDENTIAL REGULATION AUTHORITY13
11 medium-sized RSEs (or 61% of medium-sized RSEs) are declining across all threesustainability metrics trends.APRA views that these RSEs may find it challenging to compete with larger RSEs, as thelarge RSEs become even bigger and further leverage the benefits of scale.2.2Operating expensesScale delivers lower operating costs and lower fees.RSEs with adverse sustainability metrics will likely find it even more challenging to remaincompetitive and provide sustainable outcomes for members into the future, as revenuedeclines and/or operating expenses rise.An RSE licensee can capitalise on the benefits of scale by spreading the cost of theiroperations over a larger membership base, thus improving operational efficiency andmember outcomes (by way of lower fees). A measure of an RSE’s operating efficiency is itstotal administration and operating expenses as a percentage of net assets (‘AOE ratio’) – ahigher AOE ratio may point to operational inefficiencies.To demonstrate the potential member impact arising from inefficiency in an RSE licensee’soperating model, Figure 5 illustrates the relationship between: RSE size (net assets); the AOE ratio; and the asset-based administration fees of choice products in the Choice Heatmap.Figure 5. Impact of RSE size on AOE ratio on choice product asset-basedadministration fees (as at 30 June 2021)AUSTRALIAN PRUDENTIAL REGULATION AUTHORITY14
RSEs with net assets less than 10 billion tended to operate less efficiently compared toRSEs with net assets greater than 50 billion, as indicated by the median AOE ratio of 0.33%and 0.57%, respectively.Figure 5 illustrates that: RSEs with high AOE ratio (i.e. 75th percentile or higher) and offer choice products withhigh asset-based administration fees are generally small RSEs, as indicated by the sizeof the bubbles in the red-shaded quadrant. This suggests that members may be payinghigher administration fees as a result of the operational inefficiency of the RSE (refer toTable 5 in the Appendix for the RSEs and choice products in the red-shaded quadrant). Larger RSEs tend to have lower AOE ratio and offer choice products with lower assetbased administration fees, as indicated by the larger RSEs circled in the bottom leftquadrant. This may suggest that larger RSEs are able to operate more efficiently due toeconomies of scale.2.3Mergers and simplification programsMajority of mergers and simplification programs lead to fee savings formembers.APRA continues to encourage RSE licensees to improve outcomes to members or considerwhether members are better served in another RSE. APRA welcomes the recent mergeractivity, especially where RSE licensees of smaller RSEs recognise that they lack thenecessary scale and capability to deliver the required change and improvements to ensurestrong outcomes are delivered for members now and into the future. Where mergers are yetto fully integrate, for example products consolidated and/or business processes and systemsstreamlined at a later date, the benefits of the merger, such as improved operating efficiencyor reduced AOE, may not be fully realised in the short term.RSE licensees with multiple RSEs and a wide range of product offerings, often administeredon different systems, can experience operational inefficiencies arising from the complexity oftheir operations. This suggests that such RSE licensees may gain efficiencies by simplifyingtheir product structure or business operations.APRA has analysed the difference in fee outcomes following the closure of 19 MySuperproducts since the first MySuper Heatmap was published in December 2019, which hasAUSTRALIAN PRUDENTIAL REGULATION AUTHORITY15
identified fee reductions for some members. Further details on these activities andassociated changes in fee can be found in Table 6 of the Appendix.10Of these 19 products: 15 closed and merged with another RSE; and Four closed as a result of RSE licensees undertaking simplification programs, includingconsolidating products under their trusteeshipFigure 6 illustrates the estimated change in administration fees after being transferred toanother MySuper product. Note that the predecessor product is shown in the figure below.Figure 6. Estimated change in administration fees after transfer to anotherMySuper productAll but four transfers led to savings in administration fees for members (three increased, andone resulted in no change in administration fees).APRA’s analysis further illustrates: Mergers (blue dots shown in Figure 6) have delivered combined fee savings toapproximately 350,000 member accounts, with estimated total savings of 21 million perannum, split between:o10 13 million in administration fees per annum (or 36 per member account); andSee the Appendix for the methodology for calculating the estimated fee changes following the closure ofMySuper product. Analysis performed by Super Consumers Australia demonstrated similar conclusions on thebenefits of merging.AUSTRALIAN PRUDENTIAL REGULATION AUTHORITY16
o 8 million in investment fees and costs per annum (or 24 per member account).Simplification programs undertaken by four RSE licensees (orange dots shown in Figure6) have delivered fee savings to approximately 780,000 member accounts, with estimatedtotal savings of almost 16 million per annum, split between:oalmost 9 million in administration fees savings per annum (or 12 per memberaccount); andoalmost 7 million in investment fees and costs per annum (or 8 per memberaccount).Mergers where large RSEs are the successor RSE delivered the greatestfee savings, especially in administration fees.APRA has compared the level of fee savings from seven mergers where the successor RSE islarge, and eight mergers where the successor RSE is small or medium-sized (in Table 3below). Table 3 illustrates that MySuper fee savings (both administration fees and total fees)were higher for mergers involving large RSEs, particularly administration fees.Administration fee savings were nearly 2.5 times greater for mergers involving large RSEscompared to other mergers ( 48 per member account for mergers involving large RSEscompared to 20 for other mergers).MySuper member fee savings from recent mergersAdministration fee saved perannum, per member accountTotal fees and costs saved perannum, per member account(% reduction)(% reduction)Successor RSE is large 48 (30% reduction) 78 (15% reduction)Successor RSE is small ormedium-sized 20 (11% reduction) 36 (5% reduction)Merger involvesAUSTRALIAN PRUDENTIAL REGULATION AUTHORITY17
AppendixInterpreting box and whisker chartOutlierMaximum75 percentilethInterquartile rangeMedian25 percentilethMinimumThe box or interquartile range (IQR) is the distance between the 25th and 75th percentile (orlower and upper quartiles).Outliers are data points that fall outside 1.5 times the IQR.The whiskers extend from the box to the maximum and minimum data points of an adjusteddata set that excludes any outliers. The maximum is the largest data point that is less than orequal to 1.5 times the IQR from the 75th percentile, and the minimum is the smallest datapoint that is greater than or equal to 1.5 times the IQR from the 25th percentile.Outliers are included in the calculation of median and percentile values.RSEs with net assets less than 10 billion, where all threesustainability metrics are negativeRSE LicenseeRSERSE net assets(‘000)MemberaccountsAlcoa of Australia RetirementPlan Pty LtdAlcoa of Australia RetirementPlan 2,321,4515,336Australian Meat IndustrySuperannuation Pty LtdAustralian Meat IndustrySuperannuation Trust 2,513,81860,923BUSS (Queensland) Pty LtdBuilding UnionsSuperannuation Scheme(Queensland) 5,782,83968,679AUSTRALIAN PRUDENTIAL REGULATION AUTHORITY18
RSE LicenseeRSERSE net assets(‘000)MemberaccountsBEST Superannuation Pty LtdGoldman Sachs & JBWereSuperannuation Fund 647,7241,767Club Plus SuperannuationPty LtdClub Plus SuperannuationScheme 3,121,13160,407Colonial First StateInvestments LimitedCommonwealth EssentialSuper 3,923,283150,069Diversa Trustees LimitedING Superannuation Fund 3,179,23856,270Diversa Trustees LimitedOneSuper 1,273,64356,270Equity TrusteesSuperannuation LimitedZurich Master SuperannuationFund 996,61811,163First Super Pty LimitedFirst Super 3,521,66746,003L.U.C.R.F. Pty. Ltd.Labour Union Co-OperativeRetirement Fund 7,470,030133,058LCA NOMINEES PTY. LTD.Lutheran Super 679,8515,953Maritime Super Pty LimitedMaritime Super 6,137,49523,858Meat Industry EmployeesSuperannuation Fund Pty.Ltd.Meat Industry EmployeesSuperannuation Fund 944,41816,788Media Super LimitedMedia Super 6,789,36672,401Perpetual SuperannuationLimitedPerpetual WealthFocusSuperannuation Fund 1,725,49611,888Perpetual SuperannuationLimitedPerpetual's SelectSuperannuation Fund 1,253,5675,275AUSTRALIAN PRUDENTIAL REGULATION AUTHORITY19
RSE LicenseeRSERSE net assets(‘000)MemberaccountsPostSuper Pty LtdAustralia Post SuperannuationScheme 8,304,85628,649Qantas SuperannuationLimitedQantas Superannuation Plan 8,532,17227,609Rei Superannuation Fund PtyLimitedRei Super 1,932,91524,618Suncorp Portfolio ServicesLimitedSuncorp Master Trust 6,851,659139,369T W U Nominees Pty LtdTWU Superannuation Fund 6,273,696104,148Towers WatsonSuperannuation Pty LtdIncitec Pivot EmployeesSuperannuation Fund 210,323774Towers WatsonSuperannuation Pty LtdOracle Superannuation Plan 357,8172,161RSE Licensees with high AOE ratio and high choice product assetbased admin fees (75 percentile or higher)thRSE LicenseeRSEChoice productRSE netassets (‘000)Asset-basedadministrationfees (as at 30June 2021)RSE AOEratioBT FundsManagementLimitedASGARDIndependencePlan DivisionTwoAsgardEmployeeSuperannuationAccount 22,915,0261.33%0.83%DiversaTrusteesLimitedFuture SuperFundVerve Super 1,246,4250.78%0.58%DiversaTrusteesLimitedGrosvenor PirieMasterSuperannuationFund Series 2Cruelty FreeSuper 204,8110.94%1.43%AUSTRALIAN PRUDENTIAL REGULATION AUTHORITY20
RSE LicenseeRSEChoice productRSE netassets (‘000)Asset-basedadministrationfees (as at 30June 2021)RSE AOEratioDiversaTrusteesLimitedGrosvenor PirieMasterSuperannuationFund Series 2The GrosvenorPirie MasterSuperannuationFund - Series 2 ghtdayComplete Super row Super Personal esf andMacmahonSuper APSuperannuationPlan ax Super Fund- Personal YONESUPER martsave Employer martsave Personal hole Super 1,273,6430.60%0.57%DiversaTrusteesLimitedTidswell nnuationFund 949,6030.60%0.96%DiversaTrusteesLimitedTidswell MasterSuperannuationPlanmobiSuper 949,6031.31%0.96%AUSTRALIAN PRUDENTIAL REGULATION AUTHORITY21
RSE LicenseeRSEChoice productRSE netassets (‘000)Asset-basedadministrationfees (as at 30June 2021)RSE AOEratioDiversaTrusteesLimitedTidswell MasterSuperannuationPlanTidswellSuperannuationFund - PersonalSuper 949,6031.56%0.96%Equity TrusteesSuperannuationLimitedAMG SuperAMG Super CorporateSuper 1,551,6830.67%0.78%Equity TrusteesSuperannuationLimitedAMG SuperAMG Super Personal 1,551,6830.68%0.78%Equity TrusteesSuperannuationLimitedAON MasterTrustsmartMondayDIRECT 5,599,3410.60%1.02%Equity TrusteesSuperannuationLimitedCrescent WealthSuperannuationFundCrescentWealth Super 312,8470.89%0.94%Equity dDefence BankSuper 86,7430.63%0. nuationFundFiducian Super 1,986,0100.81%0.70%Guild TrusteeServices Pty.LimitedGuildRetirementFundChild CareSuper - MyMix 2,419,9030.88%0.59%Guild TrusteeServices Pty.LimitedGuildRetirementFundGuildSuper MyMix Suncorp MasterTrustSuncorpBrighter Super Business Suncorp MasterTrustSuncorpBrighter Super Personal 6,851,6590.65%0.75%AUSTRALIAN PRUDENTIAL REGULATION AUTHORITY22
Methodology for fees and costs savings analysisIn section 2.3 of this paper, APRA has calculated estimates for administration and total feesand costs per member account for MySuper products. This calculation enables comparisonsbetween the fee structures of a product before and after a merger or simplification has beencompleted.The estimated administration, investment and indirect cost ratio (ICR), and total fees permember account for a MySuper product are: ��𝐸𝐸𝐸𝐸𝐸 𝑎𝑎𝑎 𝑓𝑓𝑓𝑓𝑓𝑓𝑓𝑓 𝑝𝑝𝑝𝑝𝑝𝑝 𝑚𝑚𝑚𝑚𝑚𝑚𝑚𝑚𝑚𝑚𝑚𝑚 ��𝑎 [(𝑁𝑁𝑢𝑢𝑚𝑚𝑚𝑚𝑚𝑚𝑚𝑚 𝑜𝑜𝑜𝑜 𝑚𝑚𝑚𝑚𝑚𝑚𝑚𝑚𝑚𝑚𝑚𝑚 ��𝑎𝑎𝑎 𝑑𝑑𝑑𝑑𝑑𝑑𝑑𝑑𝑑𝑑𝑑𝑑 𝑏𝑏𝑏𝑏𝑏𝑏𝑏𝑏𝑏𝑏 𝑎𝑎𝑎 𝑓𝑓𝑓𝑓𝑓𝑓 ��𝑑𝑑𝑑𝑑𝑑 𝑝𝑝. 𝑎𝑎. ) (𝑡𝑡𝑡𝑡𝑡𝑡𝑡𝑡𝑡𝑡 ��𝑠 ′ ��𝑏𝑏𝑏 𝑎𝑎𝑎𝑎𝑎𝑎𝑎𝑎𝑎𝑎 𝑏𝑏𝑏𝑏𝑏𝑏𝑏𝑏𝑏𝑏 𝑎𝑎𝑎 𝑓𝑓𝑓𝑓𝑓𝑓 𝑝𝑝. 𝑎𝑎. )]/𝑇𝑇𝑇𝑇𝑇𝑇𝑇𝑇𝑇𝑇 𝑀𝑀𝑀𝑀𝑀𝑀𝑀𝑀𝑀𝑀𝑀𝑀 𝐸𝐸𝐸𝐸𝐸𝐸𝐸𝐸𝐸 ��𝑖𝑖𝑖𝑖𝑖𝑖𝑖 𝑓𝑓𝑓𝑓𝑓𝑓𝑓𝑓 𝑎𝑎𝑎𝑎𝑎𝑎 𝐼𝐼𝐼𝐼𝐼𝐼𝐼𝐼 𝑝𝑝𝑝𝑝𝑝𝑝 𝑚𝑚𝑚𝑚𝑚𝑚𝑚𝑚𝑚𝑚𝑚𝑚 ��𝑎 [(𝑇𝑇𝑇𝑇𝑇𝑇𝑇𝑇𝑇𝑇 ��𝑠 ′ ��𝑏𝑏𝑏 ��𝑖𝑖𝑖𝑖𝑖𝑖𝑖 𝑓𝑓𝑓𝑓𝑓𝑓 𝑎𝑎𝑎𝑎𝑎𝑎 𝐼𝐼𝐼𝐼𝐼𝐼 ��𝑑𝑑𝑑𝑑𝑑 𝑝𝑝. 𝑎𝑎. )]/𝑇𝑇𝑜𝑜𝑜𝑜𝑜𝑜𝑜𝑜 𝑀𝑀𝑀𝑀𝑀𝑀𝑀𝑀𝑀𝑀𝑀𝑀 𝐸𝐸𝐸𝐸𝐸𝐸𝐸𝐸𝐸 𝑡𝑡𝑡𝑡𝑡𝑡𝑡𝑡𝑡𝑡 𝑓𝑓𝑓𝑓𝑓𝑓𝑓𝑓 𝑎𝑎𝑎𝑎𝑎𝑎 𝑐𝑐𝑐𝑐𝑐𝑐𝑐𝑐𝑐𝑐 𝑝𝑝𝑝𝑝𝑝𝑝 𝑚𝑚𝑚𝑚𝑚𝑚𝑚𝑚𝑚𝑚𝑚𝑚 ��𝑎 ��𝐸𝐸𝐸𝐸𝐸 𝑎𝑎𝑎 𝑓𝑓𝑓𝑓𝑓𝑓𝑓𝑓 𝑝𝑝𝑝𝑝𝑝𝑝 𝑚𝑚𝑚𝑚𝑚𝑚𝑚𝑚𝑚𝑚𝑚𝑚 ��𝑎 ��𝐸𝐸𝐸𝐸𝐸 ��𝑚𝑒𝑒𝑒𝑒𝑒𝑒 𝑓𝑓𝑓𝑓𝑓𝑓𝑓𝑓 𝑎𝑎𝑎𝑎𝑎𝑎 𝐼𝐼𝐼𝐼𝐼𝐼𝐼𝐼 𝑝𝑝𝑝𝑝𝑝𝑝 𝑚𝑚𝑚𝑚𝑚𝑚𝑚𝑚𝑚𝑚𝑚𝑚 ��𝑎The total member accounts and members’ benefits data is sourced from data collectedunder Reporting Standard SRS 610
and Technical Paper - Choice Heatmap. In this paper APRA focuses on sustainability of member outcomes. For the purposes of these insights, a reference to the sustainability of member outcomes means an RSE licensee's ability to: deliver strong financial outcomes for its members now and in the future; and address areas requiring .