Transcription
U.S. Securities and Exchange CommissionDivision of Economic and Risk Analysis (DERA)Outcomes of Investing in OTC StocksJoshua T. WhiteDECEMBER 16, 2016ABSTRACTThis paper analyzes three aspects of over-the-counter (OTC) stocks: (1) the recent trends in theOTC stock market structure and size; (2) the documented properties of OTC stocks; and (3) thedifferences in returns based on investor and stock characteristics. Approximately 10,000 OTCstocks were quoted at the end of 2013 through 2015, generating a total trading volume of over 200 billion per year. Dollar volume has grown substantially since 2012 and is now concentratedin the segment of the OTC market with no requirements of registration or reporting to the U.S.Securities and Exchange Commission (SEC). A synthesis of recent academic literature revealstroubling properties of OTC stocks. Academic studies find that OTC stocks tend to be highlyilliquid; are frequent targets of alleged market manipulation; generate negative and volatileinvestment returns on average; and rarely grow into a large company or transition to listing on astock exchange. Moreover, these properties tend to worsen when the OTC company has fewerdisclosure-related eligibility requirements. I examine the relationship between OTC investordemographics and investment outcomes using a proprietary database of transaction-level OTCdata with confidential investor information. Analysis of 1.8 million trades by over 200,000individual investors confirms that the typical OTC investment return is severely negative.Investor outcomes worsen for OTC stocks that experience a promotional campaign or haveweaker disclosure-related eligibility requirements. Demographic analysis reveals that older,retired, low-income, and less educated investors experience significantly poorer outcomes inOTC stock markets. Given that retail investors are the predominant owners of OTC stocks, andthe documented trend towards less transparent OTC companies, the results of this study haveimportant implications for investor protection.Note: This study was prepared for Mark Flannery, Director and Chief Economist of the Division of Economic andRisk Analysis. Trevor Tatum provided research assistance. Numerous Commission staff provided helpful commentsand feedback, including Chris Arnold, Scott Bauguess, Jason Berkowitz, Terrence Bohan, Audra Boone, MargaretCain, Joseph Darragh, Owen Donley, Michael Fioribello, Mark Flannery, Sebastian Gomez Abero, John Guidroz,Rahman Harrison, Stephen Johnson, Christina McGlosson-Wilson, Lauren Moore, Holly Pal, Michael Paley, AmyReischauer, Eric Schmidt, Nancy Snow, Josephine Tao, and Pamela Urban. The U.S. Securities and ExchangeCommission, as a matter of policy, disclaims responsibility for any private publication or statement of any of itsemployees. The views expressed in this paper are those of the author and do not necessarily reflect the views of theCommission, or its staff, or of the authors’ colleagues.
1. IntroductionThe preponderance of empirical evidence on investment outcomes focuses on companies withequity listed on a stock exchange such as the New York Stock Exchange (NYSE) or Nasdaq.Yet, another broad set of companies, consisting primarily of smaller firms, have stock that isquoted on OTC markets. While the stock of companies listed on exchanges are predominatelyheld by institutional investors, OTC stocks are owned and traded almost exclusively byindividual (“retail”) investors (Ang et al., 2013). This distinction is important because academicresearch shows that institutional investors play a crucial role in monitoring companies andencouraging better disclosure and governance practices.1 Further, many companies with OTCquoted stock are not required to register or report interim or ongoing financial information withthe SEC. Given the dearth of institutional ownership participation in OTC markets, and the likelyinformational disadvantage of retail investors, I believe that understanding this market isparamount to investor protection. Therefore, I study three aspects of the OTC stock market: (1)the current OTC market structure and size; (2) the documented properties of OTC stocks; and (3)the differences in returns based on investor and stock characteristics.In the past few years, a number of important trends have reshaped OTC markets. For manyyears, the market for OTC equities has been segmented between quotations on the OTC BulletinBoard (OTCBB) and OTC Markets (formerly the Pink Sheets).2 To be eligible for OTCBBquotation, companies must register and report to the SEC (Bushee and Leuz, 2005). Yet, in 2015,the trading volume of OTCBB stocks totaled just 9 billion and averaged fewer than 500 quotedstocks. In contrast to the OTCBB, almost 10,000 stocks were quoted on OTC Markets at the endof each year during 2013 to 2015, generating a total trading volume of more than 200 billionper year. Trading activity on OTC Markets has grown substantially in recent years, as dollarvolume traded in 2015 ( 200 billion) is almost 50% higher than 2012 ( 136 billion). Furtheranalysis reveals that the composition of OTC Markets has evolved towards more companiesquoted on the Pink Tier that has no SEC registration or reporting requirements. Currently, about70% of quoted securities and 85% of dollar volume traded on the OTC Markets is concentratedin the Pink Tier. Consequently, the overwhelming majority of OTC companies have considerablediscretion in the amount of information they provide to investors.Next, I review the distinct properties of OTC stocks by synthesizing the burgeoning academicliterature on this market. A number of recent academic studies establish that OTC stocks differfrom those listed on an exchange because they tend to have poor liquidity and generate severelynegative and volatile returns for investors (Ang et al., 2013; Eraker and Ready, 2015;Brüggemann et al., 2016). Research further indicates that the troubling characteristics of OTCstocks are exacerbated as companies are permitted to disclose less (Luft et al., 2001; Luft andLevine, 2004; Litvak, 2009; Jiang et al., 2015; Brüggemann et al., 2016). This latter point isparticularly salient because OTC stocks are also frequent targets of market manipulation byfraudsters, who often promote OTC stocks by releasing false or misleading information (e.g.,1For stocks listed on an exchange, higher levels of institutional ownership are linked to the following: greatermonitoring of company management resulting in more innovation (Aghion et al., 2013); increased firm disclosureleading to better stock liquidity (Boone and White, 2015); more dividend payouts and larger stock repurchases(Crane et al., 2016); and improved corporate governance policies that increase firm valu e (Appel et al., 2016).2Section 2 provides a detailed description of the OTC market structure and size.Division of Economic and Risk Analysis2
Aggarwal and Wu, 2006; Nelson et al., 2013; Massoud et al., 2016). Although one potentialattraction of investing in OTC stocks is the chance to invest early in a small company that mayeventually grow into a larger one, empirical evidence shows that OTC stocks rarely transition(“graduate”) to an exchange (Brüggemann et al., 2016).Despite the perilous properties of OTC stocks, the growing size of OTC Markets suggests thatinvestors’ demand for these stocks has grown in recent periods. Academic literature posits twohypotheses to explain why individuals continue to invest in OTC stocks despite the tendency forpoor investment outcomes. The first hypothesis is that OTC investors are simply gambling sinceOTC stocks have a lottery-like distribution of returns. The second hypothesis is that investors arepoor at estimating return probabilities of OTC stocks because these companies tend to providefewer disclosures. Most academic studies provide empirical evidence more consistent with thesecond hypothesis and conclude that OTC investors systematically misestimate returnprobabilities (Nofsinger and Varma, 2014; Eraker and Ready, 2015). However, little is knownabout the characteristics of OTC stock investors and their correlation with investment outcomes,especially around stock promotions and disclosure-related eligibility requirements.To shed light on this issue, I examine OTC investor outcomes using a dataset of 1.8 milliontrades by more than 200,000 individual investors. Consistent with existing academic studies, Ifind that the median OTC investor experiences significantly negative investment returns.Investor outcomes worsen for OTC stocks that are promoted, and for companies with weakerdisclosure-related eligibility requirements self-established by OTC Markets. Analysis ofdemographic information reveals that returns on OTC stocks are significantly worse (i.e., morenegative) for elderly and retired investors, and those with lower levels of income and education.This study contributes to our knowledge of OTC markets in several ways. First, I highlight animportant trend in the OTC Markets towards a greater composition of companies in the tier withfewer self-established eligibility requirements pertaining to disclosure. Second, I provide a broadreview of recent academic studies that document the distinct properties of OTC stocks. Third,while many studies examine overall OTC stock returns with cross-sectional data, we know verylittle about individual OTC investor characteristics due in large part to data limitations. Thus, thisstudy also contributes by extending our understanding of the OTC market through direct,transaction-level evidence using confidential trading information to reveal the correlationbetween OTC investor demographics and investment outcomes. The academic literature ontransaction-level OTC investments is limited to a single study by Nofsinger and Varma (2014).This paper examines investor demographics using a sample of approximately 16,000 investorsand 42,000 OTC trades at a single brokerage over 1991 to 1996. My study covers a much morerecent time period and includes a considerably larger OTC dataset of more than 200,000investors and 1.8 million trades across a number of brokerages. To my knowledge, I am also thefirst to look at OTC investor outcomes around stock promotions and OTC Markets’ selfestablished eligibility requirements related to disclosure using transaction-level data.This paper is organized as follows. I provide an overview of the OTC stock market structure andsize in Section 2. I review the relevant academic literature in Section 3. I present an analysis ofOTC investor demographics and outcomes in Section 4. I conclude in Section 5.Division of Economic and Risk Analysis3
2. Market Structure and SizeOTC-quoted equities are not listed on a national securities exchange. Instead, OTC stocks arequoted through interdealer quotation services such as those described below.32.1 OTCBBThe OTCBB is the electronic interdealer quotation system operated by the Financial IndustryRegulatory Authority (FINRA).4 To be eligible for OTCBB quotation, companies must, amongother things, register the class of securities with the SEC and file periodic financial reports to theSEC, or its banking or insurance regulators.In 2015, aggregate OTCBB dollar (share) volume was 8.8 billion (62 billion shares).5 Althoughthe OTCBB averaged 471 quoted stocks during 2015, this number declined to fewer than 400during the first calendar quarter of 2016.2.2 OTC MarketsOTC Markets Group (formerly known as the Pink Sheets, Pink Sheets LLC, and Pink OTCMarkets) privately owns the OTC Markets venue. Subscribing broker-dealers quote securities onthe OTC Markets through the OTC Link ATS interdealer quotation system.6The OTC Markets Group classifies securities into three marketplace tiers (QX, QB, and Pink),on the basis of self-established eligibility requirements, including initial and ongoing reportingand standards of financial disclosure.7 Importantly, many companies quoted on OTC Markets do3Global OTC is another electronic interdealer OTC quotation service that is operated by Archipelago TradingServices, Inc. See www.globalotc.com.4See -asked-questions.5These figures are based on data from FINRA, available at See http://www.otcmarkets.com/. OTC Markets Group publishes real-time quotes of the best bid and ask price foreach stock on its website.7OTC Markets Group currently publishes these self-established eligibility requirements for domestic companiesquoted on OTC Markets: QX Tier: Financial reporting depends on whether the company reports to the SEC. SEC reporting companies(including those reporting under Regulation A) must be current and fully compliant with initial and ongoingannual, quarterly, and interim reports filed to the SEC. Non-SEC reporting companies must comply with theannual, quarterly, and current reporting obligations in the “OTCQX U.S. Disclosure Guidelines” delines.pdf). All companies on the QX Tier must alsoprovide timely disclosures of material news releases through a press release; periodically verify its companyprofile on the OTC Markets website; and submit an initial and annual third-party sponsored ‘advisor’ letterverifying a review of the company’s disclosure practices. QB Tier: Financial reporting depends on whether the company reports to the SEC or a banking regulator. SECreporting companies must be current and fully compliant with initial and ongoing annual, quarterly, and interimreports filed to the SEC. Bank reporting companies must post all disclosures filed with the banking regulator tothe OTC Markets website unless it is deemed non-public. All companies on the QB Tier must also submit aninitial and annual certification signed by the CEO and/or CFO identifying the company’s regulator (SEC orbank regulator) and confirm that the company is current in its reporting obligations to its regulator andmaintains a current and complete profile on the OTC Markets website; disclose the total shares outstanding andin public float at the prior fiscal year end; and report the names and ownership percentages of all officers anddirectors, as well as beneficial shareholders that own more than 5% of outstanding shares.Division of Economic and Risk Analysis4
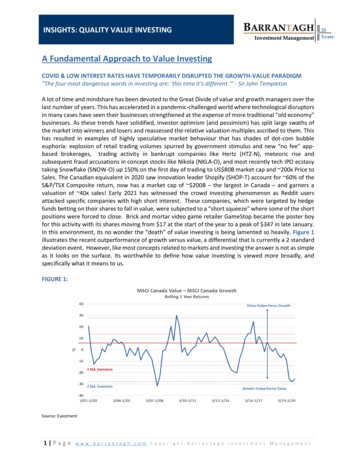
not register any class of securities or report to the SEC.8 OTC Markets’ self-establishedeligibility requirements pertaining to disclosure are stronger for the QX and QB Tiers than thePink Tier.9 OTC Markets Group also reports data on non-quoted securities traded in the GreyMarket. “Grey Market” transactions are unsolicited trades by consenting individuals in securitiesthat are not currently publicly quoted on either the OTCBB or OTC Markets, nor listed on anexchange. Many of these securities have trading symbols, but lack general investor interest orcurrently available information.10OTC Markets further classifies the Pink Tier into three categories according to the availability ofcompany-provided disclosures. Those classifications are “Current Information,” “LimitedInformation,” and “No Information.” To warn investors of potentially negative or nefariousactivities, OTC Markets also labels stocks in all tiers with certain concerns (e.g., marketmanipulation) as “Caveat Emptor.” 11Figure 1 plots the aggregate size of the QX, QB, and Pink tiers between 2012 and 2015. The lefty-axis and vertical bars depict the annual volume traded in billions of dollars. The line graph andcorresponding right y-axis plot the number of quoted securities at the end of each calendar year.Figure 1 shows that the total dollar volume of trades on OTC Markets has grown in recent years.For example, the dollar volume traded in 2015 ( 200 billion) is 47% larger than the dollarvolume traded in 2012 ( 136 billion). During 2013 to 2015, the yearly dollar volume traded onOTC Markets totals between 200 and 238 billion.Figure 1 also shows that dealers quoted approximately 10,000 securities on OTC Markets at theend of each of the years. By comparison, just over 2,700 securities were listed on Nasdaq duringthis same period, and approximately one-quarter of those securities traded on Nasdaq’s tier forsmaller companies. 12 Pink Tier: Financial reporting to a regulator is not required. The “Current Information” category requires thatcompanies must post initial and ongoing annual financial statements to the OTC Markets website. Quarterly andannual financial reports are due within 45 and 90 days of the quarter end, respectively. However, those financialstatements are not required to be audited by a firm registered with the Public Company Accounting OversightBoard (PCAOB). “Current Information” category companies must also publish a news release within 4 businessdays to the OTC Markets website following specific material corporate events (see lines.doc). The “Limited Information” category requires that companies either havefinancial information no older than 6 months published on the OTC Markets website or have made at least onerequired filing with the SEC in the past 6 months. “No Information” companies are those not reporting to aregulator and or OTC Markets, or those with information older than 6 months on the OTC Markets website.8A company (other than a bank or bank holding company) must register its securities with the SEC under Section12(g) of the Securities Exchange Act of 1934 if it has (1) more than 10 million of total assets; and (2) a class ofequity securities (other than those that are exempted) that is “held of record” by either 2,000 or more persons or 500or more persons who are not accredited investors. A company must also register its securities with the SEC if it liststhem on any national securities exchange. See, generally, Section 12 of the Securities Exchange Act of 1934.9See http://www.otcmarkets.com/learn/otc-market-tiers, ing.10See 1See Litvak (2009), Jiang et al. (2015), and Brüggemann et al. (2016) for discussions on tiers of OTC Markets.See Nasdaq, Inc. SEC Form 10-K, 0112019316000020/ndaq-20151231x10k.htm. In May 2016, about a quarter (805 out of 3,142) of the securities listed on Nasdaq trade on12Division of Economic and Risk Analysis5
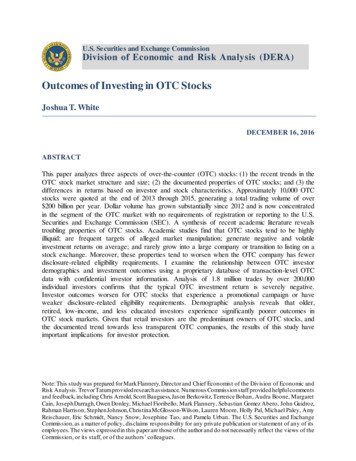
Figure 1. Annual size of equity securities trading on OTC mber of securitiesDollar volume (billions)23070509,00020122013Dollar volume20142015Number of securitiesSource: The data in Figure 1 is based on annual reports that the OTC Markets Group publishes on its website inancials). These data do not include securities quoted on the OTCBB or traded inthe Grey Market.Figure 2 displays the number of securities quoted on OTC Markets at year-end by tier. The graphdepicts 35% growth in the number of companies quoted on the Pink Tier since 2012, and a 70%decline in the number quoted on the QB Tier in the same period.13 Approximately 85% of OTCMarkets equity securities were quoted on the Pink Tier by the end of 2015. 14 Thus, while thetotal number of securities quoted on the OTC Markets has remained mostly constant during thisperiod, the composition of the OTC Markets has shifted towards a greater proportion ofcompanies in the Pink Tier, which has the weakest self-established eligibility requirementspertaining to disclosure.its Capital Market Tier for smaller companies (formerly the Nasdaq SmallCap Market). Seehttp://www.nasdaq.com/screening/companies -by-industry.aspx?exchange NASDAQ.Some of the decline in the QB Tier is due to changes in OTC Markets’ self-established eligibility requirements inMay 2014. As of that date, to remain in the QB Tier, a company has to meet a minimum bid price test and submit anannual certification. OTC Markets Group downgrades, to the Pink Tier, companies not meeting those standards. Seehttps://www. d 133631.13As of November 7, 2016, approximately 62.3% of companies in the Pink Tier are categorized as “CurrentInformation,” 4.4% are “Limited Information,” and 33.3% are “No Information.”14Division of Economic and Risk Analysis6
Figure 2. Number of equity securities trading on the OTC Markets by tier12,000Number of 014QX2015QBSource: The data in Figure 2 is based on annual reports that the OTC Markets Group publishes on its website inancials). These data do not include securities quoted on the OTCBB or traded inthe Grey Market.Dollar volume (billions)Figure 3. Dollar volume of equity securities trading on the OTC Markets by ce: The data in Figure 3 is based on annual reports that the OTC Markets Group publishes on its website inancials). These data do not include securities quoted on the OTCBB or traded inthe Grey Market.Division of Economic and Risk Analysis7
Figure 3 presents the dollar volume traded on the OTC Markets by tier. Volume traded on thePink Tier increased by approximately 70% between 2012 and 2015, rising from 81 billion to 138 billion. Conversely, dollar volume traded on the QB Tier declined during this period. In themost recent year, just less than 70% of the total dollar traded occurs in the Pink Tier.Overall, Figures 1–3 show that the size of the OTC Markets is large and has grown in dollartrading volume, and that much of the market is now concentrated in the Pink Tier.3. Literature ReviewRecent academic work analyzes the properties of OTC stocks. These studies generally focus onfive aspects: (1) liquidity; (2) returns; (3) market manipulation; (4) transition to an exchange; and(5) investor participation. Below, I review empirical evidence from existing literature. I alsodiscuss the relationship between company transparency and each of these factors. As a point ofreference, the appendix provides additional information on relevant academic studies.3.1 LiquidityStock price liquidity reflects the ability of shareholders to quickly buy and sell securities neartheir true market value and to do so without substantial price impact. Illiquid stocks are risky toinvestors because they might not be able to rapidly sell their holdings without losing money.Moreover, stocks with scarce trading activity often experience wide fluctuations in price(Karpoff, 1987; Pagano, 1989) and are more expensive for investors to trade and for dealers tohold in their inventory (Benston and Hagerman, 1974; Duffie et al., 2005).Empirical evidence shows that OTC stocks are less liquid than those listed on a nationalsecurities exchange such as the NYSE or Nasdaq (Ang et al., 2013; Eraker and Ready, 2015;Brüggemann et al., 2016). For example, Brüggemann et al. (2016) show that OTC stocks havelower levels of liquidity than a matched sample of similar Nasdaq-listed stocks. Moreover, theirsample of OTC stocks quoted on the Pink Sheets (now OTC Markets) averaged zero tradingvolume every other day, and one quarter of their Pink Sheets sample had zero volume on 90% oftrading days.15 These results complement evidence that stocks delisted from a national securitiesexchange that continue trading in the OTC market experience significant reductions in liquidity(Sanger and Peterson, 1990; Harris et al., 2008; Macey et al., 2008).16In general, academic literature documents a positive relationship between company transparencyand stock price liquidity (Healy and Palepu, 2001; Beyer et al., 2010). The notion is thatcompanies providing greater disclosure have less information asymmetry, thereby reducing theprobability of adverse selection (Leuz and Verrecchia, 2000) and in turn increasing stock priceliquidity (Balakrishnan et al., 2014). 17 Studies confirm the relationship between disclosure andAlthough this venue is currently branded as “OTC Markets,” academic studies largely refer to it as the PinkSheets (its former name).1516Delisting refers to the removal of a stock from an exchange. Delisting often occurs because a company is nolonger able to meet minimum listing standards (Macey et al., 2008).17Information asymmetry is a condition where one party has more or superior information compared to the other.Adverse selection refers to a situation where an investor with better information about a company exploits a lessinformed investor by transacting at an unfair price.Division of Economic and Risk Analysis8
liquidity among OTC stocks. For example, Bushee and Leuz (2005) examine the mandatoryphase-in of SEC reporting requirements for firms quoted on the OTCBB between July 1999 andJune 2000. Their study documents a positive association between mandatory increases inOTCBB disclosure requirements and stock price liquidity.More recently, Brüggemann et al. (2016) document a similar relationship between companytransparency and the liquidity of OTC stocks. In their paper, OTC stocks exhibit a monotonicdecline in liquidity, as reporting and eligibility requirements pertaining to disclosure weakenacross the OTCBB, Pink Sheets, and Grey Market. Even within the Pink Sheets (now OTCMarkets), studies find that stock liquidity is lower for categories of companies with lesstransparency (Jiang et al., 2015; Brüggemann et al., 2016).Academic research also links company opacity with deterioration in the value of OTC stocks.Ang et al. (2013) find that illiquidity premiums (i.e., the larger discount rates that investors applyto stocks that are illiquid) are highest for OTC stocks held by individual investors and thosesupplying fewer periodic disclosures of financial information. Their paper shows that even themost liquid OTC stocks generate a negative risk-adjusted return.18 Overall, academic literaturefinds that OTC stocks tend to be illiquid, especially when companies have fewer disclosures.3.2 ReturnsThe return properties of OTC stocks are distinct from stocks listed on national securitiesexchanges. Empirical evidence shows that OTC stock returns are typically negative, volatile, andhighly skewed.Investing in OTC stocks, on average, generates negative returns for investors (Luft et al., 2001;Ang et al., 2013; Nofsinger and Varma, 2014; Eraker and Ready, 2015; Jiang et al., 2015;Brüggemann et al., 2016). For example, Brüggemann et al. (2016) study a sample of over 10,000OTC stocks from 2001 to 2010 and find average and median annual returns of –27% and –37%,respectively. Similarly, Eraker and Ready (2015) study a sample of approximately 6,800 OTCstocks between 2000 and 2008. The investors in their sample average a –24% annual return afteraccounting for transaction costs. Moreover, these OTC investors lost an aggregate of 180billion over the sample period.For many years, academic papers have identified stocks of smaller companies as being riskierinvestments than those of larger ones (e.g., Banz, 1981). Brüggemann et al. (2016) report that themajority of OTC stocks have a small market capitalization and that the median OTC stock ispriced as a penny stock.19 Moreover, the prior subsection discusses how OTC stocks have greaterliquidity risk than those trading on a national securities exchange. Thus, one natural question iswhether the negative returns in OTC stocks might simply reflect the exposure of investors to18“Risk-adjusted return” is a measure of the return relative the amount of risk taken.19Market capitalization is calculated by multiplying the current market price per share times the number of totalshares outstanding. Companies with a small market capitalization are frequently classified as “microcap” or“nanocap.” The term “penny stock” generally refers to stocks that trade below 5 per share. See Section 15(h) andRules 15g-1 through 15g-100, and 3a51-1 under the Securities Exchange Act of 1934.Division of Economic and Risk Analysis9
larger amounts of risk. In other words, OTC stocks might generate a negative actual return but apositive risk-adjusted return. Empirical evidence rejects this notion.To answer this question, academic studies examine OTC stock returns after accounting forknown risk factors, such as company size. These studies find that, in addition to negative actualreturns, OTC stocks also exhibit negative risk-adjusted returns (Ang et al., 2013; Eraker andReady, 2015; Brüggemann et al., 2016). Eraker and Ready (2015) show that a portfolio of OTCstocks underperforms a portfolio of exchange-listed stocks by about 2% percent per monthincluding transaction costs. As noted above, Ang et al. (2013) find that even the most liquid OTCstocks still generate a negative risk-adjusted return.The returns of OTC stocks are also significantly more volatile than exchange-listed stocks (Anget al., 2013; Brüggemann et al., 2016). For example, Brüggemann et al. (2016) find the volatilityof OTC stock returns is more than two times larger than the return volatility of a matched sampleof Nasdaq-listed stocks.Academic studies point to a lack of information produced by OTC companies as one determinantof negative and volatile OTC stock returns (Luft et al., 2001; Luft and Levine, 2004). Leuz et al.(2008) study a sample of just under 500 companies that stop reporting to the SEC (i.e., “godark”), but continue to be quoted on the OTC markets. They find that the stock price of thosecompanies experiences an abnormal decline of approximately 10% when the companyannounces the decision to suspend disclosures to the SEC.20 Litvak (2009) studies OTC stocksafter OTC Markets introduced a classification of tiers on the basis of self-established eligibilityrequirements pertaining to company provided information and finds that the market reaction wassignificantly negative for companies assigned to the lower-disclosing c
disclosure-related eligibility requirements self-established by OTC Markets. Analysis of demographic information reveals that returns on OTC stocks are significantly worse (i.e., more negative) for elderly and retired investors, and those with lower levels of income and education. . quoted on OTC Markets: QX Tier: Financial reporting depends .