Transcription
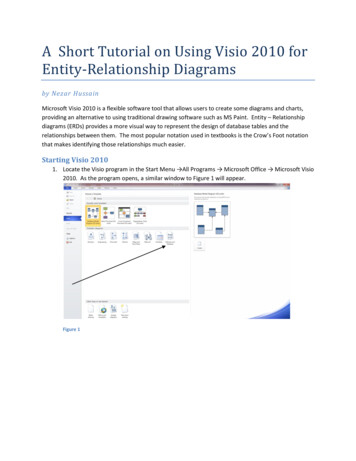
A Short Tutorial on Using Visio 2010 forEntity-Relationship Diagramsby Nezar HussainMicrosoft Visio 2010 is a flexible software tool that allows users to create some diagrams and charts,providing an alternative to using traditional drawing software such as MS Paint. Entity – Relationshipdiagrams (ERDs) provides a more visual way to represent the design of database tables and therelationships between them. The most popular notation used in textbooks is the Crow’s Foot notationthat makes identifying those relationships much easier.Starting Visio 20101. Locate the Visio program in the Start Menu All Programs Microsoft Office Microsoft Visio2010. As the program opens, a similar window to Figure 1 will appear.Figure 1
2. Under Template Categories, click on Software and Database. This will take you to the differenttemplates under this category as shown in Figure 2.Figure 2Now choose the Database Model Diagram, select the desired measurement units from the righthand side and click on Create. You can also choose the Database Model Diagram directly fromthe Recently Used Templates in Figure 1 if you have chosen this template previously.3. Once the Drawing window appears we need to setup the program to display Crow’s FootNotation. Click on the Database tab and choose the Display Options button under the Managegroup. The Database Document Options window like in Figure 3a should open up. Now choosethe Relationship tab and check the Crow’s feet option as shown in Figure 3b. Click OK to exitthis window.Figure 3aFigure 3b4. Before we start to work on drawing our ERD, let’s explore some important parts of Visio here.As we can see in Figure 4, we have Entity Relationship (US Units) under Shapes on the left handside of the screen. We shouldn’t need shapes from different templates, but if we did we canchoose those from the More Shapes button, which will show us a list of all available templatesfor different diagrams. Once more than one group of shapes is open (In our case we have EntityRelationship and Object Relationship), we can toggle between them by clicking once on thedesired group name, which will be displayed. If a shape group is opened by mistake and is
cluttering your screen, you can simply right click that shape group and choose close from themenu.There are also different tabs at the top that allows access to different options. The File taballows us the option to create another new file.If we look at the bottom of the drawing area there are pages, similar to the pages in MS Excel.Currently we only have one page, but we can add more by either clicking right-next to the lastpage, or by right clicking on any of the pages and choosing Insert. That menu also allows foroptions such as Delete, Rename and Reorder pages.Finally, it is important to start by saving your file onto your hard disk, even before you start todraw anything. It is also good practice to continuously save your work, especially in biggerprojects.Figure 4Creating Entity-Relationship DiagramsThere are generally two approaches to drawing ERDs on Visio, an automated approach and a moremanual one.Manual ApproachThis approach is preferred when drawing an ERD and you feel the automated way is restricting in termsof the relationship types you can draw.1. To Draw Tables, we can either drag an Entity shape as described earlier, or for a simpler look wecan simply draw a rectangle. To draw a rectangle, under the Home tab, in the Tools group clickon the white rectangle button. Click on the arrow next to it and choose Rectangle. Now go on
the drawing canvas and click anywhere to pin the starting point (upper corner of the rectangle)and drag while clicking to the desired size. It is recommended to draw all the rectangles (ortables in our design) at once. Now click back on the pointer Tool button in the Tools groupunder the Home tab to be able to select shapes again. To enter names for those tables, simplydouble-click within each triangle and type the desired name.Figure 52. To draw the relationship lines between the rectangles or entities, we go the same button wechose to draw the rectangles, but choose line from the drop-down menu instead. Now drawlines between the tables in a similar fashion to how we drew the rectangles above. Note that ifthe tables are moved around the lines will not move accordingly like is the case with theautomated relationship connectors.3. To change the endings of the lines to match our design, we make sure the pointer tool button ishighlighted, we click on the desired line, then right-click that line, go down to the Format optionand choose Line from the sub-menu. A window similar to Figure 6 should appear. In the Arrowsarea, choose the desired endings from the Begin and End drop-down menus accordingly. Tomake the endings more visible change both the Begin size and End size to Extra Large. Click OKto exit that window. Make sure the line looks correct.Figure 64. Once you’re done with all the lines, you should have completed the design.
Automated Approach:This is preferred when drawing ERDs for designs in higher normal forms, as there are more rules tofollow here.1. For each table, drag an Entity shape onto the drawing canvas as in Figure 7. As you can see thisautomatically displays a Database Properties area where we can enter the entity or tableproperties. Under Physical name enter the desired table name. This should automaticallyupdate the conceptual name and update the actual design in the drawing area. Then in theDatabase Properties pane, under Categories choose columns to enter column names, data typesif desired, and choose whether this column is Req’d (Required), a PK (Primary Key) or not.Figure 72. Repeat the same process for all the tables in your design.3. To draw the relationships between the entities (tables) we drag a Relationship shape onto theoriginal table until the table borders turns red. Now drag the other end to the table where theforeign key from the original table will be created. In the Database Properties pane, while therelationship is chosen, the relationship properties can be chosen. Under the Definition category,you can Associate or Disconnect between the columns of the Parent and Child tables. Under theName category, you can define the Parent-Child phrase (has is default) and the Child-Parentphrase (is of is default). Under the Miscellaneous category you define the relationshipcardinality (one-to-many, etc) and whether it is identifying or not. An Identifying Relationshiptype means that the PK of the parent table will be both a FK in the child table and part of the PKas well. A Non-identifying Relationship type means that the PK of the parent table will be a FK in
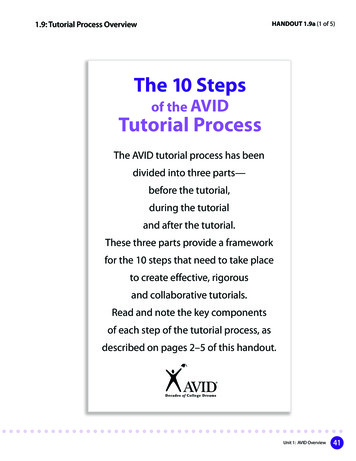
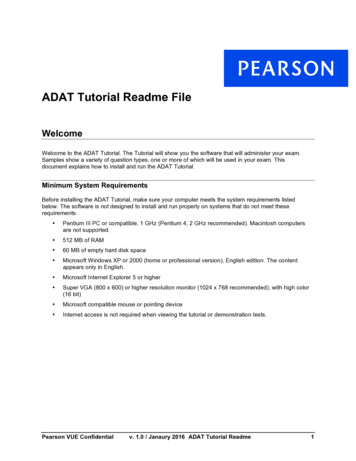
the child table. The table below shows what each cardinality option means. Optional andmandatory here refer to the child table.Cardinality OptionMeaningZero or MoreMany - OptionalOne or MoreMany - MandatoryZero or OneOne -OptionalExactly OneOne - MandatoryRangespecify a range for the cardinality4. Repeat step number 3 until all the relationships have been defined. Note that many to manyrelationships under this approach is not an available option, the parent side is always one tosomething.ERD ExampleTo draw the E-R diagram across, we’ll need to utilize the manual approach.1. We start by drawing three rectangles under each other. (Hint: You can create oneand use the copy – paste functionality so that they’re all exactly the same size.)2. Choose the Pointer Tool. Now double-click each rectangle and enter theappropriate table name (Customer, Order, and Product).3. Draw a line between the Customer and Order tables, and another line betweenthe Order and Product tables. Now right-click the first line, choose Format Line. The Line options window should be changed to match Figure 8a.4. Repeat for the second line so that the Line options window matches Figure 8b.5. Save the Visio file.CUSTOMERORDERPRODUCTdFigure 8aFigure 8b
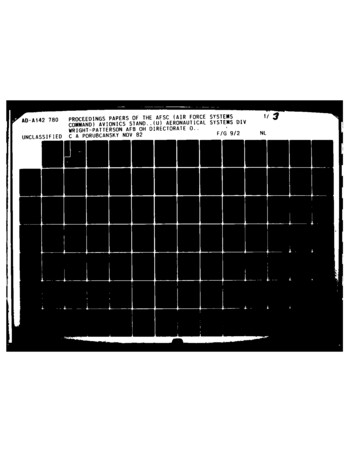
To draw the E-R diagram below, we’ll need to utilize the automated approach.CustomerPKCustomer IDProductINTEGERPKCustomerName CHAR(30)Product IDINTEGERStandardPriceCURRENCYhas / is ofhas Orders / Order belongs toOrderLineOrderPKOrder IDINTEGERFK1OrderDateCustomer IDDATETIMEINTEGERPK,FK1PK,FK2has / is ofOrder IDINTEGERProduct ID INTEGERQuantityINTEGER1. Drag four Entity shapes onto the drawing canvas. Figure 9a shows the Definition categoryoptions for the Customer table. Figure 9b shows the Columns category and Figure 9c shows theoptions for Primary ID category.Figure 9aFigure 9bFigure 9c
2. Do the same for the other three entities. Figures 10, 11, and 12 show the Columns category fortables Order, OrderLine and Product respectively.Figure 10Figure 11Figure 123. Drag a relationship shape to connect between the Customer table and the Order table.Remember to drag it on the Parent table until the outline turns red, and then drag the end ofthe line until the Child table turns red. Figure 13a, 13b, and 13c show the desired options forDefinition, Name, and Miscellaneous categories. The Definition category should beautomatically done, since the column names are the same. In the Name category we specify theverb and inverse phrases as an example. Those phrases can also be removed completely if theydo not add to the diagram.Figure 13aFigure 13b
Figure 13c4. Now repeat step 3 for the other two relationships. Figures 14a and 14b show the Definition andMiscellaneous categoriesrespectively for therelationship betweenOrder and OrderLinetables.Figure 14aFigure 14b5. Figures 15a and 15b show the Definition and Miscellaneous categories respectively for therelationship between Product and OrderLine tables.Figure 15aFigure 15b6. Save the Visio file.
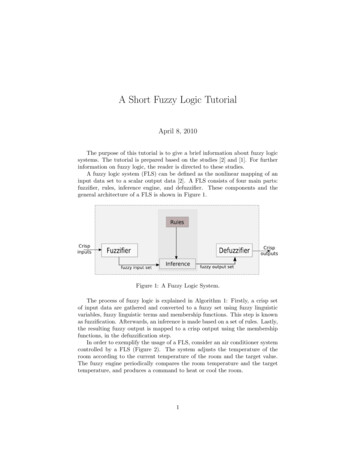
We can also utilize a combination of those two approaches to produce the following diagram. Here wedragged Entity shapes, but didn’t include any column names. We also drew lines between the entitiesto represent relationships, rather than use the Relationship shape.CustomerOrderProduct
Microsoft Visio 2010 is a flexible software tool that allows users to create some diagrams and charts, providing an alternative to using traditional drawing software such as MS Paint. Entity - Relationship diagrams (ERDs) provides a more visual way to represent the design of database tables and the