Transcription
Office of the Senior Fellow for Resource DevelopmentMinnis E. RidenourSenior Fellow for Resource Development250 S. Main Street, Suite 320 540/231-0823 Fax 540/231-0814 www.vt.eduENVISIONING VIRGINIA TECHBEYOND BOUNDARIESFUNDING MODELS AND VIRGINIA TECHPREPARED BY:JAIMIE EDWARDSOCTOBER 2015
“What is the right thing to do for tomorrow?”Funding Models and Virginia TechAs Virginia Tech moves towards becoming an internationally recognized, global landgrant institution, considering current and identifying new funding sources will be critical in itsendeavor. Characteristics of world-class universities include “high levels of government andnongovernment sources of funding” that include “government budget funding for operationalexpenditures and research, contract research from public organizations and private firms, thefinancial returns generated by endowments and gifts, and tuition fees” (Salmi, 2009, p. 6, 23).This paper seeks to examine some of the challenges and opportunities associated with fundingsources that Virginia Tech will face as it moves forward over the next 30 years and beyond.These areas include state appropriations, tuition and fees, endowment opportunities, federaldollars, and other opportunities.Decreasing State AppropriationsIn the 1980s, public four-year institutions in Virginia maintained a 70/30 ratio ofstate/student funding (Virginia Tech, 2015). More recently, there has been a downward trend inpublic support of higher education institutions. In Virginia, since 1998, state funding for highereducation has decreased 2,831 per student, and the state spends approximately 25 percent lessper student than the national average (JLARC, 2014). State funding for higher education inVirginia declined 27.89 percent in constant dollars between FY2008 to FY20131. Similarly,1In FY08, Virginia Tech received 8,373 GF per resident student. In FY13, Virginia Tech received 6,680 GF per resident student. Dataobtained by the Office of Budget and Financial Planning, May 4, 2015.1
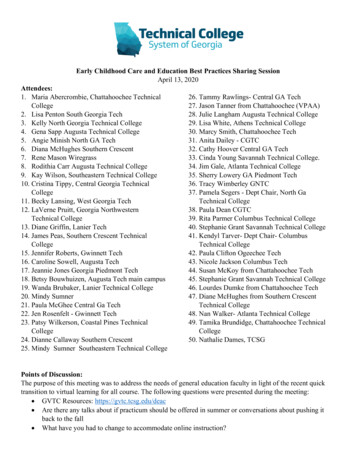
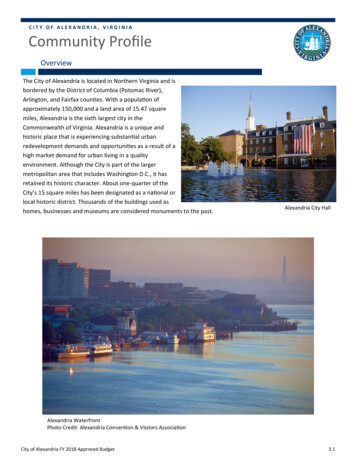
between FY2002 and FY2015, the state funded portion of Virginia Tech’s annual operatingbudget (University Division and Cooperative Extension and Agricultural Experiment StationDivision) declined from 39 to 18 percent (Office of Budget and Financial Planning, 2014).Figure 1Virginia Tech Office of Budget and Financial Planning Total Revenue Sources, 2000-2001FinancialAssistance forE&G Programs15%General Fund41%Auxiliary Fees,Sales, andServices 18%Federal Funds 2%E&G Sales andService 1%All Other Income3%Tuition and Fees20%Source: Virginia Tech. Office of Budget and Financial Planning. (2000). 2000-2001 authorized budget document.Figure 1 shows the revenue sources for Virginia Tech in 2000-2001. The general fundaccounted for 41 percent of the revenue for the university, while tuition accounted for 20 percent(Virginia Tech, 2000). By FY 2015-2016, the funding model had shifted in such a way that thelargest portion of revenue for the university came from tuition and fees, while state fundingdropped to only 18 percent of Virginia Tech’s revenue (Virginia Tech, 2015).2
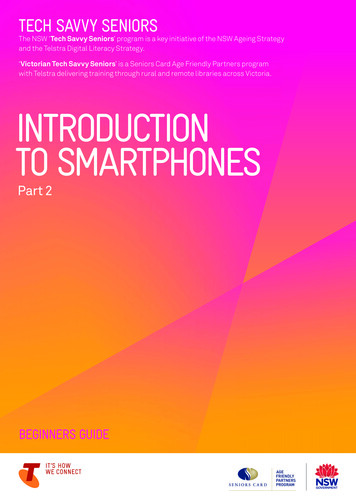
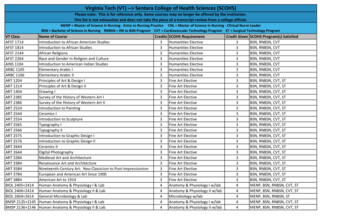
Figure 2Virginia Tech Office of Budget and Financial Planning Total Revenue Sources, 2015-2016FinancialAssistance forE&G Programs24%General Fund18%Auxiliary Fees,Sales, andServices 22%Tuition and Fees32%Federal Funds1%E&G Sales andService 1%All OtherIncome 2%Source: Virginia Tech. Office of Budget and Financial Planning. (2015). 2015-2016 authorized budget document.As a result, tuition and fees have increased to help mitigate the reduction of state supportand cover unavoidable cost increases as well as state cost assignments. With declining publicfinancial support comes increasing pressures on leaders to both manage their costs efficientlyand be innovative in the ways in which universities generates revenue.Tuition and FeesWith the growing gap between state funding and the cost of higher education, the need torecoup the expenses of education is falling more and more on the students and their families.This means that tuition and fees, as well as student debt, are steadily increasing. In-state tuitionand fees at Virginia Tech were 2,019 for the 1985-1986 academic year (SREB, 2000). If tuition3
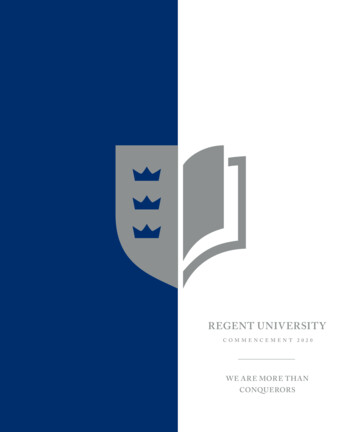
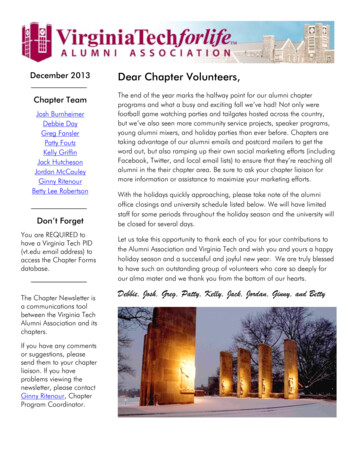
had risen solely at the inflation rate based on the Consumer Price Index, in-state tuition and feesat Virginia Tech today would be 4,4422 (United States Department of Labor, 2015). Instead,2014-15 tuition and fees for in-state students at Virginia Tech is 270 percent more than theinflation-adjusted 1985 rate (SREB, 2000). Figure 3 illustrates the increases in both tuition andmandatory E&G fees and mandatory non-E&G fees between academic years 2006-2007 and2015-2016 (SCHEV, 2015).Figure 3Virginia Tech Full-time Resident Undergraduate Student Charges (2006-2016)Full-time Resident Undergraduate Student Charges140001200010000800060004000200002006-2007 2007-2008 2008-2009 2009-2010 2010-2011 2011-2012 2012-2013 2013-2014 2014-2015 2015-2016Tuition & Mandatory E&G FeesMandatory Non-E&G FeesSource: SCHEV, 20152Inflation rate calculated using the United States Department of Labor calculatorhttp://www.bls.gov/data/inflation calculator.htm4
Issues of affordability and accessibility need to be addressed as tuition rates increase.The university’s land-grant mission to be accessible to and in service to Virginia residents in partdrives the demand to constrain tuition costs. However, because of a combination of factorsincluding declining state appropriations per student, tuition and required fees for in-state studentsgrew by 96 percent while tuition and required fees for out-of-state students grew by 63 percentover the past decade. In-state undergraduate students for the 2005-2006 academic year werecharged 6,378 while out-of-state undergraduate students were charged 17,836 (UniversityBursar, 2005). For the 2015-2016 academic year, in-state undergraduate students were charged 12,485 compared to the 29,128 out-of-state undergraduate students will be charged in tuitionand fees (University Bursar, 2015). As the need to reduce student loan debt, limit tuitionincreases, and maintain accessibility for all qualified students grows, the university must beinnovative in how it manages its resources by both constraining costs and generating additionalnon-state-based revenue streams.Endowment OpportunitiesEndowments provide an additional and lasting revenue source to colleges anduniversities. “Independent colleges and universities always have considered their endowments tobe a principle source of stability and consistent support. Public universities have also becomemore interested in endowments, operating in partnership with affiliated foundations to protect theincome flow from the many vagaries of legislative appropriation” (Chabotar, 2006, p.81-82). Inaddition to creating fiscal stability, endowments often allow universities the ability to accomplishgoals outside of their normal operating expenses, such as scholarships for students and funds forfaculty talent recruitment. This funding mechanism is a key area that allows for growth.5
Decreased funding trends at the state level mean that it is critical that Virginia Techincrease its endowment. Virginia Tech’s nearly 800 million endowment through the VirginiaTech Foundation provides faculty and research support, student scholarships and internships, andeconomic development in communities across the Commonwealth (Virginia Tech, 2014). In FY2012-2013, the Virginia Tech Foundation contributed 146 million “in support of theuniversity,” up from 124.8 million in FY 2008-2009 (Virginia Tech, 2013). Potential growthopportunities make endowment funding an important resource for the university’s future.Virginia Tech ranked 116th out of 854 public and private colleges and universities withan endowment of 796 million (National Association of College and University BusinessOfficers, 2015). Table 2 shows the average endowment for our benchmarks at 2 billion, withthe median of our benchmarks being 1.5 billion. Among our benchmarks, we ranked 19 out of25 (See Appendix A for benchmarks). Ranked first among our benchmarks, and second amongall public universities behind only The University of Texas system, is The University ofMichigan at Ann Arbor. In 1988, the University of Michigan had an endowment of only 300million. Over the past 26 years, they have developed an endowment totaling 9.7 billion(National Association of College and University Business Officers, 2015). According toUniversity of Michigan’s chief investment officer Erik Lundberg, this growth was due to the factthat the university is careful when investing, but more importantly, they are careful in the waythat they spend endowment funds. Distributions from the endowment are limited to 4.5 percentof the total value of the endowment, averaged over the past seven years (Woodhouse, 2013).Virginia Tech decides it distribution rate annually based on the Consumer Price Index for theprior year. For FY 15, the approved range was 3.2 percent-4.7 percent based on programspending (Virginia Tech, 2014).6
As Virginia Tech focuses on its goal of becoming an internationally recognized globalland grant institution, endowment growth is important. Lundberg believes that there is acorrelation between university endowments and academic excellence. “If you look at the highestranking universities, they all have big endowments” (Woodhouse, 2013; see also Salmi, 2009).Giving is improved when the endowment is successful, as donors have more faith that their giftsare being used responsibly (Woodhouse, 2013).7
Table 12014 Endowment Rankings of Benchmark InstitutionsRankUniversity2014 endowment (in thousands)9University of Michigan at Ann Arbor 9,731,46024Ohio State University* 3,547,56625University of Pittsburgh main campus 3,492,83927Pennsylvania State University at University Park* 3,445,96529University of Minnesota-Twin Cities (and Foundations)* 3,164,79231University of Washington 2,832,75332UNC Chapel Hill (and Foundations) 2,695,66333Purdue University at West Lafayette* 2,443,49434University of Wisconsin Foundation* 2,332,18536University of Illinois at Urbana-Champaign (and Foundation)* 2,277,93239Michigan State University* 2,145,42446Georgia Tech (and Foundation) 1,889,01459University of Florida (and Foundation)* 1,519,52261University of California at Berkeley Foundation* 1,496,43768University of Missouri System* 1,440,56189University of Colorado Foundation 1,063,089100Rutgers University at New Brunswick* 918,575103North Carolina State University* 885,055116Virginia Tech Foundation* 796,437121Iowa State University (and Foundation)* 777,018124University of Arizona (and Foundation)* 760,679150University at Buffalo Foundation* 624,791233University of California at Davis Foundation* 313,876254University of Maryland at College Park* 273,090288State University of New York at Stony Brook Foundation 214,4468
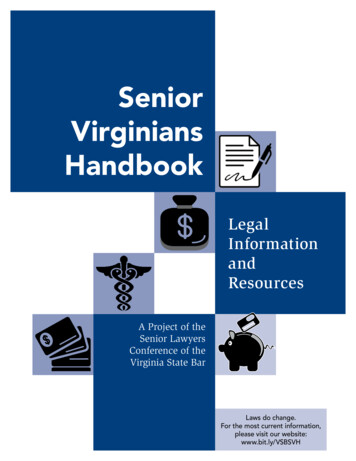
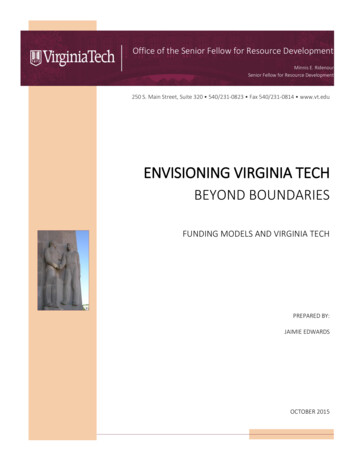
Source: NACUBO, 2015Note: For the purpose of examining endowments, we started with peers SCHEV 4 institutions and removeduniversity systems (University of Texas and Texas A&M) and private institutions (Massachusetts Institute ofTechnology, Cornell University, and University of Southern California). Final list located in Appendix B.*Indicates land-grant institutionTable 2Mean, Median and Range of Endowments of Benchmark Institutions, 20142014 Endowment (in thousands)Range (Maximum) 9,731,460Range (Minimum) 214,446Mean 2,043,306Median 1,519,522Land Grant Institutions Mean 1,669,704Virginia Tech 796,437Source: NACUBO, 2015Note: For the purpose of examining endowments, we started with peers SCHEV 4 institutions and removeduniversity systems (University of Texas and Texas A&M) and private institutions (Massachusetts Institute ofTechnology, Cornell University, and University of Southern California). Final list located in Appendix B.Long-term growth for endowments aids a university’s ability to plan for the future.Based on the current endowment (FY15) at Virginia Tech ( 796,437,000) and its average growthrate over the last ten years (8.46 percent), while adjusting this for inflation (3 percent), it ispossible to project endowment trends for the university. Based on these calculations VirginiaTech will have an endowment of 4,364,755,319 in the year 2047. In comparison, ourbenchmarks, based on the current mean endowment of 2,043,306,502 with an average growth9
rate over the last ten years (9.8138 percent), adjusted for inflation (3 percent), will have anaverage endowment of 16,842,603,523. Using the median for our benchmarks, the averageendowment will be 12,525,143,115. Based in these trends, it will be necessary for VirginiaTech to increase contributions to the endowment immediately, or the gap between it and its peerswill expand exponentially.Figure 4Endowment Growth at 2047 by Virginia Tech and Benchmark InstitutionsEndowment Growth: Virginia Tech and Benchmark Institutions(in 10,000,0008,000,0006,000,0004,000,0002,000,000FY 2014Virginia TechFY 2047Benchmark Institutions (Median)Benchmark Institutions (Mean)Source: NACUBO, 2015Note: For the purpose of examining endowments, we started with peers SCHEV 4 institutions and removeduniversity systems (University of Texas and Texas A&M) and private institutions (Massachusetts Institute ofTechnology, Cornell University, and University of Southern California). Final list located in Appendix B.Federal DollarsRecently, federal spending for higher education outpaced state funding. According to a2015 report by The Pew Charitable Trust, “in 2013, federal spending on major higher education10
programs totaled 75.6 billion, state spending amounted to 72.7 billion, and local spending wasconsiderably lower at 9.2 billion. These figures exclude student loans and higher educationrelated tax expenditures” (The Pew Charitable Trusts, 2015). The 75.6 billion of federalspending includes Federal Pell Grants, Federal research grants, federal veterans’ educationalbenefits, general-purpose appropriations and other federal financial aid grants and grantprograms (The Pew Charitable Trust, 2015). State funding was made up of 53 billion ingeneral-purpose appropriations, 10.1 billion in state research, agriculture, and medicalappropriations, and 9.6 billion in state financial aid grants (The Pew Charitable Trust, 2015).According to the most recent rankings, released February 2015 by the National ScienceFoundation, Virginia Tech is currently ranked 38th for research and development expenditures(National Science Foundation, 2015). For FY 13, the university was awarded 496 million, upfrom 454 million in FY 12. These awards, a major piece of federal funding for the university,play a significant role not only in the research efforts at Virginia Tech, but also in theuniversity’s national and international reputation. While many surveyed in the 2013 presidentialsearch process believed that the university’s focus on research has had a negative impact on thequality of teaching and learning, research funding plays a major role in supporting theuniversity’s comprehensive mission (Virginia Tech Presidential Search, 2013).11
Figure 5Research Expenditures by Entity, 1992-2009Research Expenditures by Entity 1992-200960000500004000030000200001000001992 1993 1994 1995 1996 1997 1998 1999 2000 2001 2002 2003 2004 2005 2006 2007 2008 2009All R&D Expenditures (in millions)Federal Expenditures (in millions)State and Local (in millions)Industry (in millions)Institution (in millions)All Other Sources (in millions)Source: NSF, 2011Although federal spending for research has improved since 2006, “the growth rates werewell behind the pace of gross domestic product (GDP) expansion” (Boroush, 2013). In the past,“total R&D spending outpaces that of GDP-regardless of whether the averaging period is the past5, 10, or 20 years” (Boroush, 2013). With changes in federal funding, opportunities to capturenecessary research dollars must be found in other areas. Universities working to build a greaterpresence in the global sphere can build relationships with international funders as well as othernational governments that have research or other types of funding available for higher education(Altbach & Knight, 2007).12
Other Areas to ConsiderWhile it is suggested that the above four areas: state appropriations, tuition and fees,endowments, and federal funding, will continue to make up the lion's share of higher educationfunding, there are many innovative ideas trending in higher education currently that may impacttraditional college and university funding models. Some of these other sources of fundinginclude partnerships, corporate collaborations, intellectual property, startups andentrepreneurship. Many of these areas are critical for the growth of universities and the creationof knowledge. I address the possibilities and challenges of these areas are addressed in regards totheir potential success as funding sources.Creating a Critical MassCreating a critical mass is one of the ways in which colleges and universities arecombating the changes in funding that are occurring in higher education. This is beingaccomplished in a variety of ways, such as the merging of schools in an attempt to decreaseoverhead and administrative costs and growing enrollments. In Georgia, for example, the Boardof Regents in 2013 voted to merge eight of its state colleges into four in order to reduce theoverall costs of higher education in the state (Diamond, 2013). Although the mergers at theschools are ongoing and we do not yet know the total impacts, one of the newly created unions,Georgia Regents University, a merger between Augusta State University and Georgia HealthSciences University, has reported a 10 percent decline in the administrative costs (Jones, 2014).Increasing enrollment is another way that some universities are using as a way of creatinga critical mass. According to the National Center for Education Statistics (NCES), enrollmentincreased 24 percent between 2000 and 2012 for degree granting institutions nationally (U.S.Department of Education, 2015). This trend is expected to continue with the total number of13
college enrollments estimated to be 20,186,000 by the year 2023 (U.S. Department of Education,2015). Virginia Tech has the opportunity to use this increase to maintain a critical mass ofstudents. In the June 2015, Board of Visitors meeting, it was announced that Virginia Tech willhave an additional 500 freshman entering in Fall 2015, with a possible growth to 29,000 totalundergraduate students by 2022 (Sands, Smith & Dean, 2015). This increase in students cancontribute to the economies of scale that can lower the cost of attending the university, however,maintaining the quality of service will remain an important issue with increased enrollments. Inaddition, state funding will also need to increase to meet the growing student population.Figure 6Total Undergraduate Enrollment for 4-Year 06,000,0004,000,0002,000,0000Source: U.S. Department of Education, 201514
Partnerships/CollaborationsColleges and universities seeking to find new methods of funding have begun to form avariety of partnerships. These partnerships, with other universities, corporations, and nonprofits,have not only allowed for shared risks and expenses, but also created opportunities in the fieldsof research and education. They allow universities the opportunity to leverage their assets inways that would be impossible for them to do alone.In the creation of partnerships, the important question that needs to be addressed iswhether or not the partnership offers something to Virginia Tech that it cannot create on its own.Virginia Tech has its own funding, tax breaks, etc. As a result, partnerships should be created notas an alternative source of funding, but instead looked at as a value adding activity. It is criticalthat the university is careful in the partnerships it enters into. Examples of partnerships atVirginia Tech include the Virginia Tech Wake Forest University School of BiomedicalEngineering and Sciences, Virginia Tech Carilion School of Medicine and Research Institute,and the Virginia-Maryland College of Veterinary Medicine.The Virginia Tech Carilion School of Medicine and Research Institute (VTC) is anexample of a partnership that used innovation in its creation, execution and funding. Created in2007 as a public-private partnership between the university and Carilion Clinic, the new medicalschool seeks to leverage the basic science and research conducted at Virginia Tech and merge itwith the medical skills of the clinicians at Carilion Clinic as a way of training doctors who willbe both research and patient focused when they graduate (About VTC, 2015). In addition, thetwo entities, Virginia Tech and Carilion, share resources such as academic infrastructure,experiences medical and research staff, and operational funding (Steger & Murphy, 2008).15
Another trend is the partnership of universities with corporations in order to create newinfrastructure. One example of this is at Drexel University in Philadelphia where the universityhas embarked on partnerships with developers to provide student housing and retail space. Theydid this by renting land to private developers and paying nothing in terms of construction costs.In addition, Drexel forged a partnership with Barnes and Noble for the upgrade and operation ofthe university bookstore (Tucker, Campbell, & Lin, 2015).Another example is the North End Center, where Virginia Tech partnered with theVirginia Tech Foundation and local developer Bob Peck in order to purchase the site that“includes a 141,000-gross-square-feet building of mixed-use office and retail space and an 800space parking garage. The first floor of North End Center is leased for retail and restaurant space.The university leases the remaining floors from the Virginia Tech Foundation” (Virginia Tech,2015). This unique situation, where Virginia Tech partners with itself (the Virginia TechFoundation) can create possibilities for funding for projects that would otherwise be costprohibitive. Other examples where the university has partnered with the Virginia TechFoundation include The Hotel Roanoke and Conference Center, the Corporate Research Center,Kentland Farm, and the Washington-Alexandria Architecture Center.Intellectual Property, Startups, and EntrepreneurshipIn 1980, the Bayh-Dole Act (PL 96-517) allowed for inventions created as a result offederal funding to be patented by colleges and universities and gave these institutions that abilityto license these innovations. The proceeds from these activities were shared by the inventors andthe universities at which the research was conducted. As a result of this law and continuedinnovations, many universities began to focus on the possibility of creating revenue streams as aresult of intellectual property.16
Technology licensing, venture capital, corporate and public-private partnerships mayoffer new avenues for funded research. Technology transfers offer universities the ability tocapitalize on research that is paid for by federal funds and conducted by faculty members(Hollingsworth, 1999). For example, MIT is seeking to increase revenue by fostering anenvironment for “inventors as they seek to translate their fundamental discoveries intoproduction-ready products” (MIT, 2014). In addition to helping inventors with the patentprocess, MIT also plays a fundamental role in helping researchers who wish to create start-upcompanies as a result of their research (Fisher, 1998). The technology incubator at NorthCarolina State University similarly helps match talented entrepreneurs and researchers with startup capital to market their ideas (Higher Education Works, 2015). Additionally, StanfordUniversity started its Office of Technology Licensing in 1970 and has remained on the forefrontof the process by working as a marketing, rather than a legal office, staffed by employees whounderstand the technology that has been created (Fisher, 1998).The creation of labs that are sponsored, either fully or partially, by corporations is anotherway in which universities can limit costs while still creating innovative programs. Examples ofthis include the MIT Media Lab which offers corporations the opportunity to sponsor eitherparticular labs or specific projects (MIT Media Lab, 2015). MIT offers a variety of sponsorshiplevels that include “access to all of the research conducted at the Lab, Lab-wide visitingprivileges,” “non-exclusive, license-fee-free, royalty-free licensing rights for IP,” the ability tosponsor graduate fellows, or even have an employee in residence (MIT Media Lab, 2015).Universities seem to be moving away from the push for intellectual property because thechances of this being successful is a gamble. A culture of entrepreneurship is important for17
recruiting of students and faculty, and intensifying innovation. However, innovation andtechnology licensing should not be looked at as a primary new funding source.ConclusionHigher education funding sources are changing, and this research suggests that they willcontinue to evolve in the next generation. This paper provides a broad overview of currentfunding trends in the areas of federal and state funding, endowments growth, tuition and fees,and partnerships, as well as other areas of consideration. In addition to this paper, graduatestudents assigned to this thematic area will provide supplemental research to the working groupas we move forward in the visioning process. Suggested ideas include innovation districts,capital projects, student debt, and affordability and accessibility.18
ReferencesAbout VTC. (2015, July 29). Retrieved from Virginia Tech Carilion School of Medicine andResearch Institute: http://www.vtc.vt.edu/about/index.htmlBritt, R. (2011, July). Academic research and development expenditures: Fiscal year 2009.Retrieved from National Science pdf/nsf11313.pdfChaotar, K. J. (2006). Strategic finance: Planning and budgeting for boards, chief executives, andfinance officers. Washington, DC: Association of Governing Boards of Universities andColleges.The Chronicle of Higher Education. (2014). Fund raising: College and university endowments,2013-2014. Retrieved from eand/151417/The Chronicle of Higher Education. (2013). 2013 AAUP faculty salary survey. Retrieved -2013/138309#id 233921Diamond, L. (2013, January 8). Historic vote merges eight Georgia colleges into four. Retrievedfrom Atlanta Journal-Constitution: al-ok-to-merge-georgia-colleges/nTqH4/Fisher, L. M. (1998). The innovation incubator: Technology transfer at StanfordUniversity. Retrieved from: http://www.strategy-business.com/article/13494?gko e8e48Higher Education Works. (2015). University spinoffs turn research into revenue. Retrievedfrom y-spinoffs-turn-research-intorevenue19
McBain, L. (2009, July). College and university mergers: Recent trends. Retrieved fromAmerican Association of State Colleges and ons/PM-CollegeUniversityMergers.pdfMcDonald, M., and Streib, L. (2015, January 29). University of Texas endowment tops 25billion, passing Yale. Retrieved from lion-surpassing-yaleMIT Media Lab. (2015). Retrieved from Massachusetts Institute of Technology:https://www.media.mit.edu/MIT. (2014). Strategic Education Initiatives. Retrieved from MIT Office of Digital c-education-initiativesNational Association of College and University Business Officers. (2015, February). U.S. andCanadian institutions listed by fiscal year (FY) 2014 endowment market value andchange* in endowment market value from FY2013 to FY2014. Retrieved from PublicNCSE les/2014 Endowment Market ValuesRevised2.27.15.pdfSands, T., Smith, K., & Dean, W. (2015, May 31). Planning for Undergraduate EnrollmentGrowth. Retrieved from Virginia Tech Board of Visitors tes/Information Session 05-31-15.pdf20
Salmi, J. (2009). The challenge of establishing a world class university. The World Bank.Retrieved from 70-1237305262556/WCU.pdfSouthern Regional Education Board. (2000). Tuition and required fees, public colleges, bycollege 1985-86 [Data file]. Retrieved fromSREB: State Council for Higher Education in Virginia. (2014). 2014-2015 tuition and fees at Virginia’sstate-supported colleges and universities. Retrieved from /2014-15TFReport.pdfState Council for Higher Education in Virginia. (2015). TF03: Full-time resident undergraduatestudent charges. Retrieved from SCHEV:http://research.schev.edu/tuitionfees/tfrb resund report.aspSteger, C.W. & Murphy, E. (2008) Virginia Tech-Carilion School of Medicine and ResearchInstitute. Retrieved from Virginia ucker, J., Campbell, J., & Lin, I. (2015, June). Power partnerships. Business Officer, pp. 45-51.United States Department of Labor. Bureau of Labor Statistics. (2015). CPI inflation calculator.Retrieved from http://www.bls.gov/data/inflation calculator.htmU.S. Department of Education. (2015). National Center for Education Statistic
This means that tuition and fees, as well as student debt, are steadily increasing. In-state tuition and fees at Virginia Tech were 2,019 for the 1985-1986 academic year (SREB, 2000). If tuition General Fund 18% Tuition and Fees 32% All Other Income 2% E&G Sales and Service 1% Federal Funds 1% Auxiliary Fees, Sales, and Services 22% Financial