Transcription
This detailed report on the financial performance of theCGIAR Consortium Member Centers in 2014 is based ontheir audited financial statements.CGIAR Financial ReportFor Year2014Prepared by: The CGIAR Consortium Office & the CGIAR Fund Office
1 CGIAR Financial Report For Year 20145 1. FINANCIAL HIGHLIGHTS6 2. ACCOUNTING STANDARDS AND AUDIT3. FINANCIAL OUTCOME7 4. THE CGIAR FUND AND DONOR CONTRIBUTIONS5. THE 2014 FINANCE PLAN AND DISBURSEMENT OF8 WINDOWS 1 AND 2 FUNDS6. CGIAR RESEARCH PROGRAMS’ FINANCIAL11 SUMMARY7. CENTERS’ FINANCIAL SUMMARYCONTENT3 EXECUTIVE SUMMARY23 8. COLLECTION OF COST-SHARING PERCENTAGE (CSP)24 9. CGIAR RESULTS31 10. CENTERS’ FINANCIAL PERFORMANCE INDICATORS
CGIAR Financial Report For Year 2014 2Executive SummaryCGIAR is the world’s leading research partnership on sustainable cropand animal agriculture, forestry and fisheries, with annual turnover ofUS 1 billion and over 10,000 staff in 96 countries. CGIAR members,countries, private foundations, and regional and internationalorganizations contribute financing, technical support, and strategicdirection.The CGIAR system saw some growth in 2014 eventhough contributions through Windows 1 and 2 ofthe CGIAR Fund were lower than the financingplan projections. A new Strategy and ResultsFramework (SRF) was developed, with significantstakeholder engagement and input1. Donorscontributing to the CGIAR Fund may designatetheir resources to one or more of three fundingwindows:Contributions to Window 1 are receivedfrom donors without restriction. The FundCouncil sets priorities and decides howWindow 1 Funds should be employed,mainly through Funding of CRPs and theoperational costs of system entities.Contributions to Window 2 are designatedby CGIAR Fund donors to specific CRPs.Prior to disbursement of these resources tothe CRP Lead Centers, the cost sharingpercentage (CSP) of 2% is deducted tocontribute towards financing system costs.Window 3 contributions are allocated tospecific Centers by Donors. Centers receivethe funds net of the 2% CSP.In addition, donors also continue to contributebilateral funding directly to centers. The proportion1of contributions through the fund has increasedfrom 48% in 2013 to 59% in 2014.Whilst 2013 was a period of consolidation, 2014 hasbeen a turbulent year for the system, marked bythe following significant events:Following the trend of previous years wherean average growth rate of 13% had beenachieved, in late 2013 the finance planpredicted 10% growth in W1-2 contributionsinto the fund. However, when contributionswith donors were confirmed in August andSeptember of 2014, it became apparentthat rather than the anticipated increase of10%, there would be an overall 15%decrease in contributions available for theCRPs compared to 2013 i.e. from 362million in 2013 to 315 million in 2014. Thisannouncement was shared with theCenters in the last quarter of 2014, too latefor significant savings to be made in thecurrent year. It is anticipated that theimpact will show in 2015 as Centers haverevised their plans to accommodate theanticipated cuts in Window 1-2 funding.Nonetheless, overall funding for the CGIAR(i.e. through W1, W2, W3 and bilateral)increased by 7% relative to 2013.The CGIAR Fund Council has endorsed the SRF for review and approval by the Funders Forum.
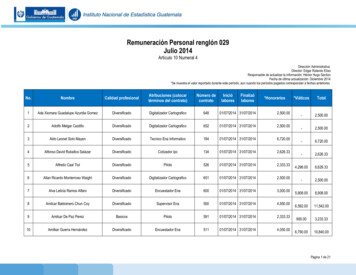
13 CGIAR Financial Report For Year 2014Financial HighlightsDuring the five years from 2008 to 2013, CGIAR sustained an averageannual growth rate of 13%, depicted in Figure 1 below, and achieved 1 billion in revenue in 2013. Total revenue growth for 2014, relative to2013, was 71 million, driven by an increase in revenue from theCGIAR Fund of 137 million (from 483 million in 2013 to 620 million in2014), or 28%. A further analysis of the CGIAR Fund growth indicatesthat 98 million was through Window3. There was a correspondingdecline in bilateral revenue of 66 million from 503 million in 2013 to 437 million in 2014, indicating that there is a continuing migration offunding from bilateral into the CGIAR Fund.Figure 1: Evolution of funding (excluding Center own income) 67371360020102011201220132014
2CGIAR Financial Report For Year 2014 4Accounting Standardsand AuditExternally audited financial statements from each Centerform the basis for this financial report. They were reviewedand aggregated according to fiduciary management andreporting standards approved by CGIAR to guide theCenters in these areas. In conformity with GenerallyBox 1: Compliance with financial guidelinesTo ensure transparency and consistency in financial practices and the presentation of financial information, the 15 CGIARCenters are required to follow financial guidelines approved by the Consortium Board. These are developed by the Consortium, with input from Center finance professionals and external experts.A group of Center finance and internal audit professionals annually conduct a peer review of the Centers’ externally auditedfinancial statements to assess their compliance with CGIAR accounting policies and reporting guidelines, as well as to validatethe analysis underpinning the CGIAR financial report. The 2014 peer review will be completed in June 2015. In the past, allCenter financial statements were pronounced satisfactory from this peer group, meaning full acceptability. Furthermore, eachCenter and the Consortium Office received an unqualified audit opinion from its external auditors in CRISATIFPRIIITAILRIIRRIIWMIWorld AgroforestryWorldFishConsortium OfficeBox 2: Center auditorsCenter Auditors2013KPMGPricewaterhouseCoopersErnst & YoungPricewaterhouseCoopersKPMGErnst & YoungErnst & cewaterhouseCoopersGrant useCoopersErnst & YoungPricewaterhouseCoopersKPMGErnst & YoungErnst & cewaterhouseCoopersGrant ed on the accrual basis.To ensure that Center ARFinancial Guideline No. 2 statesthat accounting policies andreporting practices will beupdated to bring them intocompliance with InternationalFinancial Reporting Standards(IFRS). Additional information onfinancial compliance is in Box 1and Box 2 shows the Centers’external auditors for the yearsended 31st December 2013 and2014, respectively.
5 CGIAR Financial Report For Year 20143Financial OutcomeSystem revenues in 2014 amounted to 1,080 million(including 23 million of Center own income), anincrease of 73 million, or 7%, over the 1,007 millionrecorded in 2013. Table 1 sets out total revenues andexpenditures for 2014 compared to 2013.Table 1: Total revenues and expenditures, 2014 compared to 2013 ( million)2RevenueCGIAR Fund Windows 1&2CGIAR Fund Window 32014TotalCRPsBilateralSub-total fundingCenter own incomeTotal revenueExpenditureCRPsOther programsSystems entities and special initiativesTotal s in 2014 were 1,067 million, anincrease of 83 million, or 8%, over 2013expenditures of 984 million. The net result was asurplus of 13 million, equivalent to 1% of revenue.3Three Centers finished the year with a deficit, twowith balanced budgets and one held unrestrictedincome that has been designated by their Centerboard, and will be fully spent by the end of 2015.The remaining seven Centers generated ,080Net 8516201from other income and/or unrestricted grants, andtwo from a combination of other income andrecovery of indirect costs.Figure 2 demonstrates the changing modalities offunding, illustrating the impetus given by thecontribution of the CGIAR Fund to overall incomegrowth.2Table 1 is a summary of all revenues and expenses in the CGIAR, and includes figures for systems offices, specialinitiatives and other partner programs, which are not part of the Center summaries.3The surplus as a percentage of revenue excludes CGIAR collaboration costs. Other revenue is Center-generatedincome, such as from interest, guesthouse revenue and sales of farm production. It does not include unrestrictedgrants, which are included under non-CRP revenue.
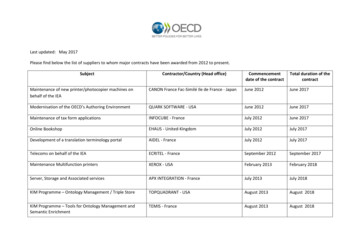
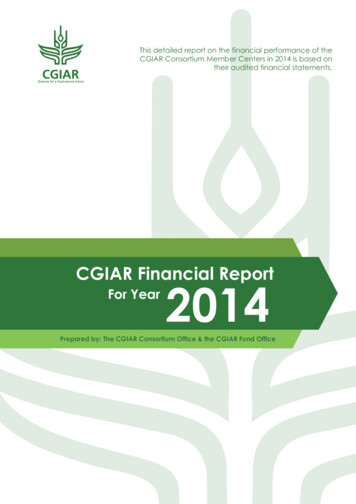
CGIAR Financial Report For Year 2014 6Figure 2: Analysis of Revenue by Source of Funding ( 552446020112012201320144002000Bilateral and otherCGIAR Fund W3CGIAR Fund W1-2Donors can contribute either throughthe CGIAR Fund or through bilateralgrants made directly to Centers.Figure 2 is based on informationprovided in the financial statementsof the Centers, which show theexpenditure rate (i.e. revenue isrecognized to the extent that serviceis provided or expenses incurred). Theimpactofthereductionincontributions into the CGIAR Fund willonly show in Center results in 2015.CRPs were able to maintain anincrease in W1-2 spending in 2014 bysupplementing with funds carriedforward.4The CGIAR Fundand DonorContributionsThe statements of the 15 Centers were preparedon the accrual basis of accounting. Hence, therevenues reported therein are only the earnedportion of funding based on revenue recognition,which, in the CGIAR context, means money spent.This is the case for Tables 1, 7, 8 and 11. The CGIARFund, however, reports funding based on cashreceipts and disbursements, as the CGIAR Fund isnot an implementing agent of CGIAR. Therefore,Tables 2, 3, 4 and 5 do not match the tablesreferred to above.CGIAR Fund receipts, disbursements and balancesIn 2014, contributions to the CGIAR Fund were 551million ( 555 million including contributions inprocess), 97 million less than in 2013 (15%reduction), mainly due to one-time contributionsmade by some donors in 2013 which were notrepeated in 2014. Window 1 and 2 combined4make up 54% of total CGIAR Fund income for 2014,and Window 3 the remaining 46%.As of December 31, 2014, nearly all (99%) of theCGIAR Fund contributions were received, andcontributions to Windows 1 and 2 have beencollected in full, enabling the disbursement of thebudget requirements for 2014 before the end ofthe year.Figure 3 illustrates how the quality of projectionsimproved from 2013 to 2014. In 2014, the followingdonors had made multiyear commitments to theCGIAR Fund: Australia, Belgium, Bill & MelindaGates Foundation, Denmark, IFAD, Luxembourg,the Netherlands, New Zealand, Russia, SouthAfrica, Sweden, Switzerland, and the UnitedKingdom.Including Center own income, which is aggregated with bilateral.
7 CGIAR Financial Report For Year 2014Figure 3: CGIAR Fund projections, 2014 and 2013 ( million)2014700568 587 554531 531 553527520519487 492 50574 450079600400300452 480200600500551402632 637672 652554 559140427512124 981303753002001001000-Confirmed516 514 514 517400233Received2013700321ReceivedProjected 2014In 2014 the CGIAR Fund received a total of 674million, of which 123 million was collection of prioryears’ contribution. 875 million was madeavailable for distribution during the year of which 811 million was disbursed, leaving a balance ofConfirmed351Projected 2013 64 million remaining in the CGIAR Fund at theend of 2014, of which 32 million was in Windows1-2, 22 million in Window 3 and 10 million wasprovisional (i.e., the donor has not decided on thefinal allocation).Figure 4: CGIAR Fund inflows, disbursements and balance, 2014 ( million)Balance in the CGIAR Fund in 2014250.0in US 6601449864Dec-13 Jan-14 Feb-14 Mar-14 Apr-14 May-14 Jun-14 Jul-14 Aug-14 Sep-14 Oct-14 Nov-14 Dec-14InflowsDisbursementsOf the 811 million disbursed by the CGIAR Fund in2014, 469.8 million was received throughWindows 1 and 2, of which 120.3 million relatedto 2013 activities that had been pre-financed byCenters. The remainder of 349.5 million was usedto fund 2014 CRP activities and system costs andspecial initiatives.Tables 2 to 4 show the status of the CGIAR FundFund Balance(statement of receipts, disbursements and fundbalances) as of the end of December 31, 2014;donor contributions received by the CGIAR Fundby window; and a breakdown of Window 2contributions by donor and by CRP, respectively.The CGIAR Fund windows 1 & 2 being acomingled fund, the disbursements are shown inTable 5, by activity and program. Window 3however is Center specific contributions, hencedisbursements are broken down by Center.
CGIAR Financial Report For Year 2014 8Table 2: CGIAR Fund statement of receipts, disbursements and fund balance, end of 20145 ( million)Window 1Window 2Window 3ProvisionalTotalBalance b/f from 2013ReceiptsPrior years contributions received in 20142014 Contributions received in 2014 Total available in 2014314.6181.0353.725.3875TransfersCost Sharing PercentageTransfer from ProvisionalLess: DisbursementsFund BalanceContributions in process .8(15.6)0.0 10811644see Table 3This table and other tables in this section show the cash movement in and out of the CGIAR Fund. The overall resultsreported in Table 1 are based on accrual accounting, as stated in Section 2, and are therefore not comparable.5
9 CGIAR Financial Report For Year 2014Table 3: Donor contributions to the CGIAR Fund, 2014 ( ill & Melinda Gates FoundationCanadaChinaDenmarkEuropean uxembourgMoroccoNetherlandsNew ZealandNorwayPortugalRussiaSouth AfricaSwedenSwitzerlandThailandTurkeyUnited KingdomUSAWorld BankSub-total 2014 receiptsContributions in process AIranMoroccoNetherlandsSudansub-total contributions in processTotal 2014 contributionsWindow 1Window 2Window .01.90.549555AContributions which are supported by signed contribution agreement but the money was not yet received by Dec 31,2014 Contributions which are supported by signed contribution agreement but the money was not yet received byDec 31, 2014
Total0.10.1149Confirmed in processSudansub-totalTOTAL2014 Contributions nland1.3Ireland2.7Japan0.1Netherlands30.0New Zealand4.3Russia0.5South Africa0.1Switzerland10.9United Kingdom7.8USAID30.2sub-total1112013 Contributions received in 15-4.0114.31.70.60.84.04Livestock andFishTable 4: Contributions to Window 2 of the CGIAR Fund by donor and CRP, 2014 ( WLE221.60.0-GenebanksCGIAR Financial Report For Year 2014 10
11 CGIAR Financial Report For Year 2014Table 5: Disbursements from the CGIAR Fund, end 2014 ( million)Windows 1 & 2 (by Program)CRP 1.1CRP 1.2CRP 1.3CRP 2CRP 3.1CRP 3.2CRP 3.3CRP 3.4CRP 3.5CRP 3.6CRP 3.7CRP 4CRP 5CRP 6CRP 7Dryland SystemsHumidtropicsAquatic Agricultural SystemsPolicies, Institutions and MarketsWHEATMAIZERice (GRiSP)Root, Tubers and BananasGrain LegumesDrylands CerealsLivestock and FishAgriculture for Nutrition and HealthWater, Land and EcosystemsForests, Trees and AgroforestryClimate Change, Agriculture and Food SecurityGenebanksSystems entities and special 320.29.520.323.845.733.656.131.019.5470Window 3 DAICRISATIFPRIIITAILRIIRRIIWMIWorld 37.817.151.249.220.430.05.119.413.1341Total811
5CGIAR Financial Report For Year 2014 12The 2014 FinancePlan andDisbursement ofWindows 1 and2 FundsIn 2013, to give the system stability and to facilitate planning for theCenters, the Consortium put in place a two-year plan (earlierallocations having been done on an annual basis) in an effort toincrease predictability and stability. This plan, with the agreement ofCenters, Consortium and Fund Office, projected continuing 10%annualized growth, based on the strong growth since the inception ofthe reform. However, since this growth did not materialize, a reductionin allocations was announced in October 2014.However, the rate of disbursement has improved, and 2014 is the firstyear in which 99% of the Finance Plan was disbursed before the end ofthe year.Table 6: Finance Plan and cash disbursements, 2014 ( million)2014Final 2014Finance PlanDryland SystemsHumidtropicsAquatic Agricultural Systems BPolicies, Institutions and MarketsBWHEATMAIZERice (GRiSP)Root, Tubers and BananasGrain LegumesDrylands CerealsLivestock and FishAgriculture for Nutrition and HealthWater, Land and EcosystemsForests, Trees and AgroforestryClimate Change, Agriculture and Food SecurityGenebanksSystems entities and special initiativesTotal paid in the 6.727.826.541.418.619.5344.5Other 2014Allocations A0.70.60.60.90.60.70.60.70.21.51.08.02013Total Duefor 2014Paid in 2014for 2013Paid in 2014for 2014Paid in 2015for 2014Final 2013Finance PlanPaid in 2013for 2012Paid in 2013for 2013Paid in 2014for 120.3470284Other allocations are for the ICARDA Investment plan and for Results Based Management pilotsContract limits prevented full disbursement of Finance Plan allocations for AAS (total contract W1/2 37.9m including extension)and WHEAT (total contract W1/2 41.0m)
13 CGIAR Financial Report For Year 2014Figure 5: Actual disbursements versus planned disbursements for 2013 and 2014 ( million)2013 Disbursements2014 0025020015010050-PlanActualFigure 5 above shows significant improvement inthe disbursement rate compared to the FinancingPlan at the end of 2014, compared to that for 2013i.e. a move from 65% to 99%, respectively.PlanActual6Improvement is still needed to achieve quarterlydisbursement rates that are close to plan.CGIAR ResearchPrograms’Financial SummaryCRP expenditure in 2014 totaled 887 million, anincrease of 10% over 2013, and 83% of the totalCGIAR expenditure for the year. Table 7 shows ananalysis of this expenditure. Windows 1 and 2, at 362 million, account for 42% of CRP funding(consistent with 324 million, or 41% in 2013).Window 3 at 182 million, or 21%, shows the mostgrowth over 2013, when Window 3 at 115 millionrepresented 13% of the total. Bilateral, at 338million or 38% of total, has dropped from the 2013total of 362 million, or 45% of total.
CGIAR Financial Report For Year 2014 14Table 7: Summary of CRP Funding, 2014 ( million)From Financial Statements of Individual CentersWindows 1and 2CGIAR Research Program on:CRP 1.1CRP 1.2CRP 1.3CRP 2CRP 3.1CRP 3.2CRP 3.3CRP 3.4CRP 3.5CRP 3.6CRP 3.7CRP 4CRP 5CRP 6CRP 7Window 3BilateralDryland SystemsHumidtropicsAquatic Agricultural SystemsPolicies, Institutions and MarketsWHEATMAIZERice (GRiSP)Root, Tubers and BananasGrain LegumesDrylands CerealsLivestock and FishAgriculture for Nutrition and HealthWater, Land and EcosystemsForests, Trees and AgroforestryClimate Change, Agriculture and Food 362182338Own FundsTotal% of Individual CRP fundingWindows 1Window 3 Bilateraland 2Total(% of � FinancialSummaryTable 8: Center revenue, expenditure and surplus, 2014 ( IPICARDAICRISATIFPRIIITAILRIIRRIIWMIWorld AgroforestryWorldFishSubtotalOther program partnersTotalSystems entities and special (1.1)0.91.00.812.90.012.90.013
15 CGIAR Financial Report For Year 2014CRP revenues total 882 million, andthe expenditure for 2014 was 887million. The difference was fundedthrough Center own income. AnnexTable A2.1 provides supplementaryanalysis of the source of funding byCenter.Figure 6 sets out Center revenue bysource of funding. CIMMYT has thehighest non-CRP revenue havingremoved a number of projects fromtheir CRP activities in 2013. ILRI also hassubstantial non-CRP revenue, which isexplained by the BecA-ILRI Hub that itoperates in Nairobi with BiosciencesEastern and Central Africa.Figure 6: CRP versus non-CRP revenue by Center ( of Cost-SharingPercentage (CSP)The Cost Sharing Percentage (CSP) is a chargelevied on funds to finance CGIAR system entities.The current CSP rate is 2%. The exception forpaying CSP applies to legacy grants signed before13th May 2011. The Trustee deducts the 2% CSPamount from the CGIAR Fund for Windows - 2 and3. The authorization for this is contained in theContribution Agreements entered into with thevarious donors.donors agree for this to be accordingly levied onthe bilateral funds that they contribute. Thereasons ventured by donors that result in full CSPbeing uncollectible are summarized as follows:In the case of bilateral funding, which is sentdirectly to centers, the centers are required toretain the relevant CSP amounts and to accountfor this. The collected amounts are transferred toWindow 1 and are intended to be the bilateraldonors’ share in financing the operations of systementities.Sub-contracts of principal donor grants:Some centers receive funds throughsub-contractors of other organizations, forwhich the principal donor is also a majordirect contributor to the CGIAR Fund. Theprimary contractor refuses to pay CSPcharges over their subcontract to a CGIARcenter even though there is no suchrestriction by the principal donor.A persistent issue relating to CSP is that not allIn spite of the fact that some donors fully payfor CSP charges on W3 funds, their localmissions are not aware of this charge orrefuse to accept that it be charged.
CGIAR Financial Report For Year 2014 16Some Governments reject the notion of CSPcharges.The rate of collection in 2014, compared to that in2013, has improved from 36% to 49%, aided by acombination of increased contributions throughW3, lower contributions through bilateral fundingand improved collection rates. Full collection ofthe CSP on all bilateral grants would generate 8.6million. The potential uncollected CSP has reducedfrom 6.7 million in 2013 to 4.5 million in 2014.The cap of the overhead rate permitted bysome donors is lower than the actualoverhead, rendering it impossible to retainCSP. These caps range from 4% to 15%.Some donors are averse to any overheadcharges.Table 9: CSP recovery by Center, 2014 compared to 2013Bilateral Funding ( ILRIIRRIIWMIWorld AgroforestryWorldFishTotalFunds onwhich CSP 7.65.220.09.7207.72014CSPCollected% over 8%71.5%41.8%65.0%58.8%41.8%60.1%80.2%48.7%% over Fundson which CSPwas 8.529.227.474.035.932.941.213.233.612.1497.5Funds onwhich CSP .15.018.57.5176.92013% over 180.1930.1190.0880.3060.1483.262% over Fundson which CSPwas 0%2.00%1.85%0.91%1.76%1.65%1.96%1.84%Table 10: Analysis of CSP Collection by Center2014(Amounts in IPICARDAICRISATIFPRIIITAILRIIRRIIWMIWorld AgroforestryWorldFishTotalIncludes %61%80%49%Legacy onordoesn'taccept 21%0%0%0%7%3%0%7%6%No overhead/donor overheadcannot cover %18%0%0%42%17%0%13%13%0%10%Non-SRF/CRP Other %0%1%0%4%19%5%0%7%Furtherinformationrequested .832.529.912.433.312.1426.2Legacy : Grants which were signed on or before 13 May 2011Donor doesn't accept : Donor has expressly stated that they will not pay CSPCNo overhead/donor overhead does not cover CSP : Donor has not expressly refused to pay CSP, but the overhead allowed does not cover Centeroverhead and CSPDNon-SRF/CRP : Center indicates that grant is outside of SRF and so not liable to CSPEOther : Sundry reasons such as donations in kind, CSP already accounted for (Challenge Program), consultancy-type incomeFPending information : Further information has been requested from Center, but not received at time of publicationAB
17 CGIAR Financial Report For Year 2014CGIAR ResultsAggregated Center data from 2010 to 2014, shownin Table 11(a) and elaborated below, reflect thefinancial position of the CGIAR system as a whole.9Table 11: Summary of CGIAR revenue and expenditure, 2009-2014 ( million)RevenuesCRP Windows 1 and 2CRP Window 3BilateralTotal CRP revenueNon-CRPWindow 3, restrictedBilateral, restrictedWindow 3 & Bilateral, unrestrictedSystems Entities, Special Initiatives & Other Program PartnersTotal non-CRP Grant RevenueTotal Grant RevenueOther IncomeTotal RevenueExpenditureRestricted CRP ExpenditureRestricted non-CRP ExpenditureUnrestrictedExtraordinary ExpenditureSystems Entities and Special IntiativesTotal ExpenditureResults of 14806143181788213331206577078769841,0663928112213
CGIAR Financial Report For Year 2014 18As well as the revenue and expenditure of theCenters, the CGIAR results include the revenueand expenditure of the systems entities, specialinitiatives and other partner programs. The detailsper entity, for 2014, are depicted in Table 12 below:Table 12: System Entities, Special Initiatives and Other Partner Programs, 2014 ( million)Cashdisbursedfrom FundSystem EntitiesFund Office2.7Consortium al InitiativesSIACA1.2GRAPBOpen AccessSub-total1.2OtherGeneration CPC2.8CP PartnersGlobal Crop Diversity Trust Management CostsSub-total2.8Total CGIAR19.5Revenue RecognitionCRPW1/2Non-CRPTotalW1/2W3 60.817.51.60.30.42.311.33.414.734.5Strengthening Impact Assessment in the CGIARGender Research Action PlanCChallenge ProgrammeABFigure 7: Expenditure by region, haranAfrica52%The distribution of expenditure by region has remained largely consistentwith 2013. Expenditures in sub-Saharan Africa have slightly increased from50% in 2013 to 52% in 2014. Asia has also marginally increased from 25% in2013 to 26% in 2014. Whilst expenditure in Central and West Asia and NorthAfrica (CWANA) has remained stable at 6%, the expenditure in LatinAmerica shows a small decrease from 19% to 16%.
19 CGIAR Financial Report For Year 2014Figure 8: Expenditure by cost category, 2014Personnel Costs7% 4%Supplies and Services39%20%Collaboration andPartnershipsTravel30%DepreciationExpenditure by cost category also remains consistent with the spendingpattern o
1 billion in revenue in 2013. Total revenue growth for 2014, relative to 2013, was 71 million, driven by an increase in revenue from the CGIAR Fund of 137 million (from 483 million in 2013 to 620 million in 2014), or 28%. A further analysis of the CGIAR Fund growth indicates that 98 million was through Window3. There was a corresponding