Transcription
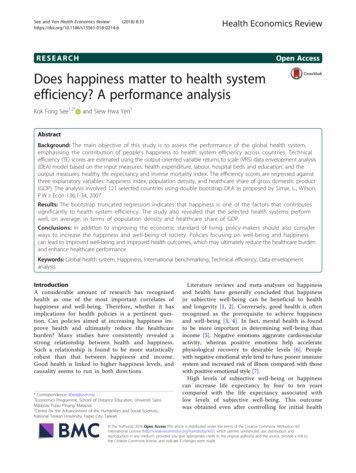
See and Yen Health Economics Review(2018) RCHOpen AccessDoes happiness matter to health systemefficiency? A performance analysisKok Fong See1,2*and Siew Hwa Yen1AbstractBackground: The main objective of this study is to assess the performance of the global health system,emphasising the contribution of people’s happiness to health system efficiency across countries. Technicalefficiency (TE) scores are estimated using the output-oriented variable returns to scale (VRS) data envelopment analysis(DEA) model based on the input measures: health expenditure, labour, hospital beds and education, and theoutput measures: healthy life expectancy and inverse mortality index. The efficiency scores are regressed againstthree explanatory variables: happiness index, population density, and healthcare share of gross domestic product(GDP). The analysis involved 121 selected countries using double bootstrap DEA as proposed by Simar, L., Wilson,P.W J Econ 136:1‑34, 2007.Results: The bootstrap truncated regression indicates that happiness is one of the factors that contributessignificantly to health system efficiency. The study also revealed that the selected health systems performwell, on average, in terms of population density and healthcare share of GDP.Conclusions: In addition to improving the economic standard of living, policy-makers should also considerways to increase the happiness and well-being of society. Policies focusing on well-being and happinesscan lead to improved well-being and improved health outcomes, which may ultimately reduce the healthcare burdenand enhance healthcare performance.Keywords: Global health system, Happiness, International benchmarking, Technical efficiency, Data envelopmentanalysisIntroductionA considerable amount of research has recognisedhealth as one of the most important correlates ofhappiness and well-being. Therefore, whether it hasimplications for health policies is a pertinent question. Can policies aimed at increasing happiness improve health and ultimately reduce the healthcareburden? Many studies have consistently revealed astrong relationship between health and happiness.Such a relationship is found to be more statisticallyrobust than that between happiness and income.Good health is linked to higher happiness levels, andcausality seems to run in both directions.* Correspondence: kfsee@usm.my1Economics Programme, School of Distance Education, Universiti SainsMalaysia, Pulau Pinang, Malaysia2Centre for the Advancement of the Humanities and Social Sciences,National Taiwan University, Taipei City, TaiwanLiterature reviews and meta-analyses on happinessand health have generally concluded that happinessor subjective well-being can be beneficial to healthand longevity [1, 2]. Conversely, good health is oftenrecognised as the prerequisite to achieve happinessand well-being [3, 4]. In fact, mental health is foundto be more important in determining well-being thanincome [5]. Negative emotions aggravate cardiovascularactivity, whereas positive emotions help acceleratephysiological recovery to desirable levels [6]. Peoplewith negative emotional style tend to have poorer immunesystem and increased risk of illness compared with thosewith positive emotional style [7].High levels of subjective well-being or happinesscan increase life expectancy by four to ten yearscompared with the life expectancy associated withlow levels of subjective well-being. This outcomewas obtained even after controlling for initial health The Author(s). 2018 Open Access This article is distributed under the terms of the Creative Commons Attribution 4.0International License (http://creativecommons.org/licenses/by/4.0/), which permits unrestricted use, distribution, andreproduction in any medium, provided you give appropriate credit to the original author(s) and the source, provide a link tothe Creative Commons license, and indicate if changes were made.
See and Yen Health Economics Review(2018) 8:33conditions such as depression, anxiety, coronaryheart disease and cancer [8]. Chida and Steptoe [9]showed a significant reduction of all-cause mortalityamong people with higher levels of well-being. Conversely, low levels of happiness might cause some peopleto engage in activities that are known to affect theirhealth adversely, such as smoking, drinking, beingdependent on drugs or being physically inactive [10, 11].Bhutan, as the first country in the world to pursuehappiness as a state policy, recognises health as oneof the most important means to achieving gross national happiness [12]. However, so far, there is nostudy that specifically addresses the association ofpeople’s happiness with the nation’s health systemperformance. Happiness index is a comprehensive indicator that reflects the quality of the society andshould not be ignored.1 As proven in many studiesgood health promotes higher levels of happiness andhappiness promotes better health. Improved well-being and improved health outcomes may ultimatelyimproved well-being and improved health outcomesmay ultimately lead to reduction in the healthcareburden and improved healthcare performance.The main objective of this study is to assess theperformance of global health system using doublebootstrap data envelopment analysis (DEA) approach. This study emphasises the contribution ofpeople’s happiness and well-being on health systemperformance across 121 countries. Health systemtechnical efficiency scores will be generated for eachcountries using DEA model based on relevant inputand output measures. The efficiency scores will thenbe regressed against a set of explanatory variablesthat includes happiness index, population densityand healthcare share of gross domestic product(GDP). In general, meta-analyses of the scientific literature have concluded that subjective well-beingcan be beneficial to health and longevity [1]. Betterhealth outcomes could lessen healthcare costs andeventually improved the performance. Therefore,happiness index could be one of the environmentalfactors which will be relevant in explaining the variation in global health system performance.Several empirical efficiency studies related to thehealth system are discussed in Section 2. Section 3briefly describes the double bootstrap DEA modeland the variable selected in the study. The researchfindings are highlighted in Section 4. A brief conclusion is given in Section 5.Insights from health system efficiency studiesMost of the empirical studies on health system efficiency and performance involved the analysis of datafrom individual countries. Most of these studies werePage 2 of 10carried out in developed countries, for instance, somerecent studies in Canada by Allin et al. [13], Spainby Carrillo and Jorge [14] and Greece by Mitropoulos et al. [15]. However, such studies may not be appropriate when there is an insufficient number ofsimilar health service providers available within acountry, especially for developing countries. To assess overall health system performance and makecomparisons across countries, a global health systembenchmarking study may be essential. Undoubtedly,the potential benefits of international benchmarking,such as improving the validity of analysis, largelyoutweigh the costs.A summary of previous efficiency studies on healthsystem performance is provided in Table A1 (Please referto Additional file 1: Appendix A). As shown in Table A1,two main approaches used in the analysis are DEA andstochastic frontier analysis (SFA), which involved numerous combinations of input variables. Most health systemperformance studies focused on Organisation forEconomic Co-operation and Development (OECD)countries, and only a few covered global perspectives,partly because more comprehensive healthcare data arereported in the OECD countries and made accessible tothe public. Performance studies of the health systemamong the OECD countries include the works of de Cosand Moral-Benito [16], Hadad et al. [17], Wranik [18],Afonso and Aubyn [19], Spinks and Hollingsworth [20],Afonso and Aubyn [21], Bhat [22] Osterkamp [23],Retzlaff-Roberts et al. [24] and Puig-Junoy[25].Hadad et al. [17], for instance, employed an output-oriented DEA approach to examine the healthsystem efficiency of 31 OECD countries in 2007. Theinput variables were defined as fruit and vegetableconsumption, health spending, hospital beds, incomeand physicians, whereas infant mortality and lifeexpectancy were defined as the output measures. Fatintake, public health expenditure, unemployment,income inequality, environmental health score, organisational arrangements, public health objectives, gatekeeping, and performance-related payment incentiveswere included in the second-stage analysis. The outcomes of that study met prior expectations and provided further support for the hypothesis that allconditional variables are significant for health systemefficiency.A similar study was performed by Afonso andAubyn [19] to examine health system efficiency andidentify factors that affect performance. Their studyused panel data from 2001 to 2002 to benchmarkthe performance of the health systems in 21 OECDcountries. The inputs for the model were hospitalbeds, MRI, physicians and nurses, while the outputswere infant mortality, life expectancy and potential
See and Yen Health Economics Review(2018) 8:33years of life lost. The environmental factors adoptedby the authors included income, education, obesity,and tobacco consumption. By using the algorithm #1double bootstrap DEA approach, the authors foundthat all selected explanatory variables were significantly correlated with health system performance.Notably, although algorithm #1 is a valid procedure,some inconsistencies in the analysis could arise ifstrong parametric assumptions were made in onestep of the analysis but avoided in others.Over the last decade, several efficiency studies havealso been conducted to examine the global health system, including Sinimole [26], Ogloblin [27], Greene [28,29], Kumbhakar [30], Grosskopf et al. [31], andHollingsworth and Wildman [32], that measured theperformance of the global health system based on WorldHealth Organisation (WHO) data. For instance, Ogloblin[27] examined the effects of income, income inequality,and health expenditure on the health system efficiencyof 78 countries based on pooled data in 2000, 2003 and2007. SFA was used in the analysis, with the outputmeasure defined as health-adjusted life expectancy. Theinput measures involved in their analysis were health expenditure, education, tobacco consumption and alcoholconsumption. The results indicated that income as wellas public and private health expenditures were positivelyrelated to health system efficiency, whereas income inequality seemed to have an adverse effect.A similar study from the global perspective was carriedout by Kumbhakar [30] based on data from 180 nationsbetween 1993 and 1997. That study used an SFA approachto benchmark the performance of those 180 healthsystems. Health expenditure and education levels wereused as the input measures and disability-adjusted lifeexpectancy as the output measure in that study. Severalexplanatory variables, including income inequality, democratisation and freedom index, government effectiveness,tropical location, population density, income, and OECDmembership, were hypothesised to affect health systemperformance. The findings indicated that income, incomeinequality, government effectiveness and population density were significantly correlated with health system performance. Overall, as indicated in Table A1 (Additionalfile 1: Appendix A), health expenditure and educationlevels were commonly chosen as the input measures,while life expectancy and infant mortality as the outputmeasures.MethodsThe task of measuring healthcare performance can becarried out by using these two main techniques, whichare, SFA and DEA. The SFA model applies an econometric method that involves a functional form to estimateefficiency. On the other hand, DEA which is a frontierPage 3 of 10method uses linear programming technique to determine relative efficiency of each decision making unit(DMU) within a set of homogeneous DMUs. A standardDEA model measures efficiency as the ratio of the sumof its weighted outputs to the sum of its weighted inputs. It is particularly useful in handling efficiency analysis for public utilities and public organisations such ashealthcare facilities which are not profit oriented andemploy a multiple input-multiple output productionfunction. Based on previous published studies, DEAmodel has been proven to be effective in identifying thebest practice in a sample by constructing a piece-wiselinear production frontier.Standard DEA modelDEA model can be specified using either an input oroutput oriented approach. This study adopts theoutput-oriented variable returns to scale (VRS) DEAmodel to measure technical efficiency (TE) scores.Assuming that data on K inputs and M outputs areavailable for N countries' health systems involved inthe study. The notation X represents the K Nmatrix of inputs, consisting of K inputs from Ncountries, while Y represents the M N matrix ofoutputs, consisting of M outputs from N countries.The output-oriented VRS DEA model is commonlypresented in the envelopment form as below:The output-oriented VRS modelMax θ;λ θ;Subject to :‐θyi þ Yλ 0;xi‐Xλ 0;N1’ λ ¼ 1λ 0ð1Þθ and λ denote a scalar and an N 1 vector ofweights respectively. The value of θ ranges from oneto infinity, and θ 1 is the proportional output expansions, which can be attained by the ith country,given the input level. See Ozcan [33] for more details on the DEA methodology in healthcare studies.Double bootstrap DEA approachIn many DEA literature, Tobit regression is beingemployed to account for the effects of explanatory variables on the technical efficiency. In the first stage, thetechnical efficiency scores are estimated through DEAmodel and the scores will then be regressed against a setof explanatory variables as follows:θm ¼ a þ βzm þ εmð2Þwhere θm is the technical efficiency score, zm is the vectorof variables that influences the technical efficiency of
See and Yen Health Economics Review(2018) 8:33health system, β is a vector of the parameters to beestimated, and εm is an error term where the value ofεm is greater than or equal to the sum of 1 a βzm.The second stage of analysis offers useful informationto enhance the operating environment for health system and design better incentive schemes for internalimprovement. However, Simar and Wilson [34] foundthat the DEA results are greatly dependent on eachother and therefore, using them in the second stageregression is inappropriate as it would violate thebasic assumption of regression models.Simar and Wilson [34] demonstrated that the doublebootstrap DEA approach can be a better choice.2 Thus,in this study, the double bootstrap DEA approach isemployed to analyse the determinants of global healthsystem performance. Algorithm #2 as suggested bySimar and Wilson [34] used in the study is as follows: m ÞStep 1: Compute the technical efficiency scores ðθusing DEA model.Step 2: Regress the technical efficiency scores onzm using truncated regression to obtain the parameter σ ε Þ by the maximum likelihood.estimates ðβ;Step 3: Repeat the following steps: 3.1–3.4 by B1 timesto obtain a set of bootstrap estimates: ε Þ,3.1 Draw ε m from a normal distribution, Nð0; σ with a left truncation at ð1 βzm Þ for all m 1, ,M; m þ ε for all m 1, ,M;3.2 Calculate θ m ¼ βzm m θ )3.3 Generate pseudo data (x m ¼ xm , y m ¼ y m θmto form the reference bootstrap for all m 1, ,M; and3.4 Calculate the bootstrap estimate technical Þ using pseudo data whereefficiency scores ðθmX and Y are replaced by X ¼ ½x 1 x m and Y ¼ ½y 1 y m , respectively.b byStep 4: Calculate the bias-corrected estimate, θcomputing the difference between the original estimates and the bootstrap estimator of bias.Step 5: Regress the bias-corrected estimator on zmusing truncated regression to obtain the paramb b Þ by maximum likelihood.σeter estimates ðβ;Step 6: Repeat the following steps: 6.1–6.3 by B2 timesto obtain a set of bootstrap estimates: ε Þ, withσ6.1 Draw ε m from a normal distribution, Nð0; bb a left truncation at ð1 βzm Þ for all m 1, ,M;b m þ ε for all m 1, ,M; and6.2 Calculate θ ¼ βzmm6.3 Regress θ m on zm using truncated regression to b ;b Þ byσobtain the parameter estimates ðβmaximum likelihood.Step 7: Construct confidence intervals and standarderrors from the bootstrap results.Page 4 of 10Selections of input and output measuresMost health system efficiency studies require time-consuming data collection. Obtaining reliable and sufficientdata has always been a challenge. A more comprehensiveand effective study of efficiency should include data overa certain time period. The input and output measuresused in previous studies are summarised in Table A1(Additional file 1). Health expenditures, physicians andhospital beds are commonly selected as inputs, whilelife expectancy and infant mortality are chosen as outputs in most previous studies of health system efficiency(e.g. [17, 24, 35, 36]). To adhere to DEA requirements, theminimum observations should be greater than or equal tothree times the total of input and output variables. Considering the literature survey, this study uses the followinginput measures.Health expendituresThe total health expenditures from government,private and other resources are important to deliverhealthcare services to the nation. The variable ismeasured in million dollar-based PPP in 2011.LabourPhysicians as well as nursing and midwifery personnelare the common health system staff considered in previous studies. Information related to other allied healthprofessions for each country is usually not publicly available. To compare health system performance, the totalnumbers of physicians as well as nursing and midwiferypersonnel are used in this study.Hospital bedsThe total number of hospital beds is used as proxy forhospital size and hospital capital measures. To reflectthe capital measure used in the health system, this analysis uses the number of hospital beds per 1000 people.EducationThe average school age is used as a proxy for the level ofeducation for each country. It is strongly believed thatthe level of education is positively related to the averagelife expectancy. Therefore, education input is used asone of the inputs in the health system.Two outputs, which are, healthy life expectancyand inverse mortality rate, are used in this study.Healthy life expectancyThis measure, also known as disability-free life expectancy,is measured by the number of remaining years that a person of a certain age is still expected to live without disability. Healthy life expectancy is a better measure thatintroduces quality of life, as compared to standard life expectancy, which is exclusively centred on the length of life.
See and Yen Health Economics Review(2018) 8:33Inverse mortality indexMortality per 1000 live births is a measure of the number of deaths in a particular population. Three types ofmortality rate are published by the World Health Organisation. To meet the rule of thumb, the infant mortalityrate is chosen in the study because this mortality rate isrelatively higher in health systems with poor performance. Since this measure is used as one of the outputs inthe health system, the reciprocal of the mortality rate isa preferable measurement. A higher inverse mortalityrate is better for the health system of the country.In addition, three explanatory variables were identifiedas possible determinants associated with variations inhealth system efficiency.Happiness levelThe happiness index has been published in the WorldHappiness Report since 2012. It is commonly used torepresent the collective happiness of the people in a nation. Several important components, including caring,freedom, generosity, honesty, health, income and goodgovernance, are adopted to construct the happinessindex. To avoid the double counting effect in the secondstage of the double bootstrap DEA framework, severalexplanatory variables that are highly correlated with happiness (e.g., income, income inequality) are excludedfrom the analysis. Countries with happier people are expected to have more efficient health systems.Population densityThis variable is measured as the ratio of the total populationserved to the total land area. Several empirical studies, including those by Greene [28] and Kumbhakar [30], haveconfirmed that population density has a significant effect onhealth system performance. A low population density implies a smaller population served over a large area. Hence, itis not surprising that a health system with areas with ahigher population density may appear to be more efficient.Healthcare share of GDPTotal health expenditures as a share of GDP vary markedly across developed and developing countries. ThePage 5 of 10relationship between expenditures on healthcare andhealth outcomes may be unclear, especially for some developed countries, because some countries with a higherhealthcare share of GDP do not always obtain betterhealth outcomes, such as longer life expectancy.Results and discussionTable 1 presents the descriptive statistics for thevariables used in the study. Global health systemperformance is estimated based on a five inputs and twooutputs model. The total number of countries involvedin this study is 121 (representing nearly 75% of total global health expenditures per capita in 2014), and thesecountries were chosen based on the availability of relevant data required for the analysis. As shown, in termsof labour, the average number of physicians is 64,382persons, and the average number of nursing and midwiferypersonnel is 139,525 persons. The number of hospitalbeds is used as a proxy for capital in the study. Theaverage number of hospital beds is recorded as 3.08per 1000 people, with a standard deviation of 2.44 per1000 people. The average years of schooling and healthexpenditures are 8.88 years and 44,609.04 milliondollar-based PPPs, respectively. For the output measures,the average healthy life expectancy is 64.48 years, whilethe average inverse mortality rate is 141.72.Original DEA scores, bias and bias-corrected efficiencyscoresThe efficiency scores for the selected global health systems in this study were calculated using the R package.The results of the DEA original efficiency scores, biasand bias-corrected efficiency scores for each country’shealth system are presented in Table A2 (Additional file2: Appendix B). The output-oriented VRS DEA model isused to calculate efficiency scores for the selected globalhealth systems. The efficiency scores range from oneto infinity, where one implies that the country'shealth system is efficient and lies on the productionfrontier. The average bias-corrected technical score is1.036 on average, with biases of 1.52%, ranging from 0.30%to 3.54%. From Table A2 in Additional file 2, weTable 1 Descriptive statistics: Global health care statisticsVariableUnit measurementMeanStd. .002,020,154.00Nursing and midwifery 719.00EducationYears8.883.041.4013.40Health expendituresmillion PPPs44,609.04117,834.10112.88997,281.40Hospital bedsPer 1000 people3.082.440.1013.70Healthy life expectancyYears64.486.5745.9074.90Inverse mortality rateValue141.72139.2010.70588.24
See and Yen Health Economics Review(2018) 8:33can observe that the original DEA scores do not fallwithin the 95% confident intervals.Figures 1, 2, 3 and 4 show that Italy, Israel, Greece(high-income countries), Thailand, China, Bosnia andHerzegovina (upper-middle-income countries), Vietnam,Guatemala, Nicaragua (lower-middle-income countries)Rwanda, Malawi and Ethiopia (low-income countries)had the most efficient health systems among their respective income groups in 2014. Therefore, the health systems ofthese countries are considered good references and offeruseful information for the less efficient countries within thesame income groups. For instance, among the developedcountries, Canada has an efficiency score of 1.0283, whichimplies that the country’s health system should increase itsoutputs by at least 2.83% to reach full efficiency.From Table A2 in Additional file 2, we can observe thatBotswana, Cameroon, and Afghanistan obtained efficiency scores greater than 1.15 and were ranked at thebottom of the upper-middle-income, lower-middle-income and low-income groups, respectively. The resultsfrom the bootstrap DEA framework suggested that withexisting country capacity and resources, more efficientutilisation of their resources in these countries couldpotentially enhance output by at least 15% in terms ofboth healthy life expectancy and an inverse mortality rate.This result arises partly because most underdevelopedand some developing countries are still lacking of healthcare accessibility and equity as well as service quality andFig. 1 Global health system performance: High-income countriesPage 6 of 10efficiency. It is not surprising that the average efficiencyscores for health systems in high-income and mostupper-middle-income groups are better than the scoresfor lower-middle-income and low-income groups.As stated in the previous section, the happiness indexis a comprehensive indicator that includes several important components, such as, caring, freedom, generosity, honesty, health, income and good governance. Thefirst happiness index was created in 2012 in the WorldHappiness Report. Many countries have started to promote happiness and well-being as a criterion for publicpolicy. Does happiness matter to healthcare policy? Anoverall picture illustrating the relationship between thehappiness index and health system efficiency is presentedin Fig. 5. It is shown that happier societies tend to havebetter health system performance. However, a morerobust analysis of the relationship between these twovariables can be conducted using the second stage of thedouble bootstrap DEA framework.The results of second stage of double bootstrap DEAIn general, differences in the efficiency scores of selectedcountries’ health systems generated by DEA could be explained by some variables that were not included in thefirst-stage DEA. Location, lifestyle and socio-economic factors are common explanatory variables used in previousstudies. In this study, happiness scores (HAPPINESS),population density (DENSITY), and healthcare share of
See and Yen Health Economics Review(2018) 8:33Page 7 of 10Fig. 2 Global health system performance: Upper-middle-income countriesGDP (GDP SHARE) are included in the second stage ofthe double bootstrap DEA framework. Some other explanatory variables are excluded from the second stage of analysispartly due to collinearity problems (e.g., tobacco), dataavailability (e.g., readmission rate) and insignificant results(e.g., obesity).3 The results of the truncated regression arepresented in Table 2. The dependent variable used in theFig. 3 Global health system performance: Lower-middle-income countriestruncated regression is a measure of health system ineffi 1). Hence, a positive coefficient indicatesciency (i.e., θmthat an increase in a related explanatory variable leads to anincrease in inefficiency of the country's health system.Happiness index (HAPPINESS) is included in theanalysis to observe the contribution of happiness to theperformance levels of selected global health systems.
See and Yen Health Economics Review(2018) 8:33Page 8 of 10Fig. 4 Global health system performance: Low-income countriesThe relationship between happiness levels and healthsystem inefficiency is found to be negative, which suggeststhat happier societies tend to have better health systemperformance. Being healthy can contribute to happiness,and improving happiness itself may also result in betterhealth. Therefore, improving and sustaining the happinessof people is an alternative way to reduce a country’shealthcare expenditure and enhance health system performance. Many studies have proven that happiness isbeneficial to health and can increase life expectancy.Population density (DENSITY) is measured by thenumber of people per square kilometre of land area. TheDENSITY variable is included to assess the effect ofpopulation density on health system performance. Thecoefficient of DENSITY is estimated and indicates anegative relationship between the population densityand health system inefficiency level. This result is consistent with those obtained in earlier empirical studies,such as Greene [28] and Kumbhakar [30]. Therefore,Fig. 5 Happiness and health system performancecountries with higher population density require morecapital investment to increase healthcare outputs, including health protection.The healthcare share of GDP (GDP SHARE) is included in the second stage of the analysis. The estimatedGDP SHARE coefficient is negative, which indicates thatcountries with a higher healthcare share of GDP arelikely to be more efficient than other countries. This difference occurs because healthcare costs have increaseddramatically, with many countries experiencing increasing difficulties in sustaining their healthcare provisionand performance. To obtain better health system outcomes, greater healthcare spending to GDP is essential,particularly, for those countries that fail to improve theirlevel of happiness and lifestyle.ConclusionsThis study employs the double bootstrap DEA approach toassess the health system efficiency of 121 selected countries
See and Yen Health Economics Review(2018) 8:33Page 9 of 10Table 2 Results of double bootstrap ddeviation95% Bootstrap CI.LowerUpperHAPPINESS 0.2478***0.0315 0.3123 0.1905DENSITY 0.0187***0.
Good health is linked to higher happiness levels, and causality seems to run in both directions. Literature reviews and meta-analyses on happiness and health have generally concluded that happiness or subjective well-being can be beneficial to health and longevity [1, 2]. Conversely, good health is often recognised as the prerequisite to .