Transcription
WEALTH AND HAPPINESS REVISITEDGrowing wealth of nations does go with greater happiness1Michael R. Hagerty1 and Ruut VeenhovenSocial Indicators Research, vol. 64, 2003, pp. 1-27ABSTRACT“Will raising the incomes of all increase the happiness of all?” Intuition says 'yes' but theoriesof relative utility caution that the answer may be ‘no’. The theory of relative utility holds thatrises in income will produce at best short-lived gains in happiness. If people’s happinessdepends on income relative to others (social comparisons), or on income relative to their ownpast income (adaptive expectations) then raising the incomes of all may not increase averagehappiness. In contrast, the theory of absolute utility predicts that additional income allows eachperson to fill additional needs, thus increasing average happiness.We test the absolute utility theory against both types of relative utility theories. Previoustests have been plagued by low statistical power, which has been incorrectly interpreted asevidence against absolute utility models. The current study improves statistical power byincluding longer time series, by adding 9 nations with low GDP/capita and (in some analyses) bypooling countries into income tiers. We also apply a model by VanPraag and Kapteyn (1973),which can estimate separate effects for social comparisons, adaptive expectations, and absoluteincome theories.The results show no effect for social comparison across countries, but show support forpartial adaptation to new income over a two-year period. Most importantly, increasing nationalincome does go with increasing national happiness, but the short-term effect on happiness ishigher than the long-term effect for a given rise in income.1 Send correspondence to: Michael R. Hagerty, Graduate School of Management, University of California Davis,Davis, CA 95616, USA, (510) 522-7505,mrhagerty@ucdavis.edu
Hagerty, M. Veenhoven, R.2Wealth and Happiness revisited1. INTRODUCTIONTwenty- five years ago, Easterlin (1974) posed an important question, “Will raising theincomes of all increase the happiness of all?” Though most citizens and economists haveimplicitly assumed that the answer is 'yes', theories of relative preference predict that the ans wermay be 'no'. Relative preference theories (Duesenburry 1949) state that an individual’s utility forincome is relative to other people (reference groups) or relative to the individual’s own previousincome stream (adaptive expectations). Under these theories, raising the incomes of all will notchange an individual’s income relative to others, and individuals’ expectations will adjust overtime to the increased income, yielding no additional utility. Both of these relative utility theorieswould make it difficult or impossible to increase the happiness of all through economic growth.In contrast, more commonly used absolute utility theories assume that greater income can fillmore needs (Veenhoven 1991) so that increasing the income of all will raise the happiness of all.Easterlin (1974) made the first attempt to test these competing theories. He firstsuggested cross-sectional comparison across nations with differing levels of GPD/capita.Current data (Veenhoven 1989; 1991; Diener and Oishi 1999; Inglehart and Klingemann 2000)now show for over 40 nations that national happiness increases monotonically with higherGDP/capita, consistent with the absolute utility theory. Micro- level correlations betweenpersonal income and individual happiness appear to be greatest in poor nations and almostnegligible in several rich nations (Veenhoven 1991), also consistent with absolute utility theory.Cross-sectional data cannot control for cultural and institutional factors that covary withnational income, such as increased freedom, improved public services, and possible culturalbiases toward happiness. Therefore, Easterlin also compared over time within a nation (the US).He observed that income per capita had doubled between 1946-1970, while average happinesshad remained at the same level. He saw that as another proof for relative utility theory.This finding has been also been contested. Veenhoven (1989) cited examples of othernations where a rise in income was followed by an increase in happiness, post-war WesternEurope and Brazil. Recently data became available about more nations and longer periods. Thefirst analyses of these data have yielded mixed results. Oswald (1997) and Hagerty (2000) foundsmall effects of national income on happiness. In contrast, Easterlin (1995) and Diener andOishi (2000) could not detect any effect. Easterlin (1995) concluded again, “Raising the incomesof all will NOT increase the happiness of all”.The present paper reports an analysis of the newest data, which tests Easterlin’s claimand rejects it. We first review previous comparisons over time and show that all studies foundpositive effects of income on happiness, and that the longitudinal effects are in fact greater thanthe observed same-time differences between poor and rich nations and poor and rich individuals.Section 2 then introduces new data that update the time series of each nation, and broadens thesample to include 9 low- income countries. In section 3 we test both Easterlin’s hypothesis thathappiness depends only on relative income as well as the ‘needs hypothesis’ that happinessdepends only on absolute income, by fitting VanPraag and Kapteyn’s (1973) welfare function tothe new data. This provides the most rigorous test on the largest database available forEasterlin’s original question.
Hagerty, M. Veenhoven, R.Previous Research3Wealth and Happiness revisitedPrevious research has been limited in three ways. First, all authors bemoan the shorttime-series and the absence of developing nations in their samples (Easterlin 1995; Diener andOishi 1999). (Developing nations are expected to show the largest effect of income on happiness,if diminishing marginal utility holds for income. But developing nations have limited budgetsfor surveys of citizen happiness.) Both of these factors limit the power of the tests to detectlongitudinal effects of income. For example, Easterlin’s latest review (1995) includes data from11 countries from 1972 to 1987, all from developed OECD nations. In contrast, the currentstudy draws on the World Database of Happiness (Veenhoven 1999) and includes 21 countries, 9of which are developing, with far lower per capita incomes than previous studies include.The second limitation of previous studies is that though Easterlin recommends that utilitymodels incorporate reference groups and adaptive expectations when applied to happiness data,no previous studies actually estimate such effects. The current paper estimates such modelsusing VanPraag and Kapteyn’s (1973) theory of relative utility.The third limitation of previous studies is that most failed to compute the coefficient ofcentral interest: the change in national happiness with a 1% change in national income.Easterlin (1974; 1995) computed only trend coefficients over time. Though over a long period ofconstant growth a significant trend effect would also imply a significant effect of income, nocountry shows exactly constant growth. Therefore the most informative statistic is the change inhappiness with change in income per capita.Two studies have reported this statistic, and are summarized in the first column of Table 1Diener and Oishi (2000 Table 8.3) found the slope of national happiness in 14 nations toaverage .007 per year per 1% increase in national GDP/capita. Converting their 4-point scales toa standardized 10-point scale, the effect-size shown in Table 1 is .007(10-1)/(4-1) .021 per 1%rise in national income per year. Though Diener and Oishi did not report a significance test, theycharacterized such a small effect as “virtually flat” (p.11). The second study that estimates theeffect of national income is Hagerty (2000 Table 4). He reported the change in happiness as .061(on a 10-point scale) per 1000 change in GDP/capita. Converting his coefficient to percentageof GDP/capita (at the mean) yields an estimate of .061/ 1000* 15,326/100 .0093 change inhappiness per 1% change in GDP/capita. This estimate is less than half that of Diener and Oishi,but was still significantly greater than zero.Summarizing the first column of Table 1, the effect of national income growth onnational happiness is clearly small when observing nations over time, though it seems to bepositive. Is the effect small enough to ignore? In order to compare these effect sizes with otherwell-accepted effects, the second column of Table 1 shows the effect sizes estimated from crosssectional analyses of an increase of 1% GDP/capita. Diener and Oishi (2000) and Easterlin(1995) both contribute studies, and both report a positive and significant effect. The table showsthat Diener and Oishi’s review of 42 nations show a change in happiness (converted to a 10-pointscale) of .010 per 1% change in GDP/capita, while Easterlin’s (1995) analysis of 24 nationscalculates it as .009. Note that Diener and Oishi’s cross-sectional estimate is smaller than theirtime-series estimate, and that Easterlin’s estimate is smaller than Hagerty’s time-series estimate,yet both Diener and Oishi and Easterlin dismiss the time-series estimate as “virtually flat”. Thereason, of course, is that the statistical power to detect the effect is limited by the variation inGDP/capita, which is much higher in the cross-sectional estimates. The standard deviation ofGDP/capita in the cross-section from Diener and Oishi was about 8,000, whereas the standarddeviation in the Hagerty time-series was only about 1 4 of that, or 2,000 within a country over 25years. In conclusion, the effect sizes in column 1 are roughly equal to or greater than generally
Hagerty, M. Veenhoven, R.4Wealth and Happiness revisitedaccepted effect sizes in column 2. Only the statistical power to detect the effect is lower instudies from column 1.The last column of Table 1 shows other effects of income that are well accepted, that arealso smaller than those in column 1. The last column summarizes cross-sectional studies thatestimate the effect of a 1% GDP/capita rise for an individual. Diener and Oishi estimated this asabout one half the size of a 1% rise in national GDP/capita, or about .005. Hagerty (2000 Table 2)calculated this as .0049 – quite close to Diener and Oishi’s estimate. Blanchflower andOswald (1999 Appendix 1) reported the linear coefficient of personal income as .00409/ 1000 inthe U.S, after controlling for sex, race, and a host of demographic variables. Evaluating this atthe mean income of 11236 and adjusting their 3-point scale to a 10-point scale yields an effectsize of .0021 per 1% rise in an individual’s income. Note that all of the effect sizes in the lastcolumn are smaller than both of the effect sizes from the first column. Contrary to previouscharacterization, the effect size of national GDP/capita is larger than effect sizes reported forindividual GDP/capita.In summary, previous research on the effect of national GDP/capita show significant andpositive effects, contrary to Easterlin’s conclusion. Moreover, the results summarized in Table 1contradict the predictions of relative utility models. For example, if reference groups operate toreduce the effect of national GDP/capita, and to accentuate the effect of individual wealth, thenwe would expect coefficients in Column 3 to be greater than those in Columns 1 and 2. Instead,they are much smaller than those in other columns. Diener and Oishi (comparing the effects incolumns 2 and 3), note this ordering of effect sizes, and propose an explanation for this, “poorpeople may receive some benefits of national wealth (e.g., parks and better health care) if theylive in a wealthy nation, and even rich people may find it difficult to avoid certain problems ifthey live in a poor society (e.g., poor roads)” (p.10). Both of these effects would dilute anyeffect of relative income in favor of a needs-based theory (a rich society fills everyone’s needsbetter for parks, health care, and roads).The current study tests these findings directly on a broader sample of countries byestimating VanPraag and Kapteyn’s model. Since it incorporates absolute utility, adaptiveexpectations, and reference group effects, the relative contribution of each can be estimated.Table 1Summary of effect sizes of income on happiness found in previous researchStudyDiener and Oishi (2000)Hagerty (2000)cEasterlin (1995)Blanchflower and Oswald(1999)Effect of 1% rise innational incomefrom time-seriesestimation.022a.009b-- d--Effect of 1% rise innational incomefrom crosssectional estimation.010a-.009e--Effect of 1% rise inindividual’s incomefrom crosssectional estimation.005a.005c-.002fNotes: a Computation of estimates shown in text.bSlope from Hagerty Table 4 is.061/ 1000. Converting to a 1% GDP base yields: .061/ 1000* 15326 /100 .0093.cSlope from Hagerty Table 2 is .004/ 1000. Converting to a 1% GDP base and to a 10-point scale yields:.004/ 1000* 26,793/100*(10-1)/(3-1) .0048.
Hagerty, M. Veenhoven, R.5Wealth and Happiness revisiteddDenotes no estimates reported in paper.Slope estimated from Easterlin (1995 Figure 4) is 1.8/ 14,000. Converting to a 1% GDP base yields:1.8/ 14000* 7000/100 .009.fSlope taken from Blanchflower and Oswald, Appendix 1 is .00000409/ 1. Converting to a 1% GDP base and to10-point happiness yields: .00000409*( 11,236)/100*(10-1)/(3-1) .0021.eRelative utility modelEasterlin proposes that a person’s happiness depends not on absolute current income, but onown income relative to other people (a reference group) in the same time period, and to theperson’s own income in past periods (adaptive expectations). The reference group hypothesispredicts that if we perceive ourselves to be doing better than average in the country, we judgeourselves to be happy. In sociology, this reasoning is known as 'social comparison theory'. Areview of comparison theory variants can be found with Veenhoven (1991). In economics it isreferred to as the theory of 'interdependent preferences'. An early account of this view waspresented by Duesenberry (1949), who proposed the basic model of interdependent preferencesto explain savings rates, in which an individual’s utility is simply his or her income relative tothe average person’s income: Ui Ii / Iav . This is an extreme form of social comparison becauseit predicts that raising the incomes of all will NOT increase the happiness of all, and predicts thathappiness is a zero sum game.The second type of relative utility variant involves a version of adaptive expectations, inwhich a person compares their current income with the income they expect based on past incomestreams. This creates a ‘rising expectations’ phenomenon where constantly growing incomecreates no new happiness because it is already expected and discounted.VanPraag and Kapteyn (1973), Kapteyn and Wansbeek (1985) and VanderStadt, Kapteyn,and van de Geer (1985) have provided a flexible model that integrates both types of relativeincome while preserving some effect of absolute income. They model utility (or happiness) foran individual i at the current time (t 0) as,Hi0 [ ln(yi* )-µi0 ] / σ(1)*where Hi0 is utility or happiness of individual i at the current time 0, yi is the individual’sperceived “permanent” income at time 0, µi0 is the mean of their expected income distribution attime 0, and σ its standard deviation. This formulation makes explicit that people consider bothabsolute income yi* and some reference level µi0 that individuals expect at that time period.They explicitly model µi0 as depending both on the income of “relevant others” and theindividual’s own past income (VanderStadt et al., 1985, Eq. 9):0µi0 Σ att - NΣ wij ln(yij) ε i0j 1(2)where at is the memory weight at time t to discount past income, wij is the importance thatindividual i places on person j in determining i’s reference group, and ε i0 are identically andindependently distributed error terms with zero mean. In order to estimate this model, furtherconstraints must be imposed. They assume that σ is constant over all times and persons(VanderStadt et al., 1985 p.182). They simplify the time weights by assuming a lag structure
Hagerty, M. Veenhoven, R.Wealth and Happiness revisited 56(where a is defined between zero and one) and they simplify the person weights by assuming thatall weights within each social reference group are equal (VanderStadt et al., 1985 Eq. 11).at (1-a)/a-t(3)wi,j k(when j is in i’s reference group, else k 0)This model allows tests of Easterlin's and Veenhoven’s hypotheses about how happinesschanges over time. If µi0 does not change with time or with incomes of relevant others, then thedata are consistent with the absolute need-based theory and relative theories are not supported.In contrast, if 0 a 1, then happiness depends on past incomes and people show adaptationeffects. Finally, if w 0, then happiness depends on relevant others, and preferences show socialcomparison effects. VanderStadt et al. (1985) estimated the model for just two periods, butfound strong effects for adaptive expectations and no effects for reference groups. Their studyfocused on satisfaction with income, and not on satisfaction with life as a whole 2 .We will estimate their model, but because our data differ, our estimation method mustdiffer in three ways 3 . First, the happiness data is aggregated to countries, whereas VanPraag andKapteyn propose their model for individuals. The difficulty is that different countries seem tohave quite different mean happiness, which may be due to extraneous factors such as culture andinstitutions. We therefore add fixed effects to (1-3), to estimate a separate intercept for eachcountry to account for these.The second problem in applying (2) is that in the present data “permanent income” yi* isan unobserved variable, whereas VanPraag and Kapteyn simply assume that the incomevolunteered by the respondent is permanent income. Therefore we take Friedman ‘s (1957)original formulation of permanent income as the weighted average of income for all previousyears, where the weights decline exponentially:0yi* (1-p) Σs - p-s ln(yis)(4)where yi* is the permanent income perceived by citizens of country i, p is the memory weight toestimate “permanent income”, and s is the index for time periods prior to the current period(s 0).Substituting these additions into (1) yields the estimation equation:0-s-1-tHi0 c Σ di b2 (1-p) Σ p ln(yis) - b1 (1-a) Σ as - t - NΣ kj ln(yjt ) ε i0k 1(5)where c is the overall y- intercept, di is the dummy variable or intercept for country i, b2 is thecoefficient of the absolute (permanent) income, and other symbols are as defined in (2-4).To demonstrate the difference that the permanent income assumption makes, take anexample such that an individual’s income rises at time t 0 in a step function, from many years of 10,000 to many years of 15,000. VanPraag and Kapteyn’s model assume that the fullincrease is perceived at once, causing happiness to peak at time 0, and to decline thereafter dueto adaptation to the new income. In contrast, the permanent income hypothesis would predictthat the individual would not be certain that the additional income is permanent in the first year,
Hagerty, M. Veenhoven, R.7Wealth and Happiness revisitedbut would take several years to become certain that the new income is permanent. As a result,the permanent income assumption (4) predicts that happiness will peak at some time greater thant 0.The third problem in applying this model to the happiness surveys is that many countriesconducted happiness surveys intermittently, so that missing data exist in the time series. This isa problem for the estimation method of VanderStadt et al. (1985) who apply the Koycktransformation (commonly used in adaptive expectations models) on (2). In our case the Koycktransformation would result in unacceptable amounts of missing data because it requires alllagged happiness data to exist. Therefore the model in (2) is estimated directly using theconstrained non- linear least-squares estimation program in SPSS. This program uses asequential quadratic programming algorithm, with a quadratic programming sub problem todetermine search direction (Gill et al. 1986). The resulting estimates are least squares, given therestrictions that a, p, and k are between 0 and 1.2. DATAThe data consisted of happiness ratings and GDP/person from 21 countries. The happinessratings were collected from Veenhoven’s (1999) World Database of Happiness. All countrieswere included that had fielded at least 3 surveys over time, using the same rating scale on arepresentative sample of citizens. The data span the years 1958-1996. Table 2 lists thecountries, the years surveyed, and the number of data points from each. Twelve of the countriesin the list participated in the Eurobarometer survey program since 1973, which employs the samelife-satisfaction scale over time and between countries. The question wording for theEurobarometer was: “On the whole, how satisfied are you with the life you lead? Are you: verysatisfied, fairly satisfied, not very satisfied, or not at all satisfied with the life you lead?” Codingwas originally on a 4-point scale, and was transformed by Veenhoven to a 10-point scale toallow easy comparison with other scales. Veenhoven gives the month that each survey wasfielded, which was transformed to the appropriate quarter and year. One country (U.S.) assesses“happiness” rather than life-satisfaction.Material wealth is measured by GDP/person, expressed in 1987 US dollars, to give aconsistent scale across countries. Data was collected from the World Bank (1997). For yearsprior to 1960, GDP/person was collected from the U.N. Statistical Yearbook (1961). Forcountries that reported quarterly, GDP/person was recorded to the nearest quarter of the year inwhich the survey was done. In all other cases, GDP/person was recorded to the nearest year.Since some countries fielded two surveys per year but reported only annual GDP measures, thescores from the two surveys were averaged for that year.For purposes of this analysis, we divide the 21 countries in Table 2 into 3 groups:countries with high GDP/capita (Norway, Denmark, Luxembourg, U.S., Japan), countries withmedium GDP/capita (England, Ireland, Netherlands, Belgium, France, Germany, Italy), andcountries with real GDP/capita of less than 10,000 (India, Philippines, South Korea, SouthAfrica, Mexico, Brazil, Portugal, Spain, Greece). Note that this sample includes a great diversityin per capita GDP and in growth paths. In contrast, Easterlin’s sample included only developedcountries with medium to high GDP/capita. The more diverse sample will allow tests ofdecreasing returns to happiness of GDP/capita.
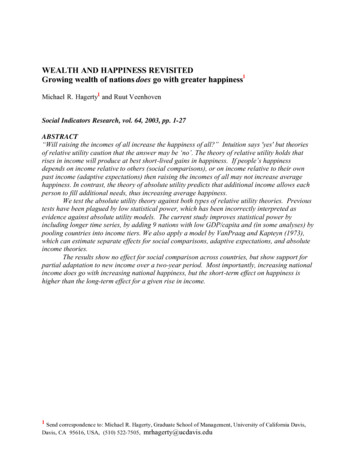
Hagerty, M. Veenhoven, R.Table 28Wealth and Happiness revisitedNations studied, with years spanned and average GDP/capita for eachCountryYearsHigh GDP/capitaNumber ofhappinesssurveysAverageGDP/capita in1995 U.S.United 972-961973-961973-96263964122 17,584 18,265 19,874 18,474 17,797United 0223822404040 11,185 8,953 14,972 13,796 15,372 14,140 12,486Medium GDP/capitaLow GDP/capitaSpain1984-9622 8,144Portugal1985-9613 4,228Greece1981-9626 4,565South Africa1981-967 2,395Brazil1975-965 1,917Korea (South)1979-965 3,132Mexico1975-964 1,780India1975-964 321Philippines1979-963 622Total465*Surveys in the US asked about 'happiness' instead of 'life-satisfaction'.3. RESULTSDescriptive Statistics on Happiness and IncomeThe dashes in Figure 1 display the growth of real income per capita (on the left- handaxis) by year for the three groups of countries. For example, the upper line shows that realincome for the top group was about 14000 per capita in 1972, and grew to about 23000 in1996. Note that the slope of the medium income group is lower, and the slope of the lowestincome group is lowest. This diverging pattern is typical of current global growth patterns(Sachs and Warner 1997), where incomes of less developed countries have diverged instead ofconverged to that of more developed countries. Hence the sample of countries for which wehave happiness data appears typical of the income growth patterns observed in the world as awhole.The dots in Figure 1 represent the average national happiness ratings (on the right- handaxis) of the nations in each group for that year. For example, the national happiness of the 4nations in the top income group averaged 6.9 in 1972, and rose to 7.9 in 1996. Several pointsshould be noted from Figure 1. First, any cross-section of happiness (holding time constant) is
Hagerty, M. Veenhoven, R.9Wealth and Happiness revisitedfairly consistent, in that nations with lower incomes report lower average happiness scores. Thiseffect is now generally acknowledged (Easterlin 1995; Diener and Oishi 1999) and isdocumented in Table 1, column 2. Second, the top two time-series of happiness showsperceptible growth over time. This appears to support the needs-based theory. However, thegraph should be viewed with caution because some data is missing (nations do not surveyhappiness every year, especially not developing nations). Formal testing must await estimationof separate effects in the presence of missing data, but Figure 1 gives a helpful visualization ofthe data.Table 3 displays some results for each country separately. Remember that the number ofobservations ranges from 41 to 3 so that some items with high correlation are not significant.The first column presents the contemporaneous correlation between national happiness andnational wealth for each nation. It shows that wealth is positively correlated with happiness for14 of the 21 countries, and that only 1 of the 21 countries had a significant negative correlation –Belgium. In contrast, 7 of the 21 countries show significant positive correlation with wealth.This column shows that most countries display a positive relation between national income andhappiness. The positive effects are all consistent with absolute preferences and contradictDusenburry’s extreme relative preference theory.The next two columns of Table 3 display lagged correlations, because these can bearhints about causality. If a change in wealth is followed next year by a change in happiness (highcorrelations in column 2), then evidence for causation is enhanced. Conversely, if a change inhappiness is followed next year by a change in wealth (high correlations in column 3), thenevidence for reverse causation is enhanced. These rows of Table 3 show that average laggedcorrelations are positive but were lower than the average contemporaneous correlation in column1 of .27. Hence the causal mechanism appears to operate within a 1- year window, and wecannot distinguish the direction of causality with current data.The last two columns of Table 3 present the magnitude of the effect of the regression ofGDP/capita on happiness. Column 4 reports the raw beta coefficient from the regression as theeffect of 1000 increase in GDP/capita on happiness, and column 5 converts this to the effect ofa 1% increase in GDP/capita in the country (calculated at the country’s mean income). The lastrow of Table 1 shows that the average estimate over all countries is that happiness rises by .008(on a 10-point scale) with each 1% rise in national income. This is slightly smaller than theeffect size found by Hagerty for 8 countries (see Table 1 column 1) and less than half the effectsize found by Diener and Oishi. Note that this effect size is still more than twice as large as theeffect size found for individuals within countries, which range from .002 to .005 (Table 1 column3).
Hagerty, M. Veenhoven, R.Table 3.Country10Wealth and Happiness revisitedCorrelation of life-satisfaction and income in 21 nations 1973-1996SlopeCorrelation Correlation CorrelationSlopePer 1%Lagged: Lagged:per 1000Same timeGDP/capita Life-satisfaction1 year before1 year beforeU.S.JapanNorwayDenmarkLuxembourg 0.51*** 0.04-.38 0.53*** 0.71*** .41**-.03-.20 .52*** .69*** .54***-.28*-.38 .54*** aly 0.01-0.10 0.38**-0.40* 0.15 0.24 0.90*** .03-.13 .35**-.41* .14 .20 .89*** .01-.23 .44***-.42*-.33** .38** .87***SpainPortugalGreeceSouth AfricaBrazilKorea (South)MexicoIndiaPhilippines-0.09 0.65**-0.20-.40-.32 .92* .95 .71 .86-.16 .24-.19-.37-.20 .93* .83 .82-.45-.08 .74***-.37*-.43-.17 .92 .85 .72 .80Average 0.27 .19 .23High GDP/capitaMedium GDP/capitaLow 0120.0310.0130.062.010.008** p .05 *** p .01Table 3 also sho ws average effect sizes for high, medium, and low GDP/capita countries, shownin summary rows beneath each group of nations. They show that the average effect size forhigher GDP countries is smaller than that for medium GDP countries, which in turn is smallerthan that for lower GDP countries. This evidence is consistent with a national utility functionthat is logarithmic in income, showing that the increase in happiness with a given dollar increasein income is greatest for nations with lowest GDP/capita. This decreasing effect size has longbeen visible in cross-sectional analyses (Veenhoven 1991; Easterlin 1995), but this is the firstanalysis where effect sizes have been calculated within-country, controlling for culture andinstitutions.Easterlin's earlier claim was based on reports from 11 nations up to 1987. Five of these11 nations now show significant increases in life satisfaction (U.S., The Netherlands, Germany,Italy, and
In section 3 we test both Easterlin's hypothesis that happiness depends only on relative income as well as the 'needs hypothesis' that happiness depends only on absolute income, by fitting VanPraag and Kapteyn's (1973) welfare function to . In summary, previous research on the effect of national GDP/capita show significant and .