Transcription
HFS Small Applied ResearchPaper No. 1Analysis of the Demand forInpatient and Outpatient Carefrom Imbaba Hospital, Cairo, EgyptbyRandall P. ELLISandElizabeth H. STEPHENSONConsultants, Abt Associates Inc.Submitted to the Office of HealthHealth Services Division,Bureau of Research and Development,Agency for International DevelopmentNovember 1992HEALTH FINANCING AND SUSTAINABILITY (HFS) PROJECTAbt Aseociates Inc., Prime Contractor4800 Montgomery Lane, Suite 600Bethesda, Maryland 20814 USATel: (301) 913-0500 Fax: 1301) 652-3916Telex: 312636Management Sciences for Health, SubcontractorThe Urban Institute, SubcontractorA.I.D. Contract No. DPE-5974-Z-00.9026-00
ABSTRACTThe authors use an econometric analysis of household data to determinethe impact of changin fee structures for cost recovery at Imbaba Hospital, apublic hospital in Cairo, Egypt. Their analysis includes a description ofpresent health care utilization patterns, estimations of the determinants ofdemand, and simulations of changes in demand in response to rhangeh in certainkey variables. The analysis, conducted separately for inpatients andoutpatients, shows that Imbaba Hospital is considered to be a low-qualityfacility and that demand for inpatient care is less responsive to fee levelsthan demand for outpatient care. While the authors find that there is asignificant willingness to pay for services perceived to be of higher ]uality,they caution that the results do not provide a clear indication of thepotential demand response to increasing fees at Imbaba Hospital.
ACKNOWLEDGEMENTSThis report is part of the Egypt Cost Recovery for Health Project(CRHP), assisted by the Health Financing and Sustainability (HFS) Projectunder the sponsorship of the Egyptian Ministry of Health with support fromUSAID. We are grateful to Ricardo Bitran, Keith Mclnnes, and Samir Zaman ofAbt Associates for extremely helpful discussion and comments on the analysisand results, and to Louise F. Kemprecos, of Integrated DevelopmentConsultants, Cairo, Egypt, for her excellent preparation and documentation ofthe survey data, and her useful suggestions. The opinions expressed are thoseof the authors. Any errors are our own.
TABLE OF CONTENTSLIST OF EXHIBITS .EXECUTIVE SUMMARY . . . . . . . .1.0 INTRODUCTION .2.0.vi.DESCRIPTIVE ANALYSIS .2.1 SAMPLE . . . . .2.2 INDICATORS OF ABILITY TO PAY .2.2.1 Annual Expenditures .2.2.2 Asset Ownership .2.2.3 Health Insurance .2.2.4 Willingness to Pay Fees .2.3 INDIVIDUAL CHARACTERISTICS .iv1. . . . . . . . . . . .2222346103.0MULTIVARIATE MODEL .153.1 INDEPENDENT VARIABLES .183.1.1 Log of Predicted Expenditure .183.1.2 Travel Time . . .193.1.3 Quality Points . . 193.1.4 Fees . .193.2 RESULTS FROM THE OUTPATIENT MODEL . 203.3 RESULTS FROM THE INPATIENT MODEL . . 244.0SIMULATIONS OF DEMAND .4.1 OUTPATIENT CARE .4.1.1 Fee Simulations . .4.1.2 Simulations of Other Variables . .4.2 INPATIENT SIMULATIONS . .4.2.1 Fee Simulations . .4.2.2 Simulations of Other Variables . .5.0 CONCLUSION AND POLICY IMPLICATIONS .APPENDIX A: REGRESSION MODEL OF THE LOG OF ANNUAL EXPENDITURE .3030303336363641. 43APPENDIX B: PERCENTAGES CHOOSING EACH FACILITY GROUP BY REASON FORVISIT . .44APPENDIX C: LOGIT RESULTS FROM PREFERRED SPECIFICATION WITH INTERACTIONTERMS BETWEEN FEE LEVELS AND PREDICTED ANNUAL EXPENDITURES46BIBLIOGRAPHY .50.
LIST OF EXHIBITSEXHIBIT 1:LIST OF VARIABLES .EXHIBIT 2:MEAN ANNUAL EXPENDITURE AND ANNUAL HEALTH CAREEXPENSES BY EXPENDITURE QUINTILE (LE) . 3EXHIBIT 3:PERCENTAGES OF HOUSEHOLDS OWNING VARIOUS ASSETS (SELFREPORTED) . .x5EXHIBIT 4:OUTPATIENT CHOICE OF FACILITY GROUP BY MAJOR REASONFOR VISIT .EXHIBIT 5:INPATIENT CHOICE OF FACILITY GROUP BY MAJOR REASON FORVISIT .8AVERAGE OUTPATIENT EXPENSES BY FACILITY TYPE ANDREASON FOR SEEKING TREATMENT .9AVERAGE INPATIENT EXPENSES BY FACILITY TYPE AND REASONFOR SEEKING TREATMENT .10PERCENTAGES OF OUTPATIENT VISITS TO EACH TYPE OFFACILITY BY EXPENDITURE QUINTILE . .11PERCENTAGE OF INPATIENT VISITS TO EACH TYPE OFFACILITY BY EXPENDITURE QUINTILE . .11SAMPLE MEANS FOR OUTPATIENTS BY TYPE OF FACILITYVISITED .12SAMPLE MEANS FOR INPATIENTS BY TYPE OF FACILITYVISITED .13DECISION TREE FOR OUTPATIENT TREATMENT DURING THE PAST30 DAYS . .16DECISION TREE FOR INPATIENT TREATMENT DURING THE PAST12 MONTHS . .17EXHIBIT 6:EXHIBIT 7:EXHIBIT 8:EXHIBIT 9:EXHIBIT 10:EXHIBIT 11:EXHIBIT 12:EXHIBIT 13:EXHIBIT 14:EXHIBIT 15:EXHIBIT 16:PARAMETER RESULTS FROM THE FULL MODEL OF OUTPATIENTCARE .PARAMETER RESULTS FROM THE FULL MODEL OF INPATIENTCARE . .SIMULATED EFFECT OF IMBABA OUTPATIENT FEES - ALLINCOME GROUPS COMBINED .222731EXHIBIT 17:SIMULATED EFFECT OF IMBABA OUTPATIENT FEES BY INCOMEQUINTILE . . 32EXHIBIT 18:SIMULATION RESULTS FOR OUTPATIENT FEE INCREASES BYiv
ANNUAL EXPENDITURE QUINTILE .EXHIBIT 19:EXHIBIT 20:. . 34SIMULATION RESULTS OF OUTPATIENT VISIT PROPORTIONS BYSELECTED DEMOGRAPHIC VARIABLES .35SIMULATED EFFECT OF IMBABA INPATIENT FEES - ALL INCOMEGROUPS COMBINED .38EXHIBIT 21:SIMULATION RESULTS FROM INPATIENT FEE INCREASES BYANNUAL EXPENDITURE QUINTILE . . 39EXHIBIT 22:SIMULATION RESULTS OF INPATIENT VISIT PROPORTIONS BYSELECTED DEMOGRAPHIC VARIABLES . 40EXHIBIT A-i:REGRESSION MODEL OF THE LOG OF ANNUAL EXPENDITURE.43EXHIBIT B-i:PERCENTAGES CHOOSING EACH FACILITY GROUP BY REASON FORVISIT - Outpatient Care .44.EXHIBIT B-2:PERCENTAGES CHOOSING EACH FACILITY GROUP BY REASON FORVISIT - Inpatient Care . 45EXHIBIT C-i:LOGIT RESULTS FROM PREFERRED SPECIFICATION WITHINTERACTION TERMS BETWEEN FEE LEVELS AND PREDICTEDANNUAL EXPENDITURES - Outpatient Mouel Results . .EXHIBIT C-2:.46LOGIT RESULTS FROM PREFERRED SPECIFICATION WITHINTERACTION TERMS BETWEEN FEE LEVELS AND PREDICTEDANNUAL EXPENDITURES - Inpatient Model Results .48
EXECUTIVE SUMMARYBACKGROUNDThe Egypt Cost Recovery for Health Project (CRHP), sponsored byEgyptian Ministry of Health and supported by USAID, is designed to improvehealth care system in Egypt. The specific areas addres:ed by the projectimprovements in the quality of services provided, increasing the degreefinancial self sufficiency of hospitals, and ensuring adequate access to careall.thetheareofforThe first phase involves changing fee structures to improve cost recoveryat public hospitals, and the first hospital to be considered is Imbaba Hospital,in Cairo. To gain a better understanding of how to modify the current feesystem, USAID/Cairo contracted with the Health Financing and SustainabilityProject (HFS) and contracted with Integrated Development Consultants of Cairo toconduct three surveys: a household survey, an Imbaba patient survey, and afacility survey. A descriptive analysis of the survey results is contained in"Economic Surveys for Health Financing and Sustainability" by Kemprecos andOldham (1992).ANALYTICAL APPROACHThis report presents an econometric analysis based primarily upon thehousehold survey results. The analysis highlights the factors that influence thedemand for health services, the expected demand response to a variety of feechanges, and the implications of the results for health policymakers.Theanalytical method, as well as the findings inthis report, are divided into threecategories: a descriptive analysis of current patterns of health careutilization, estimation of results from a multivariate analysis on thedeterminants of health care demand, and simulations of demand response to changesin the key variables of interest. Policy conclusions based upon each of theseapproaches are spread throughout the report.The multivariate results are found by estimating multi-stage models of thedemand for health care, which attempt to measure the importance of each of anumber of variables on an individual's decision to seek care and choice ofprovider. The models use three groups of variables: household level, such asincome, family size, and geographic location; individual level, including gender,age , education level, and employment status; and facility level, includingprice, quality, and distance from home. For the purpose of this study, providerswere grouped into three categories: Imbaba, other public providers, andprivate/charitable providers.This grouping was chosen based on expectedsimilarities among the various facility types. The analysis was conductedseparately for inpatients and outpatients.It should be noted that most of the multivariate model results are highlysensitive to the model specification, and often performed poorly in a statisticalsense. The final model used for simulations was not the preferred specification.The poor behavior of the multivariate model is almost certainly due to the lackvi
of adequate measures of facility quality. Because of this poor performance, wehave minimized the policy conclusions to be drawn from the multivariate model,the descriptive results and from thoseand emphasized cenclusions frommultivariate results that are not sensitive to the model specification.PATTERNS OF HEALTH CARE UTILIZATIONGeneral Analysis People in the catchment area are moderately affluent and a largeproportion own such items as television sets and tape recorders.020 percent of the households report having at least one familymember with health insurance.*The percentage of average annual household expenditure spent onmedical services, including both outpatient and inpatient treatment,ranges from 3.8 percent for the lowest expenditure quintile to justover two percent for the highest quintile.Outpatient Analysis*frivate providers are the preferred group for outpatient care, with71 percent of total visits to private or charitable providers. Internal medicine and pediatrics are the most commonly needed typesof outpatient care.*Patients at Imbaba are generally less wealthy and less well educatedthan outpatients at other facilities.0Patients at Imbaba spend less, on average, than outpatients at otherfacilities for almost every type of service.Inpatient Analysis0Public hospitals are the most popular facilities for inpatient careand, of them, Imbaba is the most often visited, accounting for 16.3percent of the total hospital visits.0General surgery is the most common inpatient procedure cited,followed by delivery. Patients at Imbaba are predominantly female and slightly youngerthan other inpatients. Again, they are also less wealthy and lesswell educated than patients at other facilities. Treatment costs at Imbaba are lower than at other facilities formost types of services.ELLIS AND STEPHENSONviiHFS APPLIED RESEARCH
DETERMINANTS OF THE DEMAND FOR HEALTH CAREDemographic variables such as income, education, employment status, gender,and age are found to be very important determinants of health care demand forboth outpatients and inpatients.The outpatient model reveals demographicfactors to be more important for an individual's decision to report an illnessthan for the decision to seek formal care. On the inpatient side, the samedemographic variables are also found to have a strong influence on anindividual's decision to seek hospital care.For the choice of facility, factors such as income, price, healthinsurance, and type of illness are found to have a substantial influence. It issurprising that travel time and quality are not more important, however, thiscould be the result of the relatively poor measures used for these variables.It seems clear from the pattern of utilization by expenditure quintile, however,that Imbaba is considered to be of low quality. The negative coefficients onincome indicate that those individuals who can afford care at private hospitalswould prefer to go there. Higher-income individuals are much less likely tovisit Imbaba.POLICY IMPLICATIONS*There is a significant willingness to pay for private and charitablefacilities due to the higher quality of services they are perceivedas providing.These private and charitable facilities receivehigher scores on a variety of dimensions such as reputation,equipment, cleanliness, and drug availability.*The Ministry of Health should work to improve the quality ofservices provided at Imbaba. Perhaps it could specialize, usingresources from other areas to improve delivery of the more popularservices. (Opening the new building may be a good first step)0Results from the household survey do not provide a clear indicationof the demand response that can be expected from raising fees atImbaba, since higher fee levels are currently linked with higheraverage quality. There is some evidence in the data, supported byother studies, that the demand for inpatient care is much lessresponsive to fee levels than the demand for outpatient services.Given the higher level of resources used in inpatient care, it isappropriate that a new fee structure continue to chargesubstantially more for inpatient than outpatient services.*Fee increases could be used to help finance the qualityimprovements, but caution needs to be taken that lower-incomepatients, who tend to frequent Imbaba, are not excluded from care.Lower-income individuals already consume substantially fewer healthservices than higher-income individuals.0Much of the current revenue is generated from bed charges forinpatient visits. Since wealthy people seem willing to pay highrates for a perceived high quality of care, it may be useful toELLIS AND STEPHENSONviiiHFS APPLIED RESEARCH
scale accommodations in such a way that the desired amenities can beoffered to patients at a higher price, but the option for basic low cost care is still available.0Insurance, education, and income all have a large impact on thelevel of health services used. Government policies that influencethese variables will also have a significant impact on the use ofservices at Imbaba.ELLIS AND STEPHENSONixHFS APPLIED RESEARCH
EXHIBIT 1:LIST OF VARIABLESType of Variable:D DummyINDIVIDUAL LEVEL VARIABLESC ContinuousAge:agegplagegp2agegp3agegp4ageimbyouth under 6 years old6 to 15 years old16 to 35 years old36 to 55 years oldage of Imbaba patientperson under 12 years oldDDDDCDGender:malefemale male ofess currently workinglow level clerkskilled workerunskilled condcollege currently a studentprimary education levelhigh school education levelcollege educationDDDDReasons for Visit:intmedientobgynpediatgensurgmatern(dummies for facility groups were interacted withdummies for major reason for visits: 1 Imbaba,2 Other Public, 3 Private is the omitted dummy) internal medicine (imi, im2) ear, nose, throat (entl, ent2) gynecological (obgl, obg2) pediatrics (pedl, ped2) general surgery (gensurgl, gensurg2) maternity (materni, matern2)DDDDDDType of Variable:D DummyC ContinuousHOUSEHOLD LEVEL VARIABLESGeneral:lnpredexhealthin log of predicted annual expenditure if anyone in the household has health insuranceELLIS AND STEPHENSONxCDHFS APPLIED RESEARCH
nindsmallfammedfam number of individuals in the household 4 or fewer people in the household 5 to 8 people in the householdCDDRelationship to head of household: head of householdheadspouse spouse of head of household child of head of householdchild gender of head of householdheadsexheadocc occupation of head of householdDDDDDAge of Household Head: head of household is 16 to 35 years oldhagegp3 head of household is 36 to 55 years oldhagegp4DDEducation of Household Head:hcurrent head is currently a studenthprimary primary education level for headhsecond high school education level for headhcollege college education for headDDDDSegment of Residence:emunira East Munirageziret Geziret Meet Uqba Meet Uqbameetuqba Mataar imbabamataar Abd El Niamabdelniatajeldu Taj El Duwalelarab Warraq El Arab Warraq El Hadarelhadarwmunira West MuniraDDDDDDDDDELLIS AND STEPHENSONxiHFS APPLIED RESEARCH
FACILITY LEVEL VARIABLESpopfeepipfeeqpointstravtioplndenkiplndens predicted outpatient fee predicted inpatient fee quality rating estimated travel time inclusive value from last stage of outpatient model inclusive value from last stage of inpatient modelCCCCCCThe following are indexed by facility type:1 Imbaba, 2 Other Public, 3 PrivateprimedlsecedlcolledlageimblELLIS AND STEPHENSON primary education interacted with Imbaba dummysecondary education interacted with Imbaba dummycollege education interacted with Imbaba dummypatient age interacted with Imbaba dummyxiiDDDCHFS APPLIED RESEARCH
1.0 INTRODUCTIONThe Egypt Cost Recovery for Health Project is intended to assess the potentialfor changing fee structures and improving quality at public hospitals to improvetheir financial position and their delivery of services. The pilot hospital forthe analysis is Imbaba Hospital, in Cairo, and, as part of the project,household, patient, and provider surveys of the region surrounding Imbaba wereconducted in early 1992. The surveys were conducted by Integrated DevelopmentConsultants, and the results are summarized in the Final Report for "EconomicSurveys for Health Financing and Sustainability", prepared by Kemprecos andOldham (1992).Complementary to their analysis, this report presents aneconometric analysis of the survey results in an effort to better understandpeople's willingness to trade price for quality and the extent to which priceincreases will reduce the utilization of Imbaba Hospital.Section 2.0 of this report examines and summarizes survey responses, primarilyfrom the household survey, in order to understand expenditure and health careutilization patterns of those residing in the catchment area. This descriptiveanalysis imparts background information on the current situation and highlightsthe differences between Imbaba and other types of facilities.Thecharacteristics of Imbaba patients are found to be distinct from patients bothin other public and in private/charitable facilities.In order to predict the independent impact of demographic and facilitycharacteristics while controlling for other variables, a multivariate model ofthe decision-making process is developed and estimated.The estimationtechniques used are three-stage nested logit models of both inpatient andoutpatient care. In Section 3.0, the two decision models are estimated and theresults discussed. Throughout the analysis, results are compared and facilitychoices made between three facility groupings: Imbaba, other public, andprivate/charitable. In the last section, information obtained from the resultsof the models, regarding which factors influence people's decisions at eachstage, is used to examine the likely impact of changes in the fee structures andin the health insurance situations. The focus of these simulations is on changesin the probability of an individual visiting Imbaba for care as, first, The costof care at Imbaba rises and, second, people in the community go from a positionof no insurance to universal coverage. Finally, the results of this analysis aresynthesized, and policy recommendations are discussed based on these findings.ELLIS AND STEPHENSON1HFS APPLIED RESEARCH
2.0 DESCRIPTIVE ANALYSISThis section presents results from a univariate analysis of the variablesconcerning expenditure, health care utilization, and patient and facilitycharacteristics.These statistics provide a better understanding of thecharacteristics of the sample population and their demand for health services.Comparisons of patient characteristics across the different facility groupsreveal substantial differences in terms of average co-t.s of services, utilizationrates, and the affluence of patients. A complete list of the variables used inthis report is found in Exhibit 1.2.1SAMPLEFor the purpose of this analysis, the sample was defined such that all theobservations have non-missing values for the variables used in the models. Theanalysis is based on four different units of observation: households,individuals, outpatient episodes, and inpatient episodes. Of the original 1,652households, our final estimation sample includes 1,647 (99.7 percent). Out ofthe original sample of 8,012 individuals, our outpatient sample has 7,793 people,of whom 1,810 report having had an illness in the past 30 days, and 2,000 of theoriginal 2,042 outpatient episodes are used. The inpatient model is based cn7,351 people, of whom 510 report being hospitalized at least once during the pastyear, and 513 of the original 608 inpatient episodes are used. Because of thesesample changes, our variable means may differ slightly from those reported byKemprecos and Oldham (1992).2.2INDICATORS OF ABILITY TO PAY2.2.1 Annual ExpendituresFor this analysis, we focused on household expenditure rather than householdincome as a summary measure of ability to pay. Data on income are particularlyuseful for assessing the population's ability to pay, however, reliable incomefigures are rarely available in developing countries. Although the householdsurvey measured both income and expenditure, we have included the figures onannual household expenditure, as estimated by Kemprecos and Oldham (1992), in ouranalysis.The household's medical expenditures on outpatient care were calculated as thesum of reported costs of exams, diagnostic tests, drugs, tips, hospital fees, anddoctors' fees for all episodes during the 30-day recall period. Expenditures oninpatent care were calculated in a similar manner, based on all episodes duringthe one-ycar recall period. For Exhibit 2, annualized spending on outpatienthealth care is estimated as the monthly outpatient expenditure multiplied by 12.Total annual expenditures are the sum of the annual outpatient and inpatienthealth expenditures.Exhibit 2 summarizes total annual expenditure and expenditure on outpatientand inpatient health care services. The annual levels of spending on healthservices range from approximately US 23 for the second quintile to approximatelyUS 102 for the highest.The resulting percentages of annual expenditureallocated to health care range from 3.86 percent for the lowest quintile toELLIS AND STEPHENSON2HFS APPLIED RESEARCH
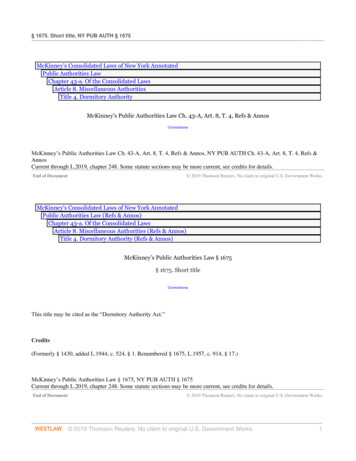
slightly over two percent for the highest income quintile. The lowest rate ofsperding is observed for the second income quintile, although the differencebetvreen that group and the lowost quintile is not statistically significant.EXHIBIT 2:MEAN ANNUAL EXPENDITURE AND ANNUAL HEALTH CARE EXPENSES BYEXPENDITURE QUINTILE (LE)TOTAL %US REOUTPATIENTEXPENDITUREINPATIENTEXPENDITURELOWEST QUINTILE2363.762.27SECOND QUIN FILE4042.7THIRD QUINTILEFOURTH QUINT!LQUINTMLEHIGHEST QU:NTILE'Egyptian Pounds (LE) converted to US dollars at a rate of 3.3 LE per US dollar, as in Kemprecos and Oldham (1992).The data in Exhibit 2 can be used to estimate the "income" elasticity ofdemand. (Technically, these are expenditure elasticities rather than incomeelasticities, however, since we are using average annual expenditures as a proxyfor income, we choose to present this as the more conventional "income"elasticity.) Income elasticities for outpatient and inpatient care are eachapproximately .55. ,hese elasticities indicate that a 10 percent increase inexpenditures (income) is on average associated with a 5.5 percent increase inspending on both inpatient and outpatient health services. Thus, as expected,health care expenditures generally increase with increases in income.2.2.2Asset OwnershipExhibit 3 shows the percentages of households owning various assets. Astriking feature of the sample population is the high rates of ownership ofassets commonly associated with moderately high standards of living. Lbrgepercentages of people own such items as televi-ion sets, tape recorders,refrigerators, and fans. The finding that 93.1 percent of the households own atelevision set and 63.9 percent own a color television is particularlynoteworthy. These percentages more closely resemble those of a fully developedcountry than those of a developing one. The affluence of the sample suggeststhat small to moderate increases in health care costs would not cause seriousaccess problems for a substantial portion of the people in the region.2.2.3Health InsuranceA further indication of the ability to pay is the presence of healthinsurance. Approximately 20 percent of the households responded 'yes' to theELLIS AND STEPHENSON3HFS APPLIED RESEARCH
question of whether or not any member of their household had health insurance.No doubt many of the people indicating health insurance coverage are covered bythe government's mandatory Health Insur'ance Organization for government and largeemployers, which has been in place since 1985. In addition to this insuranceprogram, many other people are covered by their employers for treatment byspecific providers.ELLIS AND STEPHENSON4HFS APPLIED RESEARC
EXHIBIT 3: Percentages of Households Owning Various Assets (self reported)percentbutagas **94.70washing ****************93.12color ******** ****************************tape ar*17.27*****motorbike**9.143.01---- .- ----------045.5510.21*air wing machine63.941020304050----- - ---- 6070percentage of all householdsiv80- - - 90100
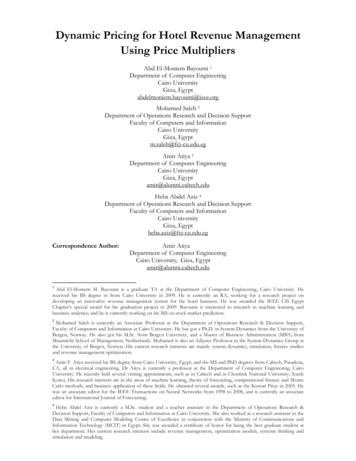
2.2.4Willingness to Pay FeesExhibit 6 shows the average expense of outpatient treatment for variousillnesses at each type of facility. These costs are calculated as averages ofpatient- reported expenditures; actual facility price quotes were not available.The most notable comparison is between outpatient expenditures at Imbaba andother public hospitals. Patients at Imbaba pay less for every service exceptdentistry, ophthalmology, and ob/gyn. The average expense for pediatric care isalso slightly higher at Imbaba, but the difference is minimal. The differencesare quite large for some services.Average expenditures for both internalmedicine and orthopedics, for example, are three times higher at other publicfacilities than at Imbaba. Of the public facilities, Imbaba is visited the mostoften. Private and charitable facilities are the most expensive, with averagepatient expenditures five to 10 times higher than at Imbaba. Despite the extremedifferences in expenditures between the facility types, Exhibit 4 shows thatprivate and charitable facilities are overwhelmingly preferred for outpatientcare, accounting for 71 percent of the total outpatient visits. Presumably thesefacilities are visitbd because they offer better quality care. This suggeststhat a substantial portion of the population may be willing and able to pay muchhigher prices for care if the perceived quality is higher.As revealed in Exhibit 7, differences in inpatient expenditures acrossfacilities indicate a similar situation. Extreme variation exists inthe averagepatient expenditure on inpatient care at different facilities, however, some ofthe observed variation is no doubt due to randomness, probably compounded by thesmall number of cases in some cells.Inpatients at Imbaba pay less thaninpatients at other public hospitals for every service except general surgery,which is only slightly higher, and chest problems. The costs of private andcharitable facilities are again much higher for every service. As revealed inExhibit 5, public facilities are the preferred providers of inpatient care, withImbaba as the most popular, accounting for 16.3 percent of the episodes.However, 27 percent of the patients still chose private or charitable facilities.In conclusion, the most popular facilities for outpatient care, which isgenerally less expensive than inpatient care, are private.However, forinpatient procedures, where expense isgreater, patients choose public facilitiesmore frequently.ELLIS AND STEPHENSON6HFS APPLIED RESEARCH
EXHIBIT 4OUTPATIENT CHOICE OF FACILITY GROUPBY MAJOR REASON FOR VISITReason for dic. . . .Uro logy.Skin and Veneral Dis" . . . . . . .OpthamologyDentistryOther ". .l0. .lTotal, All reasons. .ME20.40-60Percentages of visitsImbaba 3Other Public [:.Private/Charity80100
EXHIBIT 5INPATIE
Randall P. ELLIS and Elizabeth H.STEPHENSON. Consultants, Abt Associates Inc. Submitted to the Office of Health Health Services Division, Bureau of Research and Development, Agency for International Development. November 1992. HEALTH FINANCING AND SUSTAINABILITY (HFS) PROJECT . Abt Aseociates Inc., Prime Contractor 4800 Montgomery Lane, Suite 600