Transcription
University of Kirkuk/College of Engineering/PetroleumDepartmentProduction Engineering II[Inflow Performance Relationship (IPR)]2017-2018
Petroleum DepartmentFourth StageLectureIPRProduction Engineering II/ /2017Syllabus:1. Types of reservoirs and radial flow in the reservoirs.2. Productivity index.3. Inflow performance relationship (IPR).4. Effect of stratification and water cut on IPR productivity index test.5. IPR methods, Vogel method, Standing method, Couto method, Fetkovich method, AlSaadoon method.6. Mathematical and physical principles for pressure drop calculations.7. Flow pattern and its relation with pressure drop.8. Poettman and Carpenter method, Dukler method.9. Working charts.10.Analysis of choke performance.11.Prediction of restricted and unrestricted production.12.Effect of other parameters on well performance.13.Derivation and solutions of diffusivity equation.14.Application of Horner solution.15.Multi-rates test.16.Build-up test.17.Draw-down test.18.Effect of skin factor on well testing analysis. رشيد هليل العاني , حازم حسن العطار ,)II الكتاب المنهجي (هندسة إنتاج النفط References:1. Production optimization using nodal analysis, Dale Beggs.2. Petroleum production engineering, Boyun Guo, William C. Lyons, Ali Ghalambor.2
Petroleum Department3.4.5.6.7.8.9.Fourth StageLectureIPRProduction Engineering II/ /2017Heriot watt University, production engineering technology II.The technology of artificial methods, volume 1, Kermit E. Brown, H. Dale Beggs.Pressure transient test, John Lee, John B. Rollins, John P. Spivey.Reservoir engineering handbook , Tarek Ahmed.Advance in well testing analysis, Robert, C. Earlougher,Jr.Papers.Other resources: internet.Division mark1. Final average (40%).2. Final exam (60%).Examinations1. Open part.2. Close part.3
Petroleum DepartmentFourth StageLectureIPRProduction Engineering II/ /2017Important TermsFlow RegimesThere are basically three types of flow regimes that must be recognized in order todescribe the fluid flow behavior and reservoir pressure distribution as a function of time.There are three flow regimes: Steady-state flow Unsteady-state flow Pseudosteady-state flow1) Steady-State FlowThe flow regime is identified as a steady-state flow if the pressure at every locationin the reservoir remains constant, i.e., does not change with time. Mathematically, thiscondition is expressed as: 𝐩( ) 𝟎 𝐭 𝐢The above equation states that the rate of change of pressure p with respect to timet at any location i is zero. In reservoirs, the steady-state flow condition can only occurwhen the reservoir is completely recharged and supported by strong aquifer or pressuremaintenance operations.2) Unsteady-State FlowThe unsteady-state flow (frequently called transient flow) is defined as the fluidflowing condition at which the rate of change of pressure with respect to time at anyposition in the reservoir is not zero or constant.This definition suggests that the pressure derivative with respect to time is essentially afunction of both position i and time t, thus 𝐩( ) 𝐟(𝐢, 𝐭) 𝐭3) Pseudosteady-State FlowWhen the pressure at different locations in the reservoir is declining linearly as afunction of time, i.e., at a constant declining rate, the flowing condition is characterized asthe pseudosteady-state flow. Mathematically, this definition states that the rate of changeof pressure with respect to time at every position is constant, or4
Petroleum Department(Fourth StageLectureIPRProduction Engineering II/ /2017 𝐩) 𝐜𝐨𝐧𝐬𝐭𝐚𝐧𝐭 𝐭 𝐢Fig. (1-1): Flow regimes.Types of Reservoirs and Radial Flow in the ReservoirsIn general, reservoirs are conveniently classified on the basis of the location of thepoint representing the initial reservoir pressure pi and temperature T with respect to thepressure-temperature diagram of the reservoir fluid. Accordingly, reservoirs can beclassified into basically two types. These are:1. Oil reservoirs: If the reservoir temperature T is less than the critical temperatureTc of the reservoir fluid, the reservoir is classified as an oil reservoir.2. Gas reservoirs: If the reservoir temperature is greater than the criticaltemperature of the hydrocarbon fluid, the reservoir is considered a gas reservoir.5
Petroleum DepartmentFourth StageLectureIPRProduction Engineering II/ /2017 Oil ReservoirsDepending upon initial reservoir pressure pi, oil reservoirs can be sub-classifiedinto the following categories: Under-saturated oil reservoir: If the initial reservoir pressure pi (as representedby point 1 on Figure (1-2), is greater than the bubble-point pressure pb of thereservoir fluid, the reservoir is labeled an under-saturated oil reservoir. Saturated oil reservoir: When the initial reservoir pressure is equal to the bubblepoint pressure of the reservoir fluid, as shown on Figure (1-2) by point 2, thereservoir is called a saturated oil reservoir. Gas-cap reservoir: If the initial reservoir pressure is below the bubble pointpressure of the reservoir fluid, as indicated by point 3 on Figure (1-2), the reservoiris termed a gas-cap or two-phase reservoir, in which the gas or vapor phase isunderlain by an oil phase. The appropriate quality line gives the ratio of the gas-capvolume to reservoir oil volume.Fig.(1-2): Typical P-T diagram for a multicomponent system.6
Petroleum DepartmentFourth StageLectureIPRProduction Engineering II/ /2017Reservoir Drive MechanismsIdeally the hydrocarbons are recovered from the reservoir pore spaces by exploitinga drive mechanism, precluding the need for artificial method. Drive mechanisms have twoclassifications:1. Internal drive: Using the internal energy of the reservoir configuration.2. External drive: Which involves the invasion of the pore spaces by a replacementfluid, this type of drive called "Secondary recovery or Enhanced oil recovery".1) Internal driveThis is known as primary recovery, which includes three drive mechanisms seeFigure (1-3):1. Depletion or internal gas drive2. External gas cap drive3. Water drive1) Depletion or internal gas driveThe compressibility of oil and water is relatively small. As soon as productioncommences, it is accompanied by a rapid drop of pressure in the producing zone whichsoon reaches the bubble point of entrained gas. Initially, this gas is dispersed, but itrapidly expands and assists in dispelling the oil. Eventually, however, the gas will startto form a gas front, which, having more mobility than the oil, will increase theproduction gas to oil ratios. This depletion or dissolved gas drive is characterized by arapid decline in reservoir pressure and by the recovery of only a small percentage ofthe oil in situation, e.g. 5 to 20% maximum see Figure (1-4).7
Petroleum DepartmentFourth StageLectureIPRProduction Engineering II/ /2017Fig. (1-4): Depletion or internal gas drive.2) External gas cap driveWhere the oil has a gas cap, the gas cap pressure together with the pressure ofgas in solution tends to maintain pressure in the reservoir much longer than depletiondrive. Therefore, gas cap reservoirs have higher recovery rates e.g. 20 to 40% seeFigure (1-5).8
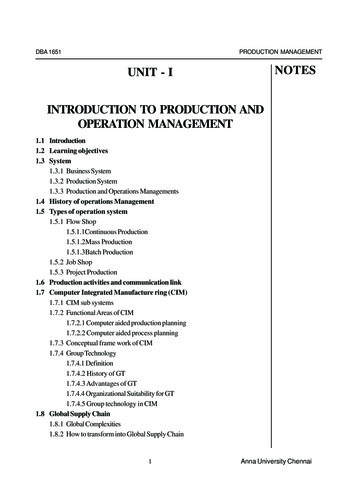
Petroleum DepartmentFourth StageLectureIPRProduction Engineering II/ /2017Fig. (1-5): External gas cap drive.3) Water driveWater drive is characterized by large local deposits of water which expand aspressure is reduced in the reservoir. Eventually, recovery will decrease due to thegreater mobility of the water front which eventually breaks through to the wellborewith increased water to oil ratios. Nonetheless, water drive is the most efficient of allthe drive mechanisms and can produce recovery rates as high as 60% see Figure (1-6).All three-drive mechanisms may be present to varying degrees at the same timealthough one will predominate see Figure (1-7).9
Petroleum DepartmentFourth StageLectureIPRFig. (1-6): Water Drive Mechanisms.Fig. (1-7): Combined Drive Mechanisms.10Production Engineering II/ /2017
Petroleum DepartmentFourth StageLectureIPRProduction Engineering II/ /2017Fig. (1-8): Reservoir – Pressure Trends for Various Drive Mechanisms.1) External driveIf fluid is injected into a well so that the volumetric rate of fluid replacement is equalto the volumetric rate of fluid extraction, then the average reservoir pressure will tend toremain constant. Injection stimulates secondary recovery.Depending on the type and configuration of the reservoir, pressure can be maintainedtherefore by:1. Gas injection2. Water injection3. Miscible and immiscible fluid injection.In general, gas is injected into the crest, and water injection into the base orperiphery of the reservoir. Particular consideration must be given to the quality of theinjection fluid. They must be compatible with existing reservoir fluids, filtered to preventformation plugging, possess a viscose significantly higher than formation water. Variationin reservoir permeability, and injection rate should also be considered. If the injection rateis excessive, the water front may advance unevenly, thus giving rise to early waterbreakthrough, or to unstable coning round the borehole.11
Petroleum DepartmentFourth StageLectureIPRProduction Engineering II/ /2017Well PerformanceA simple producing system is illustrated in Figure (1-9).Fig. (1-9): Simplified hydrocarbon production system.The hydrocarbon fluid flows from the reservoir into the well, up the tubing, alongthe horizontal flow line and into the oil storage tank. During this process the fluid’spressure is reduced from the reservoir pressure to atmosphere pressure in a series ofpressure loss processes Figure (1-10):1) Across the reservoir2) Across the completion (perforation/gravel pack etc.)3) Across the tubing and any restrictions4) Across the sub surface safety valve5) Across the surface choke6) Across flowline12
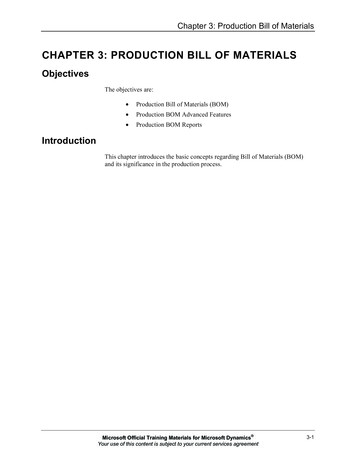
Petroleum DepartmentFourth StageLectureIPRProduction Engineering II/ /2017These pressure losses can be grouped into three main components:1) Summarizes the total pressure losses in the reservoir and completion2) Summarizes the total pressure losses in the tubing3) Summarizes the total pressure losses at the surfaceA pump or compressor is often used to aid evacuation of fluids (gas/water/oil) from theseparator. The separator is operated under gas pressure control and liquid (oil and water)level control. Hence it normally acts as the end point of the flowing system since a pump isnecessary to aid evacuation of the liquids from the separator.Fig. (1-10): Pressure Losses during Production.13
Petroleum DepartmentFourth StageLectureIPRProduction Engineering II/ /2017PR: Reservoir PressurePwfs: Flowing sand face PressurePwf: Flowing Bottom Hole PressurePUR: Upstream Restriction PressurePDR: Downstream Restriction PressurePUSV: Upstream Safety Valve PressurePDSV: Downstream Safety Valve PressurePWH: Well Head PressurePDSC: Downstream surface Choke PressurePsep: Separator PressureThe magnitude of these individual pressure losses depend on the reservoir propertiesand pressures; fluid being produced and the well design. Production Technologists/Engineers need to understand the interplay of these various factors so as to designcompletions which maximize profitability from the oil or gas production. There are nostandard “rules of thumb” which can be used. Figure (1-11) schematically represents thepressure distribution across the production system shown in Figure (1-10). It identifiesthe most significant components, flowline, tubing and the reservoir and completion wherepressure losses occur.Fig.(1-5): Pressure across production system.14
Petroleum DepartmentFourth StageLectureIPRProduction Engineering II/ /2017Inflow Well PerformanceThe flow of oil, water and gas from the formation into the bottom of the well (Wellbore), is typified, as far as gross liquid production is concerned, by PI (Productivity Index)of the well or, more generally, by the IPR (Inflow Performance Relationship). The analysisof the production performance is essentially based on the following fluid and wellcharacteristic; Fluid PVT Properties. Relative permeability data. Inflow performance relationship (IPR) & productivity index (PI). Productivity Index (PI) & Inflow Performance Relationship (IPR)A commonly used to measure of the ability of the well to produce (give fluids) is theProductivity Index (PI), denoted by J. Productivity Index is the ratio of the total liquidflow rate to the pressure drawdown and could present as a plot of Pwf versus q. as shownin Figure (1-12).Fig. (1-12): Pwf vs Q.The producing pressure Pwf at the bottom of the well is known as the flowing BHP, andthe difference between this and the well's static pressure Ps is the drawdown;Drawdown Ps - PwfThe productivity index is given by;15
Petroleum Department𝐏𝐈 𝐉 𝐐𝐨𝐏𝐬 𝐏𝐰𝐟 𝐐𝐨 𝐩Fourth StageLectureIPRProduction Engineering II/ -------------------------------- (1.1)Where:q Oil flow rate, STB/dayJ Productivity index, STB/day/psiPs Static pressure (volumetric average drainage area pressure, pr), psiPwf Bottom-hole flowing pressure, psiThe productivity index is generally measured during a production test on the well.The well is shut-in until the static reservoir pressure is reached. The well is then allowedto produce at a constant flow rate and a stabilized bottom-hole flow pressure.It is important to note that the productivity index is a valid measure of the wellproductivity potential only if the well is flowing at pseudosteady state conditions.Therefore, in order to accurately measure the productivity index to a well, it is essentialthat the well is allowed to flow at a constant flow rate for a sufficient amount of time toreach the pseudostead state as illustrated in Figure (1-13). The Figure indicates thatduring the transient flow period, the calculated values of the productivity index will varydepending upon the time at which the measurements of Pwf are made.Fig. (1-13): Productivity Index during Flow Regimes.16
Petroleum DepartmentFourth StageLectureIPRProduction Engineering II/ /2017The productivity index can be numerically calculated by recognizing that J must bedefined in terms of semisteady-state flow conditions;𝐪𝐨 𝟎.𝟎𝟎𝟎𝟕𝟎𝟖 𝐤 𝐨 𝐡(𝐏𝐫 𝐏𝐰𝐟 )𝐫𝛍𝐨 𝐁𝐨 [𝐥𝐧(𝐫 𝐞 ) 𝟎.𝟕𝟓 ----------------------------- (1.2)𝐰Combine Eq. (1.1) with Eq. (1.2);𝐉 𝟎.𝟎𝟎𝟎𝟕𝟎𝟖 𝐤 𝐨 𝐡𝐫𝛍𝐨 𝐁𝐨 [𝐥𝐧(𝐫 𝐞 ) 𝟎.𝟕𝟓 --------------------------------- (1.3)𝐰Since most of the well life is spent at a flow regime that is approximating thepseudosteady-state, the productivity index is a valuable methodology for predicting thefuture performance of wells. Further, by monitoring the productivity index during the lifeof the a well, it is possible to determine if the well has become damage due to completion ,workover, production, injection operations, or mechanical problems. If a measured J hasunexpected decline, one of the indicated problems should be investigated.The productivity index may vary from well to well because of the variation inthickness of the reservoir; it is helpful to normalize the indices by dividing each by thethickness of the well. This is defined as the specific productivity index (Js).𝐉𝐐𝐨𝐡𝐡(𝐏𝐬 𝐏𝐰𝐟 )𝐉𝐬 --------------------------------- (1.3)Assuming that the well's productivity index is constant, Eq. (1.1) can be rewritten as:Qo J (Ps - Pwf) J p ---------------------------- (1.4)Eq. (1.4) indicates that the relationship between q and p is a straight line passingthrough the origin with a slope of J as in figure (1-14).17
Petroleum DepartmentFourth StageLectureIPRProduction Engineering II/ /2017Fig. (1-14): q vs. p relationship.Alternatively, Eq. (1.1) can be written as:𝐏𝐰𝐟 𝐏𝐬 ----------------------------------------------- (1.5)The above expression shows that the plot Pwf against q is a straight line with aslope of (- 1/J) as shown schematically in Figure (1-15). This graphicalrepresentation of the relationship that exists between the oil flow rate andbottom-hole flowing pressure is called the Inflow Performance Relationshipand referred to as IPR.18
Petroleum DepartmentFourth StageLectureIPRProduction Engineering II/ /2017Fig. (1-15): IPR.Several important features of the straight-line IPR can be seen in Figure (1-15); When Pwf equals average reservoir pressure, the flow rate is zero due to the absenceof any pressure drawdown. Maximum rate of flow occurs when Pwf is zero. This maximum rate is calledAbsolute Open Flow and referred to as AOF. Although in practice this may not be acondition at which the well can produce, it is a useful definition that has widespreadapplications in the petroleum industry, (comparing flow potential of different wellsin the field). The AOF is then calculated by;AOF J PS --------------------------------- (1.6) The slope of the straight line equals the reciprocal of the productivity index.19
Petroleum DepartmentFourth StageLectureIPRProduction Engineering II/ /2017Inflow Performance TestThe following stepwise procedure is offered for obtaining data in an inflowperformance test:1) Closed the well (shut in) for (24-72 hrs) to obtained pressure build up test.2) With the recording pressure gauge on bottom, place the well on its lowestproduction rate and obtain a flowing pressure recording. Ample time must beallowed for the production rate and flowing BHP to stabilized. If possible at least48 hours should be allowed for each rate. (The well open to flow for 48 hrs inorder to reach the stabilized condition, pseudo steady state regime).3) After that change the well production rate for different values of rates andrecorded the BHP for each rate, allowing approximately 48 hrs to production (atleast three values).4) Plot IPR curve (q vs. pwf) on Cartesian paper.5) Again shut the well in and obtain a BHP buildup survey.20
Petroleum DepartmentFourth StageLectureIPRProduction Engineering II/ /2017Importance of Knowing the IPR of a WellAn allowable production from a certain well 50 bbl/day (only oil, zero watercut), in order to make the allowable rate, a pump has been installed in the well. For thefirst few years of its life, the well has produced 50 bbl/day. However, recentlyproduction has been less than the allowable.One of two things has happen:1. The reservoir (formation) is no longer capable of producing from the well 50bbl/day.2. There is some mechanical defect in the well's equipment resulting in a lowlifting efficiency (from the bottom of the well to the surface). To know theexact problem that cause the reduction in production is to determine thewell's IPR. The result might be either as shown in Figure (1-16) curve.Fig. (1- 16): IPR showing formation incapable of desired production rate.If the IPR were as illustrated in Figure (1-16A), the well's owner could be certainthat no amount of pump changing would result in a production rate of 50 bbl/day andwould either have to become reconciled to a below-allowable rate or else undertake aformation-stimulation workover such as a fracturing or an acidizing job. If, on the otherhand, the IPR were as illustrated in Figure (1-16B), the owner would be reasonably sure21
Petroleum DepartmentFourth StageLectureIPRProduction Engineering II/ /2017that a mechanical workover of the equipment in the well would restore production to itsallowable rate.As a second example of the importance of knowing the IPR, suppose that a companyhas been carrying out a formation-stimulation program on some of its wells and that togauge the success of this program, "before" and "after" production-rate, figures are used.Let the results on two wells (both cutting zero water) be as follows:WellABefore treatment60, flowing1 week after treatment100, flowingB35, pumping36, pumpingThe treatment would probably be accounted successful on well A and unsuccessfulon well B. but while this may in fact be true, insufficient evidence has been presented towarrant such a conclusion; the before and after IPR s of the well's might be as illustratedin figures (1-17) and (1-18).Fig. (1-17) formation stimulation a failuredespite increased production rateFig. (1-18) formation stimulation a successdespite unaltered production rateThe treatment has had no effect at all on the IPR of well A; that is, the formationinflow performance has not been improved in any way, so the treatment was completely22
Petroleum DepartmentFourth StageLectureIPRProduction Engineering II/ /2017unsuccessful. The production increase from 60 to 100 bbl/day was fortuitous and mighthave been caused by the treatment dislodging some tubing obstruction, by different-sizedtubing having been run into the hole after the job or by a different choke having beeninserted in the flow line at the surface.On the other hand, the treatment on well B has increased the formation's potentialconsiderably and was an undoubted success. Why then were the before and after ratesalmost identical? There are several possible reasons: the pump might not have beenproperly seated after the treatment; the pump might have been damaged in some waywhen it was pulled for the treatment to be undertaken; the producing GOR of theformation might have been increased by the treatment, resulting in reduced pumpefficiencies; or the truth of the matter may lie with one or more of various other possibleexplanation.Factors Influencing Shape of IPRThe discussion that follows will concentrate on effects resulting from the pressureof free gas in the formation and, consequently, will lead to some conclusions relating tothe dependence of producing GLRs on drawdown. In oil reservoir, gas does not be freeuntil BHP of formation reaches value less than bubble point pressure value. So at pressurebelow bubble point pressure gas being free and the free gas could moving when saturationof free gas (Sg) be greater than critical gas saturation (Sgc, at this value gas be able tomoving).It is evident from the form of the radial- flow equation that the greater part of thepressure drop (from static pressure to flowing BHP) in a producing formation occurs inthe neighborhood of the well bore (pressure drop is occurring within 20 ft of the wellbore).Suppose the flowing BHP at the well is below the bubble point of the oil. As oilmoves in toward the well, the pressure on it drops steadily, allowing gas to come out ofsolution. The free gas saturation in the vicinity of the oil body steadily increases, and sothe relative permeability to gas steadily increases at the expense of the relative23
Petroleum DepartmentFourth StageLectureIPRProduction Engineering II/ /2017permeability to oil. The greater the drawdown, that is, the lower the sand-face pressure atthe well , the more market this effect will de , so that it would be reasonable to expect thePI (which depends on the effective oil permeability) to decrease and the producing GOR(which depends on the effective gas permeability) to increase as the drawdown isincreased. Such an argument leads to the conclusion that a curved IPR, as shown in Figure(1-19), is to be expected whenever the flowing BHP is below the bubble-point pressure.Last as long as the value of the flowing BHP remains above the saturation pressure,no free gas will be evolved in the formation and the PI will remain constant; that is, theportion of the IPR applicable to values of the flowing BHP higher than the saturationpressure will be a straight line, as shown in Figure (1-19).Fig. (1-19): Pwf vs. q.1. Stratified FormationPractically every production formation is stratified to some extent; that is to say, itcontains layers of differing permeability. To illustrate the type of effects that suchstratification may have upon the shape of the IPR and upon the dependence of GOR onproduction rate, consider an example in which there are three different zones havingpermeabilities of 10,100, and 1 md, respectively. It will be assumed that there is novertical communication between the zones, except through the well bore itself as shown inFigure (1-20). Production from this formation will evidently be drawn chiefly from the24
Petroleum DepartmentFourth StageLectureIPRProduction Engineering II/ /2017100 md zone, with the result that the static pressure in this zone will drop below those inthe other two, the 1 md zone exhibiting the highest static pressure.Fig. (1-20) Idealized stratified formation.Suppose that a stage has been reached in which the pressure in the 100 md zone is1000 psig, that in the 10 md zone is 1200 psig, and that in the 1 md zone is 1500psig, thewell is now tested at various production rates to establish the IPR. If the individual IPRs ofthe three zones are as illustrated in Figure (1-21), the composite IPR, which will be thesum of these three curves, will have the shape shown. It follows as a generalization thatmany wells will, because of stratification and subsequent differential depletion of thezones on production, exhibit a composite IPR curve of the type illustrated in Figure (1-22)that is the say, an improving PI with increasing production rate at lower rates, but adeteriorating PI at the higher rates.Fig. (1-21): Composite IPR for heterogeneous formation.25
Petroleum DepartmentFourth StageLectureIPRProduction Engineering II/ /2017Fig. (1-22): Typical IPR Curve.At the low rates the flowing BHP will be high and only the higher-pressured layerswill contribute to the production. These layers will be those with the greater degree ofconsolidation and cementing, that is, with the higher values of the gas/oil permeabilityratio. In other words, the producing layers at the low rates of flow are those whichproduce with a high GOR.As the well’s rate of production is gradually increased, the less consolidated layerswill begin to produce one by one (at progressively lower GORs) and so the overall ratio ofthe production will fall as the rate is increased. If, however, the most highly depletedlayers themselves produce at high ratios owing to high free gas saturation.2. Effect of water cut on IPRIf water is moving from the water source to the well stringers in the formation, it ispossible to determine whether, at the well bore, the pressure in the water is greater thanor less than the pressure in the oil sands (that is, whether it is high-pressure or lowpressure water) from an analysis of the gross IPR and three or four water-cut values takenat different gross rates. The method of approach may be illustrated by means of anexample.26
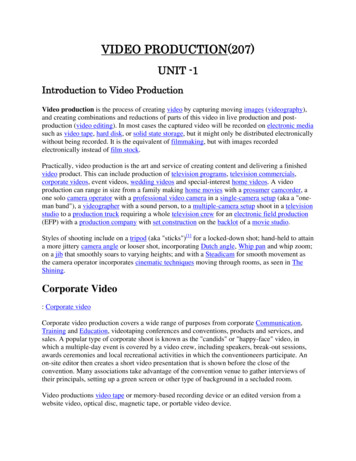
Petroleum DepartmentFourth StageLectureIPRProduction Engineering II/ /2017Problem (1-1): A series of tests is made on a certain well with the following results;Gross rate, bbl/daywater cut, water/gross%flowing BHP,psig4785130090609201254863016245310Determine the static pressure and the productivity index of the oil and water zones,respectively. Based on the results, at what rate could water be expected to flow into the oilsand if the well left shut down?Referring to Figure (1-23).Fig. (1-23): IPR and water-cut curves: high-pressure water.The first step is to plot the gross IPR (line 1).From the gross rate and the measured water cuts the water and oil IPRs are calculated asfollows (line 2 and 3):qo qt - qw ----------------------------------------- (1.7)qo qt (1- qw/qt) --------------------------------- (1.8)qo qt (1- wc) ----------------------------------- (1.9)27
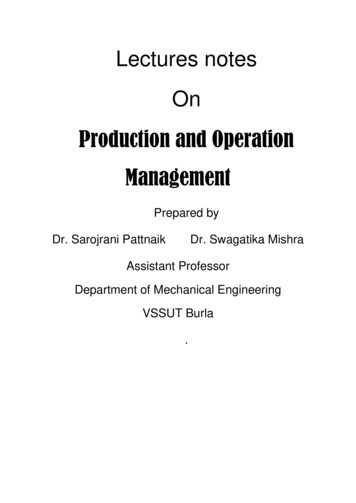
Petroleum DepartmentGross rate,bbl/dayFourth StageLectureIPRwater cut,water/gross%478590601254816245Then plot water cut ratio versus gross rate.waterrate,bbl/day40546073Production Engineering II/ /2017oil rate,bbl/dayflowing BHP,psi73665891300920630310Evidently, from the figure,Static pressure of oil zone 1350 psigPI of oil zone 120/1350 0.089 bbl/(day)(psi)Static pressure of water zone 2600 psigPI of water zone 82/2600 0.0315 bbl/(day)(psi)When the well is shut in, it might be expected (from the gross IPR) that the BHPwould stabilized at about 1700 psig and that water would flow into the oil zone at some28 bbl/day.It is of interest to note the shape of the water cut versus rate curve (alsoshown on Figure (1-23), which is typical of high-pressure water, namely, a 100percent cut (pure water) is obtained at low rates, the oil content graduallyincreasing with the offtake rate. In Figure (1-24) the case of low-pressure wateris similarly illustrated, and the typical water cut versus rate curve is shown;namely, the cut starts at or near zero and increases with rate.28
Petroleum DepartmentFourth StageLectureIPRProduction Engineering II/ /2017Fig. (1-14): IPR and water-cut curves: low-pressure water.Problem (1-2): A productivity test was conducted on a well. The test results indicate thatthe well is capable of producing at a stabilized flow rate of 110 STB/day and a bottomhole flowing pressure of 900 psi. After shutting the well for 24 hours, the bottom-holepressure reached a static value of 1300 psi.Calculate: Productivity index AOF Oil flow rate at a bottom-hole flowing pressure of 600 psi Wellbore flowing pressure required to produce 250 STB/daySolution:1- J qPr Pwf29
Petroleum DepartmentJ 1101300 900Fourth StageLectureIPRProduction Engineering II/ /2017 0.275 STB /psi2- AOF J (Pr 0)AOF 0.275(1300 0) 375.5 STB /day3- Q o J(Pr Pwf )Q o 0.257(1300 600) 192.5 STB / day14- Pwf Pr ( ) Q oJPwf 1300 (1) 250 390.9 psi0.275Equation (1.4) suggests that the inflow into a well is directly proportional to thepressure drawdown and the constant of proportionality is the productivity index.Muskat and Evinger (1942) and Vogel (1968) observed that when the pressu
3. Inflow performance relationship (IPR). 4. Effect of stratification and water cut on IPR productivity index test. 5. IPR methods, Vogel method, Standing method, Couto method, Fetkovich method, Al-Saadoon method. 6. Mathematical and physical principles for pressure drop calculations. 7. Flow pattern and its relation with pressure drop. 8.