Transcription
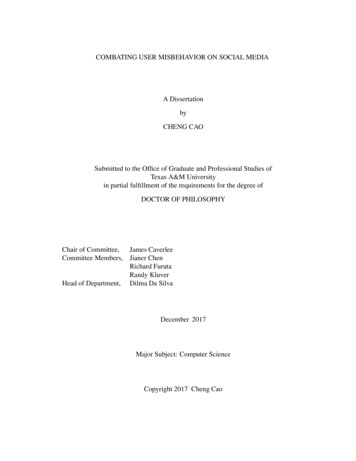
Detecting Control System Misbehavior byFingerprinting Programmable Logic ControllerFunctionalityMelissa Stockmana , Dipankar Dwivedia , Reinhard Gentza , Sean Peiserta, a LawrenceBerkeley National Laboratory, One Cyclotron Rd., Berkeley, CA, 94720, USA1. Introduction23456Programmable Logic Controllers (PLC) are ruggedized computing devicesused in process automation. They control processes such as manufacturing assembly lines, robotics, scientific instruments, and other machinery that requiressome sort of logic to regulate its function. PLCs are built to be simple in function, as in the process shown in Figure 1, and also tolerant of severe conditionssuch as moisture, high or low temperature and dust. PLCs have existed sincethe 1960s, before cyberattacks in the modern sense were conceived of, and alsobefore remote network access to PLCs was considered. Early PLCs used serialconnections, and only much more modern PLCs have acquired network communication capabilities via TCP/IP in the form of Modbus known as ModbusTCP, and other, similar protocols. Because PLCs can control valuable, physical equipment, and because control systems can have physical consequencesto equipment and human life, their secure operation is critical to maintaining safety [1]. False outputs can have catastrophic consequences, as Zetter [2]demonstrates. Tampering with a PLC can have disastrous effects. Therefore,knowing that the correct program is running is essential to safety and security.Prior work has shown that non-intrusive load monitoring can be useful toinfer the functionality of electrical systems [3]. Recently, it has been shown thatpatterns in power current signals can be used to infer activity taking place ona computing system [4, §4]. We hypothesized that power signals (specificallycurrent and voltage) could also be used to detect such activity on a PLC. To testour hypothesis, we conducted experiments running different PLC programs. Wealso examined the relative importance of various features in the classification ofthese programs. This paper reports on our approach and our results.This paper is organized as follows. Section 2 discusses related work on poweranalysis and machine learning to classify signals. Section 3 briefly describes how CorrespondingauthorEmail addresses: melissa.stockman1@gmail.com (Melissa Stockman), ddwivedi@lbl.gov(Dipankar Dwivedi), rgentz@lbl.gov (Reinhard Gentz), sppeisert@lbl.gov (Sean Peisert)Preprint submitted to Elsevier1March 2, 132
Programming DeviceInput ModuleInput SensingDevicesCentralProcessing UnitMemoryProgram DataOutput ModuleOptical IsolationOptical IsolationOutputLoad DevicesPower SupplyPLC SystemFigure 1: A PLC with inputs, outputs, a power supply, and external programming devices.38we collected data for this power analysis. Section 4 discusses various approachesto conduct the classification of time series data, while Sections 5 and 6 illustratethe experimental framework used in this study to conduct and evaluate theclassification of PLC programs. Subsequently, we describe results in Section 7followed by conclusions in Section 8. Finally, we discuss some limitations andfuture work in Section 9.392. Related wer analysis has long been used for non-intrusive load monitoring. Hart [3]was among the first to apply the technique for identifying physical systems bytheir power signatures. More recently, Gillis and Morsi [5] used a single powersensor to detect, if and which breaker in an electric system is open and closed,respectively. The task was to specify the start time of such events, with verycharacteristic switching signals in the data. The authors used wavelets with asupervised and unsupervised learning approach. Liebgott and Yang [6] used anactive learning approach to identify the usage patterns of a set of householdappliances which was similar to the previous work in that it also identified thestart and end signatures in noisy measurement data.In computing, power analysis was one of the first methods to extract hiddeninformation from computing devices. Cryptographic keys have been a particular target of such techniques [7]. In addition, computation stages have beenderived from power analysis [8]. Power consumption has been exploited for avariety of other purposes including the identification of Trojans in integratedcircuits [9] and to expose a wide spectrum of system-level host information ingeneral computing container clouds [10].2
Also related to our work is the use of machine learning for signal classification. Llenas et al. [11] studied the performance of machine learning models forclassifying wireless signals using a sampling of the power of the signal over time.Acharya et al. [12] used a convolutional neural network (CNN) to distinguishbetween normal and myocardial infarction (MI) ECG signals. Most recently,Copos [4, §4] identified programs running on high-performance computing machines, applying frequency and wavelet analysis to power signatures.Our approach is different from these existing approaches in that, to the bestof our knowledge, none of these prior approaches has attempted to identify theactivity running on a PLC. At the same time, our approach builds on essentiallyall of this prior work by leveraging both data sources (current and voltage) aswell as analysis techniques.3. Data Collection57585960616263646566676869A phasor measurement unit (PMU) is a device that measures electrical waves[13]. Specifically, it measures voltage magnitude, voltage angle, current magnitude, and current angle (i.e., a phasor [14]). We generated and collected thedata by running different PLC programs on a single Siemens Simatic S7-1200PLC [15] and collecting power results using a distribution-level PMU (termed a“micro-PMU” or“µPMU” [13]), manufactured by Power Standards Laboratory,that measures power signals at 512 samples per cycle, 60 cycles per second, andoutputs samples at 120 samples per second — a much higher frequency thantypical transmission level PMUs. We monitored the power draw of the PLCwith a dedicated current loop that fed into the µPMU.We sequentially deployed 10 different ladder logic programs (a graphical,low-level programming language) to the PLC that represented typical workloads (see Table 1). The programs were chosen with two criteria in mind. Thefirst was that they should exercise different parts of the PLCś functionalityi.e. networking, analog-to-digital conversion etc. We chose these programs asdistinguishable from each other in a relatively major way. We then chose someprograms that had overlapping PLC functionality. We did this to make our taskmore challenging and we were interested in determining if even small changesto the same program could be identified.We collected and labeled µPMU data for each of the running programs.Additionally, an “idlestate” was recorded where the PLC was not running anycode. This enabled us to find a baseline for our supervised learning approach.We conducted several experiments namely exp6, exp7, exp8, and exp9 at different times by running different PLC programs. These different experiment runsallowed us to design and test simple and hard problems as described below.Goals and Threat Model. PLCs control a myriad of critically important systemsincluding gas pipelines, electrical power grids, railroad signals, and potable water distribution. Any malicious activity targeting this device could cause damageto equipment, failure of safety systems, or reckless release of hazardous material. Attacks on a PLC could come in the form of unauthorized 888990919293949596979899
112to the firmware, configuration alteration or changing the execution control flowas described in [16]. For our work, we define misbehavior of a PLC as the intentional manipulation of the ladder logic code to adversely affect the processbeing controlled. This type of attack could be used to incorrectly switch railway tracks, mix incorrect amounts of chemicals, disrupt electrical substationmachinery, cause tank pressure sensors to be read incorrectly, etc.Our goal was to determine if the currently running program was the correctprogram. In order to do this, we needed to distinguish between major and veryminor changes in the programs. Therefore some of the 10 programs were verysimilar to each other (i.e., a constant had a different value) while others werevery different. Each program was run for 2 minutes for a total of 14,400 “rows”(120 samples/second 120 seconds) of data containing voltage and currentmeasurements for each.1134. Description of the Classification Problem and 132133134135136137138139140141142The µPMU power data we collected was used to train our machine learning models. We attempted to classify the PLC programs based on the energyconsumption profiles recorded by the µPMU. Since current and voltage werechanging over time as the program was running, we looked at the problem ofdetermining which PLC program was running as a time series analysis problem.One approach to classifying time-series data is to use manually-engineeredfeatures from statistical properties of the signal. This approach typically includes examining attributes of a time series, such as minimum, maximum,mean, standard deviation, and frequency. These attributes can be used to inferproperties of the time series as a whole or for some distinct window of time.However, this approach often requires some domain knowledge about the data,such as specific frequency bands and other statistical properties. Image classification problems are examples of this approach, where manually-engineeredfeatures are used by applying certain filters to the image data. Another approach to classifying time-series data is in the time domain. In contrast tousing manually-engineered features for classification problems, in this approachthe data is looked at, point by point, sequentially.To classify each program using the µPMU power data, we tried several different machine learning approaches including Support Vector Machines (SVM),K-Nearest Neighbor (KNN), Random Forests (RF), and Convolutional NeuralNetworks (CNN). In the end, we chose RFs due to their ability to classify largedatasets accurately with computational tractability, and CNNs due to their accuracy and ability to classify the data without having to use pre-built filters.To test the performance of our models, we used two scenarios representingbasic and difficult classification problems as defined in Section 5. In both scenarios we also classified programs with significant changes among themselves.The overall accuracy of each model was calculated by exact match accuracy —that is, the total number of correctly classified programs divided by the totalnumber of all the samples.4
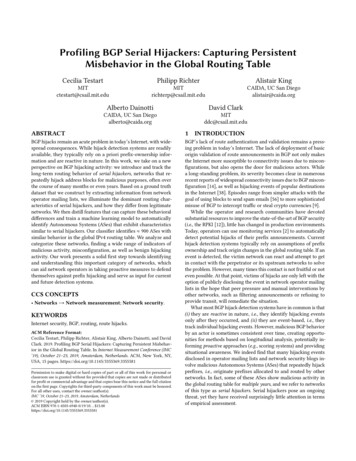
Figure 2: A Schematic of a Random Forest Classifier Random Forest Classifier.n1XI(Yi Zi )n i 1where I is the indicator function.1434.1. Random Forest (RF)We selected the random forest classifier due to its computational efficiencyon large datasets and its ability to handle a large number of input variablesas well as its ability to generalize well. Additionally, random forests show theimportance of features in the classification which would assist us in decidingwhich features to keep in our models.To best describe the random forest classifier, we first describe a decision treeclassifier. Decision tree classifiers [17] are simple yet powerful models whichemploy a divide and conquer approach to classification. Data is recursivelypartitioned into sections based on the best split which separates out one class.The right side of Figure 2 shows a magnified decision tree.Random Forests are collections of these decision trees as shown on the leftside of Figure 2. For each sample of data, a number of decision trees’ results areaggregated. The final output is then the class that was predicted the most bythe individual decision trees. For our Random Forest model, we leveraged theRandomForestClassifier [18] as part of the scikit-learn package [19] with defaultparameters.4.2. Convolutional Neural Networks (CNN)Convolutional Neural Networks (CNN) are designed to recognize patternsin images directly from the pixel representation of an image [20]. We decidedto try this approach on our dataset, since the current magnitude over time canbe thought of as a “picture” of the running PLC program. The input valuesare related positionally to each other, i.e., nearby values in the time-series ofcurrent magnitude are extremely related.A CNN, in contrast to RF, does not require complex feature engineering.Data can be input “as is” into the classifier. This is key because a highly 7158159160161162163164165166167168169
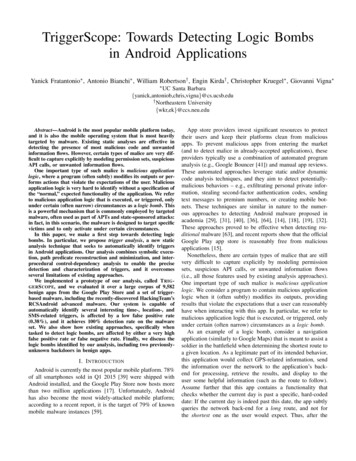
170171172173174175176177model can be trained without the need for domain expertise regarding the PLCprograms. The training phase learns “filters” which become more complex asthe data propagates through deeper and deeper layers. CNNs recognize simplepatterns in the initial layers building up to much more complex patterns in thefinal layers. They extract local features by constraining the reactive region ofthe hidden layers to small local patches. Passing through the layers, neuronsbecome related to each other, and some become more influential than others.Figure 3 shows a typical CNN.Figure 3: A Schematic of a typical Convolutional Neural Network.178179180181182183184185186187188189190For any machine learning model, it is important to guard against overfittingthe data. That is, it is necessary to avoid creating a model that is too highlytuned to the idiosyncrasies of the training dataset and hence does not performwell on new data. For CNNs, using a “dropout layer” randomly selects neuronsso as not to continually use the most influential ones as predicting the finaloutput. This guards against overfitting by allowing the network to learn differentviews of the data.We used Tensorflow [21], an open source library developed by Google fordataflow programming of highly computational applications to implement ourneural network model. The CNN was composed of three layers: two convolutional layers, then a fully connected layer. The “Softmax” activation functionwas used. It maps the output to c classes as a set of probabilities. The highestprobability class is assigned as the predicted class.Table 1: PLC Program DescriptionNetworkingIdlestateprogram 3program 4program 5program 6program 7 clientprogram 7 serverprogram 8program 9program 10ADCDigital outxxxxxxxxxxxxDescriptionCPU in stop stateReads from Modbus, runs a function on the data and returns decision via ModbusMakes LEDs blink (1s period)Read switch status and displays on build in LED (all off)Reads analog value and sends it via modbusversion 2 of program 6version 2 of program 3version 3 of program 3 (debug variables present in program)PROFINET Clientversion 3 of program 3 (release version/no debug variables)6
5. Experimental Scenarios191Our experiments were broken up into two different scenarios. These scenarioswere of particular interest for testing our hypothesis and being able to use thecurrent approach in monitoring potential real-time manipulation of the PLC.We describe them in the following subsections.5.1. Scenario 1192193194195196First, we combined all datasets (experiment runs 6, 7, 8, and 9) togetherand used the result of 5-fold cross validation as the performance indicator. Weconsidered this scenario a useful starting point. Combining all datasets into onebig dataset, and subsequently using cross-validation led to higher accuracy thanScenario 2. This was due to the fact that cross-validation’s random selection ofthe training set contained a small amount of data from each run with its specificrandom noise, thereby letting the classifier learn the random information for thatrun. This approach would perform well in an online situation where trainingdata would continuously be added to update the model.5.2. Scenario 2197198199200201202203204205206Scenario 2 involved training the classifier on three separate datasets (e.g.,experiment runs 6, 7, and 8) and testing on the fourth dataset (e.g., experiment9), i.e., 4-fold cross validation with completely different datasets. This problemwas more complex than Scenario 1 because experiments were carried out atdifferent times of the day and different days, and each dataset was subject toinfluence by external factors such as voltage fluctuations and temperature. Thisscenario was used to test the robustness of a fixed model that could be trainedonce and used statically any time in the future without the need for additionalonline training data. In this scenario, we report the performance measures asthe average accuracy achieved for individual classifications of each dataset whiletraining on the rest of the three datasets.6. Classification of PLC Programs for Different ScenariosThese scenarios posed significant challenges in classifying PLC programs.Considering the complexity of the classification problem at hand, both time andfrequency domains were deemed necessary for our analysis. Therefore, in orderto detect subtle differences between PLC programs, we tested our scenarios inboth the time and frequency domains individually. This allowed us to moregranularly tune our machine learning models’ metaparameters.The µPMU power data was a time series of electrical information collectedfrom the power draw of the attached PLC. It included current magnitude andangle, and voltage magnitude and angle. The data was labeled for each PLCprogram run, plus the “idlestate” as described in Section 2223224225226227228
622632642652662672682692702712726.1. Feature EngineeringWe applied feature engineering techniques to the data including rolling averages, time-lagged windows and Butterworth filters.The rolling average data was created by calculating the average of the datapoints over a window of time. This window was then slid through the entireoriginal dataset to create a new dataset. Rolling averages have the effect ofsmoothing the data. Because it averages all features in a window of time, itremoves the small variations between successive time intervals which could bedue to noise. This allowed our machine learning models to more readily focuson the signal rather than the noise.For time-lagged windows, we combined consecutive values of the currentmagnitude to form a much larger row of input features we defined as a “lagwindow.”Let T be a time series of length n, a lag window Wx of T is a sampling oflength w n of contiguous positions from T , such that Wt tx , .tx w 1 for1 x n w 1.We flattened m contiguous current samples into vectors. Each componentof the vector was a current magnitude at consecutive moments in time. We canthink of the m values of current magnitude as an m dimensional vector andnote that within this m dimensional space only a small number of “points” areassociated with a particular PLC program run.Because different PLC programs exhibit varying frequencies within certainbands in the spectrum, we used the Butterworth filter—a type of signal processing filter designed to mask unwanted frequencies, and known to give anespecially flat frequency response in the passband [22].Each of these techniques created an alignment-free framework which allowedfor the fact that the beginning and end points of the program runs were notnecessarily precisely aligned with the recorded start time. This was due to thefact that each program was started manually and the measurement granularity1ths of a second.of the µPMU was in 1206.2. PLC Program Classification in Time DomainIn the time domain, for scenario 1, we used current magnitude and angle, andvoltage magnitude and angle measurements. For scenario 2 we used only currentmagnitude and angle, as we noted that these measurements are determined bythe PLC itself and are not dominated by the surrounding environment since thePLC only consumes 3W as opposed to other possible noisy consumers in themeasurement environment that may consume hundreds of watts.In scenario 1 we used each set of timestamped values of these features, as aseparate row of input. We also applied rolling averages to these features. Forscenario 2, we applied rolling averages as well as a lag window.Through heuristics, we determined that the optimal size for the lag windowfor our data was approximately 6 seconds (m 720) and a window size of 20gave the best for the rolling average. That being said, this result is for our data,which, as with all data, has noise of various kinds. Other datasets may have8
different ideal lag windows and window sizes. In order to identify such datasets,procedures and guidelines are discussed in more detail elsewhere [23].6.3. PLC Program Classification in Frequency DomainWe converted time domain signals into the frequency domain using DiscreteFourier Transform (DFT) [24, 25]. We used individual time series describinga particular feature for a specific PLC program (e.g., the current magnitudefor idlestate), and subsequently, we computed frequencies using DFT. Liaw etal. [26] demonstrated that the accuracy of the RF classifier depends on howuncorrelated trees are in the forest. The more uncorrelated trees are in theforest, the more accurate the RF classifier. Therefore, to remove correlationsbetween trees as well as noise, and separate signals so that the individual treesare strong, we used rolling averages and Butterworth filters. Rolling averages(also known as moving averages) reduce the noise in the signals because of thesmoothing effect of averages, while Butterworth filters are more versatile andremove unwanted frequencies with a ripple free response [22]. Filter windowswere chosen based on the exhaustive search technique. For example, the RFclassifier was tested for multiple filter windows (sizes) that were slid throughthe spectrum.7. Results and 86287288289290291We discuss our results from Tables 2 and 3 separately for frequency and timedomains.We also discuss the confusion matrices that show the errors in our predictions. Columns are the predictions for each PLC program (or the “idlestate”).For example, in Figure 4a, the first column shows all samples predicted to be“idlestate”, the second column shows all samples predicted as r code10, etc.Rows represent the actual PLC program that was running (or the “idlestate”).The top row shows all samples where the PLC was actually in the “idlestate.”Moving along the row, the mispredictions for “idlestate,” and which programs itwas mispredicted as, are shown in the corresponding column. The matrix givesa summary of all mispredictions. All non-zero values outside the diagonal areincorrect predictions. A model with perfect prediction would have a confusionmatrix where all values not on the diagonal are zero.We display the confusion matrices as heat maps in order to illustrate the factthat even in the cases of some wrong predictions, the majority of predictionsfall into the correct class. This is important because if the model is used over a2 minute window of time, instead of each 0.2 seconds, accuracy would be 100%.We show our accuracy results based on the stricter time constraint to show thatour approach can be used to detect a program change within 0.2 seconds of 3304305306307308309310311
Table 2: Performance of the Random forest Classifier for two scenariosAll Programs4 Prog. StatesScenario 1WithoutWithRoll. Avg. Roll. Scenario 2WithWithFiltersa Filtersb24.6%28%28.3%83%Filtersa – low pass (with normalized cutoff frequency -2.5E-06)Filtersb – a low pass (with cutoff frequency -2.5E-06) cascaded with a bandpass filter (4thorder, low cutoff 45 Hz, high cutoff 55 447.1. Frequency DomainIt is clear from Table 2 that the RF classifier performed better for scenario1 than scenario 2. For scenario 1, the RF classified more than 70% of programsaccurately when we trained the classifier using all the datasets. Furthermore,the RF classifier’s performance improved from 70% to 77% when a rolling average window with a triangular window size of 120 samples (data worth 1 sec)was used in the frequency domain. The improved performance of the classifiercan be ascribed to the rolling average filter that reduced the noise in the signals. Similarly, when we used only four program states for classification, theRF classifier identified approximately 97.7% to 99.08% of the programs accurately with and without rolling average filters (Figures 4a and 4b), respectively.Correctly predicted programs are shown along the diagonal. The misclassifiedprograms ( 3%; for all programs) are spread across other cells and do not showany pattern, which shows that the RF classifier performed consistently. Thisparticular scenario was considered as a simple problem, and the RF classifierperformed remarkably. Indeed, when the classifier did not perform effectively,it was because of the noise in the dataset. Hence, using a rolling average filterimproved the classifier’s performance significantly.Scenario 2 was considered a hard problem, because here we trained theclassifier on a dataset (combining three different datasets) and testing on acompletely new dataset (fourth dataset). In this scenario, the RF classifierperformed poorly and was able to identify programs accurately only 11% and24% for for Scenario 1 and Scenario 2, respectively. However, when we used alow pass Butterworth filter, the RF classifier showed slight improvements from11% to 24% and from 24% to 28% for Scenario 1 and Scenario 2, respectively.The classifier performed poorly in identifying all programs (programs withmajor and minor differences). We then tested with a low pass Butterworth filtercascaded with a band pass Butterworth filter. This improved accuracy to 83%for the four program states (programs with major differences) (Figure 5b).Figure 6a compares frequency contents computed for the time series of thecurrent magnitude across four program states for Scenario 1. Here, we combinedall the datasets as described in Section 5. It is clear from Figure 6a that the frequency contents show different signatures across datasets for different programs;10
therefore, the RF classifier performed effectively for Scenario 1. Similarly, Figures 6b and 6c compare frequency contents computed for the time series of thecurrent magnitude across four program states for Scenario 2. Figure 6b showsfrequencies when a low pass Butterworth filter was applied, while Figure 6cshows frequencies when we filtered signals using low pass and band pass Butterworth filters. It is clear from the frequency contents (Figure 6b) that thereis no distinguishable pattern for the RF to detect. For example, r code9 showsdifferent amplitudes for each of the different datasets. Therefore, it is hard forthe classifier to perform effectively using these features. Furthermore, Figure6c demonstrates that there are frequency bands across the spectrum where theclassifier can grow strong trees, as frequency contents can be distinguished between programs (e.g., PLC programs). Accordingly, the classifier performedrelatively better with two filters despite Scenario 2 being a hard problem.7.2. Time Domain345346347348349350351352353354355356357358As shown in Table 3, for scenario 1, the performance of the RF model in thetime domain had 89% accuracy without rolling average and 97% with rollingaverage using all the available µPMU features (current magnitude and angle,voltage magnitude and angle). The accuracy with only 4 program states roseto 95% without rolling average and 99% with rolling average. When using completely different datasets for training and testing in scenario 2, the accuracydropped drastically to 20% and 30% with and without rolling average respectively. This was due to the fact that many of the programs were too similar todistinguish between. When reducing the PLC programs down to those that weresignificantly different, the RF model achieved a respectable 71% with rolling average and 76% with lag-windowed magnitude.Figure 7 shows the confusion matrix/heat map for scenario 1 for all programs using rolling averages. As can be seen, the mispredictions are distributedthroughout the matrix indicating that there was not a general confusion between any two particular programs and that our technique could be used oversome longer window of time to achieve 100% accuracy.Figure 8a shows the heatmap for scenario 2 using lag windows. This modelperformed relatively well at 76% accuracy.For the CNN model, we only used lag windows and did not perform rollingaverages. We did this because the CNN we used was originally designed forimage classification, thus we wanted our inputs to be similar to that of animage. For detecting all 10 programs, the CNN did not perform well, (40%in scenario 1 and 30% in scenario 2). We explain this with the fact that therandom noise in each experiment is larger than the signature change due to theminimal program changes. However, the CNN performed the best overall inboth scenarios for 4 program states at 84%. Of note is that the CNN performedthe same on the 4 program states in both scenarios. In this scenario the changesin programs were significant enough to clearly identify each program.Figure 8b shows that the majority of misclassifications occurred due tor code7client being predicted incorrectly as r code9. This may i
100 to the rmware, con guration alteration or changing the execution control ow 101 as described in [16]. For our work, we de ne misbehavior of a PLC as the in-102 tentional manipulation of the ladder logic code to adversely a ect the process 103 being controlled. This type of attack could be used to incorrectly switch rail-104 way tracks, mix incorrect amounts of chemicals, disrupt electrical .