Transcription
The Arizona Independent Redistricting Commission:One State’s Model for Gerrymandering ReformColleen Mathis, Daniel Moskowitz & Benjamin SchneerSeptember 2019
The Arizona Independent Redistricting Commission:One State’s Model for Gerrymandering ReformColleen Mathis, Daniel Moskowitz & Benjamin SchneerSeptember 2019
the arizona independent redistricting commission: One State’s Model for Gerrymandering Reformabout the authorsColleen Mathis is the chair of the Arizona Independent Redistricting Commission andan affiliate of the Institute for Quantitative Social Science at Harvard University.Daniel Moskowitz is an Assistant Professor in the Harris School of Public Policy at theUniversity of Chicago. His research examines how the media and electoral institutionsshape the behavior of voters and elite actors, and it assesses the consequences ofthese institutions on accountability and political representation.Benjamin Schneer is an Assistant Professor of Public Policy at the Harvard KennedySchool. His research is in American politics and focuses primarily on political representation: how citizens express their preferences, how government responds to them,and what may shape and distort these processes.about the ash centerThe Roy and Lila Ash Center for Democratic Governance and Innovation advancesexcellence and innovation in governance and public policy through research, education, and public discussion. By training the very best leaders, developing powerful newideas, and disseminating innovative solutions and institutional reforms, the Center’sgoal is to meet the profound challenges facing the world’s citizens. The Ford Foundation is a founding donor of the Center. Additional information about the Ash Center isavailable at ash.harvard.edu.This research paper is one in a series published by the Ash Center for DemocraticGovernance and Innovation at Harvard Kennedy School. The views expressed in theAsh Center Policy Briefs Series are those of the author(s) and do not necessarily reflectthose of Harvard Kennedy School or of Harvard University. The papers in this seriesare intended to elicit feedback and to encourage debate on important public policychallenges.This paper is copyrighted by the author(s). It cannot be reproduced or reused without permission.iii
the arizona independent redistricting commission: One State’s Model for Gerrymandering ReformcontentsExecutive Summary1Background3Key Findings and Observations from Arizona’s Experience4Public n Bias and Fairness13Practical Lessons15Conclusion16
the arizona independent redistricting commission: One State’s Model for Gerrymandering Reformexecutive summaryIn most states, redistricting, the process by which electoral district boundaries aredrawn, is an overtly partisan exercise controlled by state legislatures. Politicians fromthe party in power draw the lines that determine new congressional and legislativedistricts after each decennial census; often they adhere to a brutal partisan calculusthat privileges maintaining political power rather than reflecting the will of voters (thatis, legislators routinely engage in “partisan gerrymandering”).The U.S. Supreme Court’s 2019 decision Rucho v. Common Cause held that federal courts cannot review allegations of partisan gerrymandering.1 While extreme gerrymanders may not be democratic, the majority opinion suggested, the court should notwade into the “political thicket” to determine standards for what constitutes a partisan gerrymander. This decision likely blocks any attempts at systematically addressingpartisan gerrymandering at the federal level for the foreseeable future; for policymakers and concerned citizens, the second-best options involve implementing policychanges at the state level—for example, by amending state constitutions and creatingindependent redistricting commissions. Indeed, after the Rucho decision, independent redistricting commissions represent perhaps the most viable means to combatpartisan gerrymandering.When states create independent redistricting commissions, they remove theauthority for drawing electoral lines from politicians and hand it over to independentbodies consisting of multi-partisan citizen volunteers who do not hold public office.2These redistricting commissions are independent from the legislature and designedto be insulated from politicians, whose primary interest is often helping ensure theirown re-election. As a result of a 2015 U.S. Supreme Court decision upholding the constitutionality of Arizona’s independent redistricting commission (Arizona Legislaturev. Arizona Independent Redistricting Commission),3 redistricting reform efforts have1 Rucho v. Common Cause, 139 S. Ct. 2484 (2019).2 For a listing of states that have commissions for legislative and/or congressional line drawing, x3 Arizona State Legislature v. Arizona Indep. Redistricting Comm’n, 135 S. Ct. 2652 (2015).1
the arizona independent redistricting commission: One State’s Model for Gerrymandering Reformexpanded into several other states.4 In 2018 alone, advocates and voters in more thanhalf a dozen states advanced ballot initiatives and legislation to create independentcommissions to draw district lines in the upcoming redistricting cycle.5Nevertheless, commission-based redistricting reform may remain on precariousfooting given the changing composition of the Supreme Court. Court watchers haveobserved that a future decision may reverse the Arizona Legislature holding and strikedown independent commissions as unconstitutional based on Article I of the Constitution, which grants the state legislature (and not necessarily voters themselves) thepower to set the rules for congressional elections.6 The constitutionality of voters opting for independent commissions hinges on the interpretation of the word “legislature”—and whether it is an umbrella term that includes ballot initiatives.Despite these headwinds, independent redistricting in practice has provenremarkably successful along several dimensions. This policy brief outlines key lessonslearned from redistricting in Arizona, a state with a five-person independent redistricting commission. Based on a mix of empirical evidence and first-hand experience, weargue that Arizona’s approach to redistricting: increases transparency through public engagement and participation in themapping process. fosters increased competition in districts, which has several effects thought tobe beneficial for democratic representation. contributes to higher levels of compactness (i.e., how far the district extendsfrom its center) in newly-drawn districts and promotes partisan fairness in thestate as a whole. benefits from its multi-partisan composition and ought to be insulated fromlegislative interference.4 See eform-gains-momentum-2016 for more details.5 See izen-efforts-reform-redistricting for more details.6 See to-redistricting-reform for more details.2
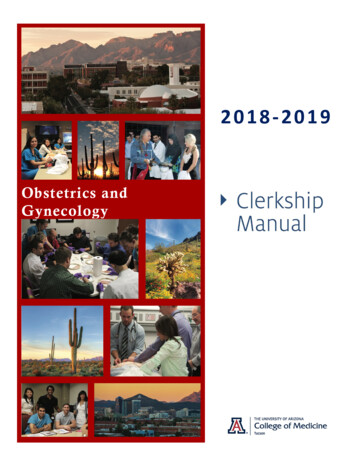
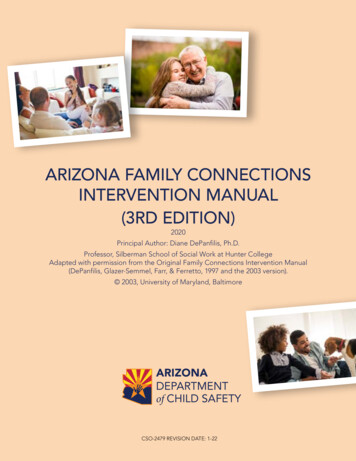
the arizona independent redistricting commission: One State’s Model for Gerrymandering ReformbackgroundSince statehood, through the initiative process, Arizona citizens have had the power todraft propositions, collect the requisite signatures through petition drives, and placemeasures on the ballot for voters to consider. In 2000, a multi-partisan group of Arizona voters and citizen groups came together to draft a proposition to end gerrymandering by taking the power to draw legislative and congressional districts away fromthe legislature and granting that responsibility to a new independent entity. This proposition7 passed with 56 percent of the vote and the Arizona Constitution was amendedto create an independent redistricting commission.Arizona citizens, like those in other states, had grown increasingly concernedthat gerrymandering was linked to governmental dysfunction. With growing numbersof candidates running unopposed and government shutdowns becoming more commonplace, citizens and commentators increasingly saw “safe seats” drawn to preservethe status quo for a party or an incumbent lawmaker as part of a broken system.While the term gerrymander—defined as manipulating “the boundaries of [anelectoral constituency] so as to favor one party or class”—most commonly connotesnefarious activity, there can also be valid reasons to gerrymander.8 Consider Arizona’s Congressional district map below, which the Department of Justice pre-clearedunder Section 5 of the Voting Rights Act in 2004. The middle of Congressional District 1appears to be an obvious gerrymander. However, the “island” of Congressional District2 surrounded by Congressional District 1 was drawn at the request of the Hopi Tribe, asovereign Native American nation, in response to the tribe’s concerns about sharing adistrict with the surrounding Navajo Nation.7 See http://azredistricting.org/2001/Prop-106.asp.8 “gerrymander.” Oxford Living Dictionary. Oxford University Press. rrymander (accessed November 01, 2017).3
the arizona independent redistricting commission: One State’s Model for Gerrymandering ReformFigure 1.Source: http://azredistricting.orgThis situation, one of many that requires navigating complex relationships amongvarious communities, provides an excellent illustration of the competing criteria thatmust be weighed and balanced when drawing district maps. In this case, one criterion, compactness, was sacrificed for the sake of another, respecting communities ofinterest. Deciding when and how to make such trade-offs also illustrates why officialscannot completely eliminate human involvement by fully automating redistricting.key findings and observations from arizona’s experiencePublic ParticipationThe Arizona Independent Redistricting Commission (AIRC) went to great lengths toensure the public had numerous opportunities and methods to engage throughout theentire process. The commission carried out most of its work during the 2011 calendaryear, with final maps adopted in January 2012. But before a single line was drawn, thecommission embarked on a “listening tour,” where commissioners traveled the state4
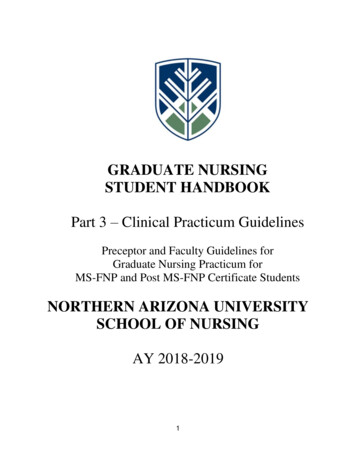
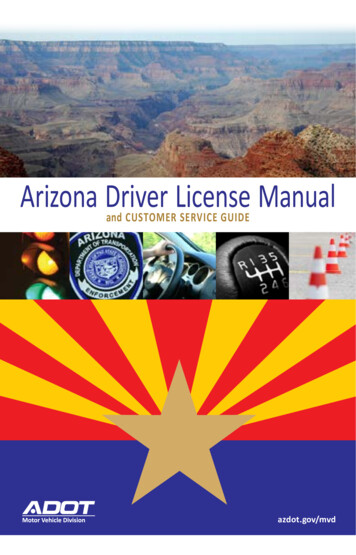
the arizona independent redistricting commission: One State’s Model for Gerrymandering Reformto host 23 public hearings exclusively held to obtain input on what the redistrictingcriteria set forth in the state constitution meant to Arizona citizens. Then, during theline-drawing phase, the commission provided time for public comment at all of itsbusiness meetings, allowing anyone in attendance to fill out a “request to speak” formand supply their input for the record. Members of the public could submit commentsonline at any time. Finally, once the commission completed drawing draft maps, thecommissioners again traveled around the state to 30 towns and cities to gather feedback on their work.Ultimately, the commission received more than 7,400 items of public input alongwith 224 maps suggested by the public. Commissioners considered this feedback andincorporated much of it into the final maps.The AIRC also employed a public information officer and a video/IT expert inorder to ensure that the public could participate by streaming the meetings live. Videos and transcripts of these meetings and hearings remain archived and accessible onthe AIRC website at http://azredistricting.org.There is some evidence that the combination of independence from the legislature, transparency and the chance to participate has led citizens of Arizona to feel morepositively toward their state’s redistricting process. In the Cooperative CongressionalElection Survey, respondents from Arizona answered yes to the question of whetherthey thought their state’s redistricting process was fair more frequently than citizens inall but the top fifth of states.9 More broadly, among respondents who had an opinionon the fairness of the redistricting process, those from states with independent redistricting commissions were more likely to feel that the redistricting process was fair.Figure 2 shows that states with an independent commission had a roughly six percentage point edge over states with a legislature controlling the redistricting process or acommission of politicians (this difference is statistically significant).9 Schaffner, Brian; Ansolabehere, Stephen, 2015, “2010–2014 Cooperative Congressional Election Study PanelSurvey,” https://doi.org/10.7910/DVN/TOE8I1, Harvard Dataverse.5
the arizona independent redistricting commission: One State’s Model for Gerrymandering ReformFigure 2. Is Redistricting Process Fair? Share Answering Yes in 20140.30Share Answering Yes0.250.200.150.100.050.00States with IRCStates with LEGStates with PRCcompetitivenessAnother important aspect of independent redistricting in Arizona is the elevation ofcompetitiveness to a full-fledged redistricting criterion with the same weight as othermore traditional redistricting criteria such as compactness, contiguity, respectingcommunities of interest and utilizing natural/geographic boundaries. Specifically, theAIRC must consider and evaluate competitiveness, along with the other redistrictingcriteria, with the goal of helping to ensure “fair and competitive” districts where bothmajor parties have an opportunity to win an election.10 The AIRC is also forbidden fromconsidering incumbents’ addresses.The link between competitiveness and independent redistricting, as well as thepotential benefits of competitiveness, requires some examination. Political scientistsdisagree over whether independent redistricting leads to increased competitiveness.Research on the topic, from Abramowitz Alexander and Gunning (2006) and McDonald (2006), for example, has come to differing conclusions.11 That said, it does seem10 e.g., Ariz. Const., Art. IV, §2.111 See Abramowitz, Alan, Brad Alexander, and Matthew Gunning. “Don’t blame redistricting for uncompetitive elections.” PS: Political Science & Politics 39, no. 01 (2006): 87–90. Also see McDonald, Michael P. “Drawing the lineon district competition.” PS: Political Science & Politics 39, no. 01 (2006): 91–94.6
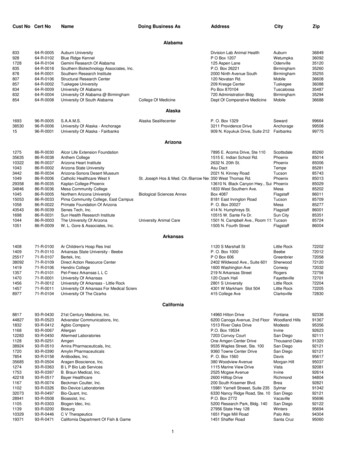
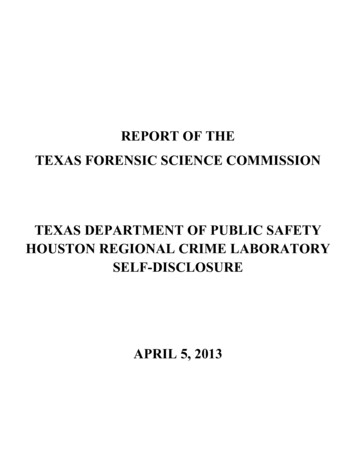
the arizona independent redistricting commission: One State’s Model for Gerrymandering Reformevident that states that have insulated the process from legislators in some mannerexhibit increased competitiveness. For example, in a systematic study of competitiveness by redistricting method between 1972 and 2012, Carson et al. (2014) found thatcommission-drawn (though not necessarily independent commission-drawn) districtsare, on average, substantially more competitive than legislature-drawn districts.12Figures 3. Percentage of Competitive House Races by Redistricting Method, 1972–2012Percentage of Competitive ourtCommissionBased on results from Carson et al. (2014).It also seems that the 2011 iteration of the AIRC did increase competitiveness. Toevaluate the change in competitiveness before and after the 2010 redistricting cycle,we measure competitiveness as the underlying partisan composition of the district.We derive our measure from the non-partisan Cook Political Report’s Partisan VotingIndex (PVI).13 The PVI averages the mean-deviated, Democratic share of the two-partyvote in a given congressional district over the past two presidential elections. We usethe PVI based on the 2004 and 2008 presidential elections. Intuitively, the PVI indicates the extent to which a given congressional district favors a Democratic candidate12 Carson, Jamie L., Michael H. Crespin, and Ryan D. Williamson. “Reevaluating the effects of redistricting on electoral competition, 1972–2012.” State Politics & Policy Quarterly 14, no. 2 (2014): 165–177.13 For more information, see: http://cookpolitical.com/house/pvi.7
the arizona independent redistricting commission: One State’s Model for Gerrymandering Reformor a Republican candidate relative to the average congressional district. A PVI of 0 indicates a 50/50 district, while a PVI of D 10 or R 10 indicates a 60/40 district favorableto a Democratic candidate or Republican candidate, respectively.Figure 4 illustrates how the competitiveness of congressional districts in Arizona changed after the 2010 redistricting cycle (the 2012 election was the first withthe newly drawn districts). The figure orders congressional districts from least to mostcompetitive; square markers represent pre-2012 districts, and circular markers represent post-2012 redistricting districts. As the plot illustrates, the 2010 redistricting cyclemade the two most competitive districts even more competitive and created a thirdhighly competitive district. The remaining districts generally stayed equally competitive or changed marginally in either direction. Based on the PVI competitiveness measure, the three highly competitive districts resulting from the redistricting (AZ-1, AZ-2,and AZ-9) had vote distributions between 53/47 and 50/50. These districts represent33 percent of Arizona’s congressional districts. For comparison, only 15 percent of congressional districts outside of Arizona meet the same threshold for competitiveness.Figure 4. Arizona Competitiveness: Pre- and Post-RedistrictingAZ-4Least competitive CDPostAZ-5AZ-6PostPre.PreAZ-2 AZ-8Post.AZ-4AZ-7PrePostAZ-6AZ-3PostPreMedian CD.AZ-3AZ-1Post Pre.AZ-7PreAZ-5Pre.AZ-8Most competitive CD70/3065/35Less Competitive8AZ-1Post60/40AZ-2PostPre55/45PVI CompetitivenessMore CompetitiveAZ-9Post50/50
the arizona independent redistricting commission: One State’s Model for Gerrymandering ReformFigure 5 performs the same exercise for Arizona legislative districts. At the statelegislative district level, increases in competitiveness are even more marked than atthe congressional district level. A full eighty percent of Arizona legislative districtsbecame more competitive post-redistricting.Figure 5. Arizona Competitiveness: Pre- and Post-RedistrictingLeast competitive LD.Median LDsMedian LDs.Most competitive LDPrePost2014: 24/30 LDsMore CompetitivePostPrePrePostPre70/3065/35Less Competitive60/4055/45Post50/50PVI CompetitivenessMore CompetitivePerhaps the best measure of competitiveness is how the districts have performedacross all elections since redistricting. Party registration among voters in the state isroughly evenly split among Republicans, Democrats, and Independents. In Arizona’scase, after complying with Section 5 of the Voting Rights Act (which was operational atthe time of the drawing of the most recent maps), as well as all the other criteria, thecommission drew a congressional district map with four safe Republican seats, twosafe Democratic seats (which are majority-minority districts to comply with the VotingRights Act), and three competitive districts.In the 2012 election, Democratic candidates swept all three competitive raceswith one race that took two weeks to call (a 2454 vote difference). In 2014, the Republicans won back one of those competitive districts in a race where the election wasdecided by only 167 votes. Consequently, Arizona was home to the most competitive9
the arizona independent redistricting commission: One State’s Model for Gerrymandering Reformdistrict in the country and recognized as having three of the handful14 of truly competitive districts (out of 435) nationwide. In 2016, Republicans held on to a 5-4 edge inthe congressional delegation. Competitiveness in AZ-1 declined due to the entrance ofa third-party candidate, and in AZ-2 (the location of the extremely tight race in 2014),the advantages of incumbency led to a more comfortable margin of victory (43,933vote difference) for Rep. Martha McSally (R-AZ). Most recently, in 2018, Democratsedged out Republicans 5-4. Ann Kirkpatrick (D-AZ) won in AZ-2 in an open seat election as McSally left her seat and ran for U.S. Senate. Thus, in the four congressionalelections since redistricting occurred, both Democrats and Republicans won five seatstwice—results that reflect the competitive nature of a state where Donald Trump won in2016 by less than 100,000 votes and where, in 2018, Kyrsten Sinema (D-AZ) narrowlydefeated McSally in a U.S. Senate race that pitted two incumbents from competitivedistricts against one another.Why all the focus on competitiveness? Many political scientists think that competitive districts have some significant benefits, including encouraging more contested races, attracting more high-quality challengers, and producing more responsiveelected officials. Competitiveness also reinforces the idea that everyone’s vote matters.Electoral competition demonstrably contributes to turnover in seats between theparties. The figure below shows that historically, as the underlying competitivenessof the district increases, the percentage of districts that change parties in an electionincreases as well. In cases where the underlying level of competitiveness is within fivepoints of a dead heat election, almost 15 percent of seats on average ended up switching to the other party.When politicians face the risk of losing their seats, they may be both more responsive to the preferences of more of their constituents and more likely to pursue bipartisan solutions.14 rymandering-is-on-trial/?utm term .7b79214c93a3.10
the arizona independent redistricting commission: One State’s Model for Gerrymandering ReformFigure 6. Competitive Electoral Conditions and Party Turnover, 2004 to 201020Party Turnover (%)15105090/1080/2070/3060/4050/50PVI CompetitivenessElectoral competition also means there will be more races with two viable candidates. Uncontested elections do not grant voters a choice in the general election.Election results since 2004 show a clear relationship between the underlying level ofcompetition in a district and the probability of an election being uncontested. Lessthan ten percent of races go uncontested in districts with an underlying level of competitiveness of 60/40 or better. In less competitive districts, the percentage of contested elections drops considerably.11
the arizona independent redistricting commission: One State’s Model for Gerrymandering ReformFigure 7. Competitive Electoral Conditions and Uncontested Elections35Uncontested Elections (%)30252015105090/1080/2070/3060/4050/50PVI CompetitivenesscompactnessArizona’s 6.4 million people (at the time of the last census) are spread across almost114,000 square miles. While over half of the population is concentrated in MaricopaCounty, roughly 3 million Arizonans are dispersed throughout the rest of the state.This geographic distribution of the population makes it challenging to draw compactdistricts of equal population.Despite this, Arizona ranks highly in terms of compactness compared to otherstates with similar numbers of congressional districts. Five of nine districts in Arizonarank in the top 20 percent of all districts in the nation in terms of compactness, andthe average compactness measure for Arizona districts is more compact than 75 percent of all other congressional districts in the country (using the “Reock” measure ofcompactness).15That said, the AIRC received some criticism for the size of AZ-1, which, thoughsimilar in size to the previous commission’s AZ-1, has been described as “sprawling.”15 Reock, Ernest C. “A note: Measuring compactness as a requirement of legislative apportionment.” Midwest Journal of Political Science 5, no. 1 (1961): 70–74.12
the arizona independent redistricting commission: One State’s Model for Gerrymandering ReformThe commission in 2011 was attempting to honor the rural composition of the district—considering rural voters as a community of interest. In order to achieve this andstill meet the equal population requirement, vast areas of land had to be included.As an alternative to large geographic districts, the commission could have drawnwedge-shaped districts that took a slice of the dense population near the center of thestate in Maricopa County, but this might have resulted in the urban parts of the districts dominating representatives’ time and attention and the more sparsely populatedrural parts being somewhat neglected.partisan bias and fairnessPartisan bias refers to an asymmetry between political parties in the translation ofvotes into seats. Partisan fairness, then, is the absence of partisan bias. This could beachieved by proportional representation, or by majoritarian representation that nonetheless treats the parties symmetrically. Fully evaluating an electoral system’s partisanfairness requires multiple years of election data. However, we can gain some insight intopartisan fairness just by examining the difference in the vote share and the seat share forvarious states. For example, if a state exhibits close to proportional representation overmultiple years, then that can serve as preliminary evidence of partisan fairness.In 2014, based on the difference between the share of votes cast for each partyand the share of representatives from each party, Arizona ranked fourth out of all 50states in terms of achieving proportional representation. Figure 8 below shows thevote share and seat share for Arizona, Maryland, and North Carolina. Maryland andNorth Carolina are two of the more extreme examples, in which the spatial distributionof voters and district boundaries result in large differences in the share of votes castfor each party’s candidates and the share of representatives actually elected from eachparty. In contrast, the share of votes for a party roughly corresponded to the share ofseats won in Arizona.In 2016, Arizona ranked first in terms of achieving a proportional translation ofvotes into seats among all states with more than one congressional district. Figure 9 displays a plot of the seat share against the vote share for each state in 2016, highlighting13
the arizona independent redistricting commission: One State’s Model for Gerrymandering Reformstates with independent redistricting commissions. Arizona was essentially perfectlyproportional, with Democrats gaining 45 percent of votes and 44.4 percent of Houseseats. While this is no guarantee that Arizona will exhibit partisan fairness in futureelections, the evidence from these past two elections suggests that the most recentredistricting plan has led to a fair translation of votes into seats for both parties.Figure 8: Partisan Fairness in Key States in 2014 Congressional 8.1%87.5%44.2%23.1%Votes RepresentativesArizonaVotes RepresentativesMarylandVotes RepresentativesNorth Carolina0.81.0Figure 9: Seat Shares and Vote Shares in 2016 Congressional Elections0.6Washington0.4Arizona0.2Dem. Seat ShareCalifornia0.0Idaho0.00.20.40.6Dem. Vote Share140.81.0
the arizona independent redistricting commission: One State’s Model for Gerrymandering Reformpractical lessonsIn addition to the insights gleaned from analyzing the results of the AIRC’s work, thereare also important practical lessons to be drawn from Arizona’s process. These impressions are, by necessity, qualitative and reflect just one perspective—specifically, thatof the chair of the AIRC (and a co-author on this policy brief), Colleen Mathis. States considering creation of an independent redistricting commission mustinsulate the body from outside influence and interference as much as possible.16 The commission should enjoy the same privileges and immunities aslegislators for the task it is assigned to do. For example, in Arizona, courtshave granted the commission legislative privilege for its task of redrawing thestate’s legislative and congressional districts. This is essential, as it protectscommissioners against the threat of personal lawsuits from factions trying todiscredit the work of the commission. To ensure the greatest public buy-in, the body that drafts the propositionor legislation creating an independent redistricting commission should bemulti-partisan. Arizona’s Proposition 106 was drafted by a Republican, a Democrat and an Independent with non-partisan input and support from CommonCause and the League of Women Voters. The composition of the commission should reflect the make-up of the state’sregistered voters to the greatest extent possible, and there should be a mechanism allowing for change in the body’s composition as voter affiliationchanges over time. For example, Arizona’s current commission is made up oftwo Republicans, two Democrats and an Independent (who can be a memberof any party except the majority or minority party in the legislature). At the timeof the drafting of the proposition in 2000, only 18 percent of Arizona’s voters16 A summary of the litigation in Arizona during the 2010 cycle can be found at Loyola University Law School’s “AllAbout Redistricting” website curated by Professor Justin Levitt. Two of the cases were decided by The SupremeCourt of the United States: Harris, et.al. v. Arizona Independent Redistricting Commission, et al. (decided April20, 2016) and Arizona State Legislature v. Arizona Independent Redistricting Commission, et al. (decided June 29,2015). The Commission and/or its Commissioners prevailed in all lawsuits during the 2010 redistricting cycle.15
the arizona independent redistricting commission: One State’s Model for Gerrymandering Reformwere registered as Independents. However, by 2016, that number had grownto 33 percent. The composition of the commission should reflect that change. It is very important to contain the role of the legislature in this task as inevitablysome legislators will not like the lines the commission draws. The rule pr
own re-election. As a result of a 2015 U.S. Supreme Court decision upholding the con-stitutionality of Arizona's independent redistricting commission (Arizona Legislature v. Arizona Independent Redistricting Commission3 redistricting reform efforts have ), 1 Rucho v. Common Cause, 139 S. Ct. 2484 (2019).