Transcription
HEALTH EQUITY IN ENGLAND:THE MARMOT REVIEW 10 YEARS ONEXECUTIVE SUMMARY
ContentsKey messages of this review3Ensure a healthy standard of livingfor allIntroduction4Wage, income and wealth inequalities25Poverty26Tax and benefit system27Social mobility27Proposals to support action onhealth inequalities7Create and develop healthy andsustainable places and communities2528Inequalities in healthsince 201010Social determinants of health16Give every child the best start in life17Housing29Attainment18Climate change30Child poverty18Funding19Conclusions31References32Enable all children, young people andadults to maximise their capabilitiesand have control over their lives20Attainment21School exclusions22Youth crime22Funding22Create fair employment andgood work for allCommunities and places facing particularhardship and adversity28Air quality28Built environment and transport2923Employment rates23Work quality23Automation24Low wages and in work poverty24HEALTH EQUITY IN ENGLAND: THE MARMOT REVIEW 10 YEARS ON1
AUTHORSReport writing team: Michael Marmot, Jessica Allen, Tammy Boyce, Peter Goldblatt, Joana Morrison.The Marmot Review team was led by Michael Marmot and Jessica Allen and consisted of Jessica Allen, MatildaAllen, Peter Goldblatt, Tammy Boyce, Antiopi Ntouva, Joana Morrison, Felicity Porritt.Peter Goldblatt, Tammy Boyce and Joana Morrison coordinated production and analysis of tables and charts.Team support: Luke Beswick, Darryl Bourke, Kit Codling, Patricia Hallam, Alice Munro.The work of the Review was informed and guided by the Advisory Group and the Health Foundation.Suggested citation: Michael Marmot, Jessica Allen, Tammy Boyce, Peter Goldblatt, Joana Morrison (2020) HealthEquity in England: The Marmot Review ten years on. London: Institute of Health EquityHEALTH FOUNDATIONThe Health Foundation supported this work and provided insight and advice IHE would like to thank in particular:Jennifer Dixon, Jo Bibby, Jenny Cockin, Tim Elwell Sutton, Adam Tinson, David Finch, Grace Everest, Rita Ranmal.AUTHORS’ ACKNOWLEDGEMENTSWe are indebted to the Advisory Group that informed the review: Torsten Bell, David Buck, Sally Burlington,Jabeer Butt, Jo Casebourne, Adam Coutts, Naomi Eisenstadt, Joanne Roney, Frank Soodeen, Alice Wiseman.We are also grateful for advice and insight from the Collaboration for Health and Wellbeing.We are grateful for advice and input from Nicky Hawkins, Frameworks Institute; Angela Donkin, NFER; andTom McBride, Early Intervention Foundation for comments on drafts. We are grateful to Madhavi Bajekal, UCL/Legal & General for input on life expectancy data. We are grateful to Greater Manchester Health and Social CarePartnership, Greater Manchester Combined Authority and the Greater Manchester localities.SOURCE MATERIALS FOR CASE STUDIESSource materials used in the case studies presented in the report were collated by Jessica Allen, Tammy Boyce,Peter Goldblatt and Joana Morrison. Some case studies were provided by People’s Health Trust.We are grateful to the following organisations that represent the case studies: ACORN Ethical Lettings, AdviceNottingham, Aspire & Succeed, Beat the Cold, Bikes for All, Centre for Local Economic Strategies, EdbertsHouse, English for Action (EFA), Eastern Savings and Loans Credit Union, Gateshead Public Health, JusticePrince, Magic Breakfasts, Malmo City Council, Northumbria Foundation Trust Welfare Rights Team, NottinghamCity Council, Open Door Community Action Trust, Positive Youth Foundation, Redcar Athletic Football ClubLimited, the Resurgam Trust, Stepping Stones for Families, Streetgames, Switchee, Surrey Minority Ethnic Forum(SMEF), Tower Hamlets Whole Systems Data Project, Wales Future Generation Commission, West Midlands FireService, Whitehawk GPs.2HEALTH EQUITY IN ENGLAND: THE MARMOT REVIEW 10 YEARS ON
Key messages of this review Since 2010 life expectancy in England has stalled;this has not happened since at least 1900. If healthhas stopped improving it is a sign that society hasstopped improving. When a society is flourishinghealth tends to flourish. The health of the population is not just a matter ofhow well the health service is funded and functions,important as that is. Health is closely linked to theconditions in which people are born, grow, live,work and age and inequities in power, money andresources – the social determinants of health. The slowdown in life expectancy increase cannotfor the most part be attributed to severe winters.More than 80 percent of the slowdown, between2011 and 2019, results from influences other thanwinter-associated mortality. Life expectancy follows the social gradient – the moredeprived the area the shorter the life expectancy.This gradient has become steeper; inequalities in lifeexpectancy have increased. Among women in themost deprived 10 percent of areas, life expectancyfell between 2010-12 and 2016-18. There are marked regional differences in lifeexpectancy, particularly among people living inmore deprived areas. Differences both within andbetween regions have tended to increase. Forboth men and women, the largest decreases inlife expectancy were seen in the most deprived10 percent of neighbourhoods in the North Eastand the largest increases in the least deprived 10percent of neighbourhoods in London. There has been no sign of a decrease in mortalityfor people under 50. In fact, mortality rates haveincreased for people aged 45-49. It is likely thatsocial and economic conditions have underminedhealth at these ages. The gradient in healthy life expectancy is steeperthan that of life expectancy. It means that peoplein more deprived areas spend more of their shorterlives in ill-health than those in less deprived areas. The amount of time people spend in poor healthhas increased across England since 2010. As wereported in 2010, inequalities in poor health harmindividuals, families, communities and are expensiveto the public purse. They are also unnecessary andcan be reduced with the right policies. Large funding cuts have affected the socialdeterminants across the whole of England, butdeprived areas and areas outside London and theSouth East experienced larger cuts; their capacityto improve social determinants of health has beenundermined. As in 2010 reducing health inequalities requiresaction on six policy objectives. In this reportwe review significant changes since 2010 in fiveof them.- Give every child the best start in life-E nable all children, young people and adults tomaximise their capabilities and have control overtheir lives- Create fair employment and good work for all- Ensure a healthy standard of living for all-C reate and develop healthy and sustainable placesand communities For each objective we outline areas of progress anddecline since 2010 and make clear the links withhealth and health inequalities. Despite the cuts and deteriorating outcomes inmany social determinants some local authoritiesand communities have established effectiveapproaches to tackling health inequalities. Thepractical evidence about how to reduce inequalitieshas built significantly since 2010. The national government has not prioritised healthinequalities, despite the concerning trends and therehas been no national health inequalities strategysince 2010. We see this as an essential first step inleading the necessary national endeavour to reducehealth inequalities. We set out a clear agenda for national governmentto tackle health inequalities, building on evidence ofexperience in other countries and local areas since2010. We establish how the Government must takeaction in England as a matter of urgency. The goal should be to bring the level of health ofdeprived areas in the North up to the level of goodhealth enjoyed by people living in affluent areas inLondon and the South.HEALTH EQUITY IN ENGLAND: THE MARMOT REVIEW 10 YEARS ON3
IntroductionHealth is repeatedly shown to be the Nation’s top priority. And so it should be – it is quite simplya matter of life or death of wellbeing or sickness. Good health is an indication that society is thrivingand that economic and social and cultural features of society are working in the best interests ofthe population.The last decade has been marked by deterioratinghealth and widening health inequalities. People livingin more deprived areas outside London have seentheir life expectancy stalling, even declining for some,while it has increased in more advantaged areas. Forhealthy life expectancy there has been little increasefor men and a slight fall for women.This damage to health has been largely unnecessary.There is no biological reason for stalling life expectancyand widening health inequalities. Other countries aredoing better, even those with longer life expectancythan England. The slowdown in life expectancy isnot down to exceptionally cold winters or virulentflu, and cannot be attributed solely to problems withthe NHS or social care – although declining fundingrelative to need in each sector will undoubtedly haveplayed a role. The increase in health inequalities inEngland points to social and economic conditions,many of which have shown increased inequalities, ordeterioration since 2010.In the 2010 Marmot Review, Fair Society HealthyLives, we set out 6 areas, which covered stagesof life, healthy standard of living, communitiesand places and ill health prevention. Theseformed the basis for our six priority objectivesand areas of recommendations: Give every child the best start in life. Enable all children, young people and adultsto maximise their capabilities and have controlover their lives. Create fair employment and good work for all. Ensure a healthy standard of living for all. Create and develop healthy and sustainableplaces and communities. Strengthen the role and impact of ill healthprevention.4HEALTH EQUITY IN ENGLAND: THE MARMOT REVIEW 10 YEARS ON
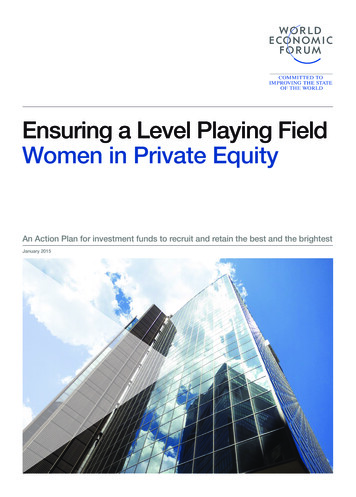
In this 10 Years on Report, we assess what hashappened since 2010 in all the areas except the sixth– ill health prevention. Our reason for not coveringthe sixth area is that it has been explored in detailby others since 2010 and there have been manyprogrammes and interventions – led by Public HealthEngland and NHS England and public health teams inlocal government. This area is vitally important for illhealth prevention and our recommendations in 2010still stand: we call for an increase in public healthfunding and increased focus on prevention fromthe NHS.For the other five areas we examine outcomes over thelast decade and include new areas for analysis whichhave risen in importance since the original report. Wehave a stronger focus on regional inequalities; areasoutside London and the South have fared worse inhealth and the social determinants since 2010 andremedying this should be a major focus of governmentaction. We make recommendation to this effect.We also have a greater emphasis on poverty aswell as the socioeconomic gradient, those towardsthe bottom of the socioeconomic gradient havesuffered particularly over the decade and requireproportionately more investment and support overthe next decade even just to bring them back to wherethey were in 2010.We have a somewhat stronger focus on cioeconomic position to produce particularly pooroutcomes for some minority ethnic groups. Lack ofdata though is a continuing limitation in understandingethnic inequalities in health and we welcome efforts tomake better use of data linkage to support analyses,and to inform policy and interventions to reduceethnic inequalities and to strengthen accountability.Since 2010 there have been widespread and deep cutsin most areas of public spending, a result of austerityand government responses to perceived financialpressures. Government spending as a percentage ofGDP declined by seven percentage points between2009/10 and 2018/19, from 42 percent to 35 percent.Cuts to local authorities have been hugely significant;local government allocations from the Ministry ofHousing, Communities and Local Government declinedby 77 percent between 2009–10 and 2018–19. Therehave also been large cuts to most other Departments’expenditure. Spending on social protection andeducation, both vital for health, have declined themost – by 1.5 percent of GDP.But it is not just the impact of overall cuts: it is howand where they have fallen which has impacted moston inequalities. The cuts over the period shown havebeen regressive and inequitable – they have beengreatest in areas where need is highest and conditionsare generally worse, as shown in Figure 1. It is likelythat the cuts have harmed health and contributed towidening health inequalities in the short term and arelikely to continue to do so over the longer term.Figure 1. Average change in council service spending per person by quintile of Index of Multiple Deprivationaverage score, 2009–10 to ost deprivedareasASC spending per personLeast deprivedareasTotal LA service spending per personOther service spending per personSource: Institute for Fiscal Studies, 2018 (1)Note: LA local authority; ASC adult social care Other services all council services except adult social careHEALTH EQUITY IN ENGLAND: THE MARMOT REVIEW 10 YEARS ON5
While outcomes and actions in England have beendisappointing, there is some cause for optimism. Since2010 there has been a marked change in awarenessand prioritisation of health inequalities and socialdeterminants of health. Many organisations in Englandnow have social determinants of health strategiesand have helped build evidence, providing practicaltools for implementing approaches for a wide rangeof organisations and sectors; they have also providedsupport and funding to help communities to make thechanges. Examples of these are highlighted throughoutthe report. There has been a welcome change in debate,at least by local governments, think tanks, healthworkforces, public health – and social determinantsapproaches are increasingly on the agenda.Internationally too, governments have taken forwardnational approaches to health inequalities. Somegovernments in the UK have prioritised healthinequalities and social determinants to a greaterextent than in England. Throughout the main report weinclude brief descriptions of these and refer to others.Local governments have played a vital role. Despitewidespread cuts there has been positive action andsome are leading the way, establishing whole systemapproaches to tackling health inequalities. Alongsidethis report we publish an evaluation assessing whatCoventry City Council has achieved since becominga Marmot City in 2013. We are also publishing a6HEALTH EQUITY IN ENGLAND: THE MARMOT REVIEW 10 YEARS ONshort case study of work in Greater Manchester toestablish itself as a Marmot City Region. Other areas inEngland have similarly developed strong and effectiveways of improving health and reducing inequalities.Some of these are described in the report. There ismuch evidence and ample precedent on which thenational government in England can base future plansto improve the nation’s health and reduce healthinequalities.Another reason for optimism is that the currentGovernment has signalled an end to austerity andannounced a programme of spending which could,if allocated in the right way, help reduce healthinequalities and turn around some of the trajectoriesand poor outcomes experienced over the last tenyears. This would require a significant prioritisationof equity – in relation to reducing regional inequalitiesand inequalities related to area deprivation andpeoples’ socioeconomic position.We set out proposals for policies and actions which,taken together, would reduce inequalities in the socialdeterminants of health and thus achieve greater healthequity. There is a pressing need to do this, and lives arebeing lost and harmed unnecessarily. There is clearevidence of the way forward, practical experiencefrom England and around the world about how totake action, and evidence that there are savings to bemade; there are no technical reasons for inaction andthe onus is clearly on politicians to take the lead.
Proposals to support action onhealth inequalitiesStrong national government commitment andleadership is required to begin to turn around thedeteriorating health situation in England. Improvingthe health and wellbeing of the population andreducing health inequalities is a whole of societyendeavour. But the necessary prioritisation, focusand resources must come from national governmentwith leadership from the Prime Minister. Within thecontext of overall improvement in health, there aretwin challenges: To reduce socioeconomic inequalities in length oflife and health; To reduce regional inequalities in health, improvingthe health of people living in deprived areas –particularly those outside affluent areas in Londonand the South.The followingachieve that:componentsareessentialtoImplementation of action on health inequalitiesand their social determinants1. Develop a national strategy for action on thesocial determinants of health with the aim ofreducing inequalities in health.2. Ensure proportionate universal allocation ofresources and implementation of policies.3. Early intervention to prevent health inequalities.4. Develop the social determinants of healthworkforce.5. Engage the public.6. Develop whole systems monitoring andstrengthen accountability for health inequalities.1. Develop a national strategy for action on the socialdeterminants of health with the aim of reducinginequalities.A first priority for the Government is to establish anational strategy for health inequalities, led by thePrime Minister. There is evidence that the previoushealth inequality strategy which ended in 2010reduced inequalities. Other national governmentsaround the world have established effective nationalstrategies. We propose: Development a of national strategy on healthinequalities led by the Prime Minister. Ensuring a strong focus on social determinants ofhealth in the new strategy and by Public HealthEngland and NHS England. Establishing a Cabinet Level cross-departmentalcommittee to lead implementation of the work onthe health inequalities strategy. The cross departmental committee to leadprioritisation of equity considerations at the heartof policy formulation and implementation inall sectors.2. Ensure proportionate universal allocationresources and implementation of policies.ofIn the 2010 Marmot Review we proposed proportionateuniversal approaches, that is, policies and interventionswhich are universal but developed to be more intensewhere need is higher – to be proportionate to need.These approaches can raise overall levels of health andflatten the gradient in health and we have examplesof them in the Report. As we describe in the report,over the last ten years, changes to funding allocationsand cuts to benefits have disproportionately affectedpoorer areas and communities and have been greatestin the North. Reversing these losses requires fundingand action to be greater in those areas which have lostmost, but universal as all areas have suffered cuts andwidening inequalities. Therefore, we propose: Health inequalities targets to reduce socioeconomicand area inequalities in health. Regional healthinequalities should be reduced by achievingproportionately greater improvements in healthinequalities in the North. Strengthen the deprivation components in theRevenue Support Grant to local authorities. TheNHS Resource allocation formula should also beincreased to better reflect social need.HEALTH EQUITY IN ENGLAND: THE MARMOT REVIEW 10 YEARS ON7
Fund and adopt a proportionate universalist approachto building community resources and involvecommunities in the design and implementation ofprogrammes to reduce inequalities.3. Early intervention to prevent health inequalities.Take action on the five areas outlined in the reportin the ways set out and summarised here and continueto take action in the sixth area of the 2010 MarmotReview:1. Give every child the best start in life2. Enable all children, young people and adults tomaximise their capabilities and have control overtheir lives3. Create fair employment and good work for all4. Ensure a healthy standard of living for all5. Create and develop healthy and sustainable placesand communities6. Strengthen the role and impact of ill healthprevention.We also propose increasing spending on public healthto seven percent of the NHS budget as set out in the2010 Marmot Review4. on on the social determinants of health requiresaction across multiple arenas and domains and thatrequires commitment and know-how from a rangeof workforces outside health. Since 2010, there havebeen many promising developments from nonhealthcare workforces, which illustrate the possibilityof health equity in all policies. Police, fire fighters,social care, housing and early years workforces have alldeveloped approaches to tackling health inequalities,by extending and adapting their day-to-day practicesand procurement.Clearly the prime focus of the healthcare workforcewill always be on health care and treatment, but thereare many effective and promising practices developedby the health care workforce which can improvepopulation health and reduce inequalities throughactions on the social determinants. We recommend: Development of education programmes focusingon the social determinants for a range of workforces Development of anchor institution approaches Develop a health system approach to populationhealth, with partnerships to improve populationhealth among a range of sectors, locally andnationally.5. Engage the publicWhile health is repeatedly at the top of the public’sconcerns, there is widespread lack of publicunderstanding about what drives health. This is amajor obstacle to further progress in reducing healthinequalities and increasing population health. Eventhough the health system and national government8HEALTH EQUITY IN ENGLAND: THE MARMOT REVIEW 10 YEARS ONknow the evidence that social determinants are largelyresponsible for the nations’ health and levels of healthinequalities, they retain the focus on health care andcontinue to underfund and overlook actions on thesocial determinants of health.A 2017 survey by the British Social Attitude Survey forthe Health Foundation found almost all, 96 percentof respondents reflected the consistent politicaland media discourse, as they considered free healthcare to have a ‘very large’ or ‘quite large’ impact onhealth and ‘individual behaviours’ close behind, 93percent. Assessments in England and internationallyrepeatedly show that social determinants account formost of health; health care a much lesser extent.A 2019 report from WHO EURO concluded that onlyabout 10 percent of self-reported health relates tohealth care, the rest in varying proportions to fourother social, environmental and economic factors.The public and political debate on health needs tomove towards the social determinants and away fromthe overwhelming focus on individual behavioursand health care; this will help shift political focusand lead to greater investment and action on socialdeterminants. We therefore recommend: Government and Public Health England initiatea highly visible and accessible public debatehighlighting widening health inequalities andaddressing how the social determinants affect health. Development of appropriate public facing reportingmechanisms for inequalities in health.6. Develop whole systems monitoring and strengthenaccountability for health inequalities.Accountability for health inequalities is weak. TheHealth and Social Care Act of 2012 did contain healthinequalities duties and legal accountabilities for healthinequalities, but these have been largely disregardednationally, although NHS England has made someprogress.National Government needs to be accountable forhealth inequalities, and for the range of policiesoutside the health care sector that are necessary foraddressing health inequalities. Reducing inequalitiesis a whole of society endeavour, involving manydifferent parts of government and a range of differentsectors and organisations as well as the public.National government must be responsible for regionaland socioeconomic health inequalities and be heldaccountable for progress. Developing broad targetsto strengthen accountability and galvanise actionis one of number of ways of ensuring that action onhealth inequalities is prioritised.Effective monitoring systems are an essentialcomponent of understanding the nature of healthinequalities, understanding the impacts of policiesand programmes and holding Government andother organisations to account for them. Since 2010,progress has been made in developing system-widemonitoring which incorporates health outcomes andsocial determinants at local level – these types of
monitoring offer opportunities for understanding theimpacts of the social determinants on health at thelocal level – and for designing interventions to improveoutcomes. Data showing regional and socioeconomicinequalities in health is routinely available. Governmentshould demonstrate that it is accountable for progresson these inequalities by actively monitoring indicatorsbased on these data and reporting to the public –much like current health care targets on waiting timesfor example.We therefore propose development of targets to: Bring the level of health of deprived areas in theNorth up to the level of good health enjoyed bypeople living in affluent areas in London and theSouth.In support of meeting those targets we propose to: Strengthen accountability mechanisms for healthinequalities including through legislation Build more effective whole system data sets andimprove data for ethnicity.HEALTH EQUITY IN ENGLAND: THE MARMOT REVIEW 10 YEARS ON9
Inequalities in health since 2010LIFE EXPECTANCY SINCE 2010HEALTH SINCE 2010 Increases in life expectancy have slowed since2010, with the slowdown greatest in moredeprived areas of the country. There is a strong relationship betweendeprivation measured at the small area leveland healthy life expectancy at birth. The poorerthe area, the worse the health. The UK has seen low rates of life expectancyincreases compared with most European andother high-income countries. Inequalities in life expectancy have increasedsince 2010, especially for women. Female life expectancy declined in the mostdeprived 10 percent of neighbourhoodsbetween 2010-12 and 2016-18 and there wereonly negligible increases in male life expectancyin these areas. There are growing regional inequalities in lifeexpectancy. Life expectancy is lower in theNorth and higher in the South. It is now lowestin the North East and highest in London. Within regions, life expectancy for men in themost deprived 10 percent of neighbourhoodsdecreased in the North East, Yorkshire and theHumber and the East of England. Life expectancy for women in the most deprived10 percent of neighbourhoods decreased inevery region except London, the West Midlandsand the North West. For both men and women, the largest decreaseswere seen in the most deprived 10 percentof neighbourhoods in the North East andthe largest increases in the least deprived 10percent of neighbourhoods in London. In every region men and women in the leastdeprived 10 percent of neighbourhoods haveseen increases in life expectancy and differencesbetween regions for these neighbourhoodsare much smaller than for more deprivedneighbourhoods.10HEALTH EQUITY IN ENGLAND: THE MARMOT REVIEW 10 YEARS ON There is a social gradient in the proportion oflife spent in ill health, with those in poorer areasspending more of their shorter lives in ill health. Healthy life expectancy has declined for womensince 2010 and the percentage of life spent in illhealth has increased for men and women.MORTALITY RATES SINCE 2010 There has been no sign of a decrease inmortality for people under 50. In fact, mortalityrates have increased for people aged 45-49. It islikely that social and economic conditions haveundermined health at these ages. For people in their 70s mortality rates arecontinuing to decrease, but not for those atolder ages. The slowdown in life expectancy increasecannot, for the most part be attributed to severewinters. More than 80 percent of the slowdown,between 2011 and 2019, results from influencesother than winter-associated mortality. There are clear socioeconomic gradients inpreventable mortality. The poorest areas havethe highest preventable mortality rates and therichest areas have the lowest.
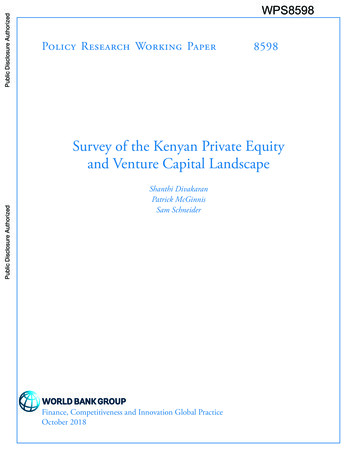
In the 2010 Marmot Review we labelled health inequalities as ‘unjust’ and ‘unnecessary’ and that is still the case.Since 2010 there have been worrying deteriorations in health and widening health inequalities in England andthese are likely related to deteriorations in the social determinants.Figure 2, shows stalling life expectancy in England since 2011, this stalling is unprecedented, at least since theturn of the last century. Life expectancy from 1980 is shown in Figure 2 and the stalling of life expectancy growthis clear for both men and women.Figure 2 Life expectancy at birth for males and females, England, 1981–2018Life expectancyat birth (years)85Females80Males75701980 1982 1984 1986 1988 1990 1992 1994 1996 1998 2000 2002 2004 2006 2008 2010 2012 2014 2016 2018YearSource: ONS, 2019 (2)Inequalities in life expectancy have widened since 2010. The difference in life expectancy at birth between theleast and most deprived deciles was 9.5 years for males and 7.7 years for females in 2016–18. In 2010-12, thecorresponding differences were smaller - 9.1 and 6.8 years, respectively. Life expectancy at birth for males livingin the most deprived areas in England was 73.9 years in 2016-18, compared with 8
happened since 2010 in all the areas except the sixth - ill health prevention. Our reason for not covering the sixth area is that it has been explored in detail by others since 2010 and there have been many programmes and interventions - led by Public Health England and NHS England and public health teams in local government.