Transcription
Estimated Use of Water inthe United States in 2010Circular 1405U.S. Department of the InteriorU.S. Geological Survey
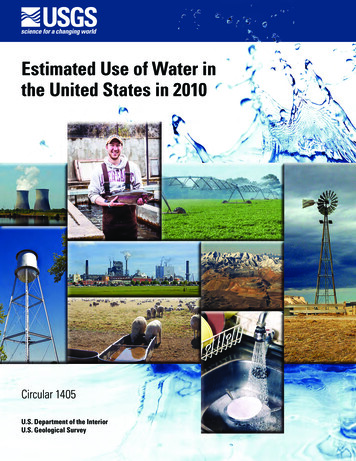
BACFHDEGIFront cover. Photo collage of water use and supply. A, Watts Bar Nuclear Powerplant,Rhea County, Tennessee (photo by Alan Cressler, USGS). B, Student with trout at the AquacultureResearch Institute, Hagerman, Idaho (photo from University of Idaho, used with permission).C, Center-pivot irrigation, Mitchell County, Georgia (photo by Alan Cressler, USGS). D, Windmillon Pawnee Butte Grasslands (photo by Ray Klocek, used with permission). E, Water tower inCouncil, Idaho, Adams County (photo by Justin Woody, used with permission). F, Pulp mill,Wayne County, Georiga (photo by Alan Cressler, USGS). G, Sheep at water trough on the openrange (photo by Saeid Tadayon, USGS). H, Bingham Canyon Mine, Salt Lake County, Utah (photoby Alan Cressler, USGS). I, Domestic water use in the kitchen (photo from Wikimedia Commons).
Estimated Use of Water inthe United States in 2010By Molly A. Maupin, Joan F. Kenny, Susan S. Hutson,John K. Lovelace, Nancy L. Barber, and Kristin S. LinseyCircular 1405U.S. Department of the InteriorU.S. Geological Survey
U.S. Department of the InteriorSALLY JEWELL, SecretaryU.S. Geological SurveySuzette M. Kimball, Acting DirectorU.S. Geological Survey, Reston, Virginia: 2014For more information on the USGS—the Federal source for science about the Earth, its natural and livingresources, natural hazards, and the environment—visit http://www.usgs.gov or call 1-888-ASK-USGSFor an overview of USGS information products, including maps, imagery, and publications,visit http://www.usgs.gov/pubprodTo order this and other USGS information products, visit http://store.usgs.govAny use of trade, product, or firm names is for descriptive purposes only and does not imply endorsement by theU.S. Government.Although this information product, for the most part, is in the public domain, it also may contain copyrighted materialsas noted in the text. Permission to reproduce copyrighted items must be secured from the copyright owner.Suggested citation:Maupin, M.A., Kenny, J.F., Hutson, S.S., Lovelace, J.K., Barber, N.L., and Linsey, K.S., 2014, Estimated use of waterin the United States in 2010: U.S. Geological Survey Circular 1405, 56 p., http://dx.doi.org/10.3133/cir1405.Library of Congress Cataloging-in-Publication DataMaupin, Molly A., author.Estimated use of water in the United States in 2010 / by Molly A. Maupin, Joan F. Kenny, Susan S. Hutson,John K. Lovelace, Nancy L. Barber, and Kristin S. Linsey.pages cm. -- (Circular ; 1405)Includes bibliographical references.ISBN 978-1-4113-3862-3 (pbk. : alk. paper)1. Water consumption--United States. I. Kenny, J. F., author. II. Hutson, Susan S., author. III. Lovelace, John K.,author. IV. Barber, Nancy L., author. V. Linsey, Kristin S., author. VI. Geological Survey (U.S.), issuing body. VII. Title.VIII. Series: U.S. Geological Survey circular ; 1405.TD223.M365 2015333.91’130973--dc232014041921ISSN 1067-084X (Print)ISSN 2330-5703 (Online)
iiiContentsAbstract.1Introduction.2Purpose and Scope.4Terminology Used in This Report .4Changes for the 2010 Report.5Sources of Data and Methods of Analysis.5Total Water Use.7Public ulture.31Industrial.34Mining .37Thermoelectric Power.40Trends in Water Use, 1950 –2010.44References Cited.48Glossary.49Cooperating Agencies and Organizations.52AcknowledgmentsThis national compilation of water use would not be possible without the assistance and dataprovided by the many State and local agencies that manage water resources, operate datacollection programs, and administer regulations for use of water and other natural resources.The agencies and other organizations that provided assistance are listed for each State at theend of this report. The authors also gratefully acknowledge the USGS personnel in each Statewho compiled the data for this report.
ivConversion FactorsMultiplyByTo obtainAreaacre4,047square meter (m2)acre0.4047hectare (ha)acre0.001562square mile (mi2)Volumeacre-foot (acre-ft)1,233acre-foot (acre-ft)325,851acre-foot (acre-ft)43,560cubic meter (m3)gallon (gal)cubic foot (ft3)cubic foot (ft )7.48gallon (gal)gallon (gal)3.785liter (L)gallon (gal)3.785cubic decimeter (dm3)3million gallons (Mgal)million gallons (Mgal)3,7853.07cubic meter (m3)acre-foot (acre-ft)Flow rateacre-foot per year (acre-ft/yr)1,233cubic meter per year (m3/yr)billion gallons per day (Bgal/d)1.3815billion cubic meters per yeargallon per day (gal/d)3.785liter per day (L/d)million gallons per day (Mgal/d)0.04381cubic meter per second (m3/s)million gallons per day (Mgal/d)1.547cubic foot per second (ft3/sec)million gallons per day (Mgal/d)1.121thousand acre-feet per year(acre-ft/yr)million gallons per day (Mgal/d)1.3815million cubic meters per yearthousand acre-feet per year (acre-ft/yr)0.8921million gallons per day (Mgal/d)Energygigawatt-hour (gWh)3,600,000Megajoule (MJ)kilowatt-hour (kWh)3,600,000joule (J)AbbreviationsEPAU.S. Environmental Protection AgencyNWCNational Water CensusNWUIPNational Water Use Information ProgramSDWISSafe Drinking Water Information SystemSECUREScience and Engineering to Comprehensively Understand and Responsibly EnhanceUSDA ARSU.S. Department of Agriculture, Agricultural Research ServiceUSDA NASSU.S. Department of Agriculture, National Agricultural Statistics ServiceUSDA NRCSU.S. Department of Agriculture, Natural Resources Conservation ServiceUSDOE EIAU.S. Department of Energy, Energy Information AdministrationUSGSU.S. Geological Survey
Estimated Use of Water in the United States in 2010By Molly A. Maupin, Joan F. Kenny, Susan S. Hutson, John K. Lovelace,Nancy L. Barber, and Kristin S. LinseyAbstractWater use in the United States in 2010 was estimated tobe about 355 billion gallons per day (Bgal/d), which was13 percent less than in 2005. The 2010 estimates put totalwithdrawals at the lowest level since before 1970. Freshwaterwithdrawals were 306 Bgal/d, or 86 percent of total withdrawals, and saline-water withdrawals were 48.3 Bgal/d,or 14 percent of total withdrawals. Fresh surface-waterwithdrawals (230 Bgal/d) were almost 15 percent less thanin 2005, and fresh groundwater withdrawals (76.0 Bgal/d)were about 4 percent less than in 2005. Saline surface-waterwithdrawals were 45.0 Bgal/d, or 24 percent less than in 2005.Updates to the 2005 saline groundwater withdrawals, mostlyfor thermoelectric power, reduced total saline groundwaterwithdrawals to 1.51 Bgal/d, down from the originally reported3.02 Bgal/d. Total saline groundwater withdrawals in 2010were 3.29 Bgal/d, mostly for mining use.Thermoelectric power and irrigation remained the twolargest uses of water in 2010, and total withdrawals for bothwere notably less than in 2005. Withdrawals in 2010 forthermoelectric power were 20 percent less and withdrawalsfor irrigation were 9 percent less than in 2005. Similarly, otheruses showed reductions compared to 2005, specifically publicsupply (–5 percent), self-supplied domestic (–3 percent), selfsupplied industrial (–12 percent), and livestock (–7 percent).Only mining (39 percent) and aquaculture (7 percent) reportedlarger withdrawals in 2010 compared to 2005. Thermoelectricpower, irrigation, and public-supply withdrawals accountedfor 90 percent of total withdrawals in 2010.Withdrawals for thermoelectric power were 161 Bgal/din 2010 and represented the lowest levels since before 1970.Surface-water withdrawals accounted for more than 99 percentof total thermoelectric-power withdrawals, and 73 percentof those surface-water withdrawals were from freshwatersources. Saline surface-water withdrawals for thermoelectricpower accounted for 97 percent of total saline surface-waterwithdrawals for all uses. Thermoelectric-power withdrawalsaccounted for 45 percent of total withdrawals for all uses, andfreshwater withdrawals for thermoelectric power accountedfor 38 percent of the total freshwater withdrawals for all uses.Irrigation withdrawals were 115 Bgal/d in 2010 andrepresented the lowest levels since before 1965. Irrigationwithdrawals, all freshwater, accounted for 38 percent of totalfreshwater withdrawals for all uses, or 61 percent of totalfreshwater withdrawals for all uses excluding thermoelectricpower. Surface-water withdrawals (65.9 Bgal/d) accountedfor 57 percent of the total irrigation withdrawals, or about12 percent less than in 2005. Groundwater withdrawals were49.5 Bgal/d in 2010, about 6 percent less than in 2005. About62,400 thousand acres were irrigated in 2010, an increase from2005 of about 950 thousand acres (1.5 percent). The numberof acres irrigated using sprinkler and microirrigation systemscontinued to increase and accounted for 58 percent of the totalirrigated lands in 2010.Public-supply withdrawals in 2010 were 42.0 Bgal/d, or5 percent less than in 2005, and represented the first declinesin public-supply withdrawals since the 5-year reporting beganin 1950. Total population in the United States increasedfrom 300.7 million people in 2005 to 313.0 million peoplein 2010, an increase of 4 percent. Public-supply withdrawalsaccounted for 14 percent of the total freshwater withdrawalsfor all uses and 22 percent of freshwater withdrawals for alluses excluding thermoelectric power. The number of peoplethat received potable water from public-supply facilities in2010 was 268 million, or about 86 percent of the total U.S.popu lation. This percentage was unchanged from 2005. Selfsupplied domestic withdrawals were 3.60 Bgal/d, or 3 percentless than in 2005. More than 98 percent of the self-supplieddomestic withdrawals were from groundwater sources.Self-supplied industrial withdrawals were 15.9 Bgal/din 2010, a 12 percent decline from 2005, and continued thedownward trend since the peak of 47 Bgal/d in 1970. Totalself-supplied industrial withdrawals were 4 percent of totalwithdrawals for all uses and 8 percent of total withdrawalsfor all uses excluding thermoelectric power. Most of the total
2 Estimated Use of Water in the United States in 2010self-supplied industrial withdrawals were from surface-watersources (82 percent), and nearly all (93 percent) of thosesurface-water withdrawals were from freshwater sources.Nearly all of the groundwater withdrawals for self-suppliedindustrial use (98 percent) were from freshwater sources.Total aquaculture withdrawals were 9.42 Bgal/d in 2010,or 7 percent more than in 2005, and surface water was theprimary source (81 percent). Most of the surface-waterwithdrawals occurred at facilities that operated flowthroughraceways, which returned the water to the source directlyafter use. Aquaculture withdrawals accounted for 3 percentof the total withdrawals for all uses and 5 percent of thetotal withdrawals for all uses excluding thermoelectric.Total mining withdrawals in 2010 were 5.32 Bgal/d,or about 1 percent of total withdrawals from all uses and3 percent of total withdrawals from all uses excludingthermo electric. Mining withdrawals accounted for the largestpercentage increase (39 percent) in water use between 2005and 2010 among all the categories. Groundwater withdrawalsaccounted for 73 percent of the total mining withdrawals,and the majority of the groundwater was saline (71 percent).The majority (80 percent) of surface-water withdrawals formining was freshwater.Livestock withdrawals in 2010 were 2.00 Bgal/d, or7 percent less than in 2005. All livestock withdrawalswere from freshwater sources, mostly from groundwater(60 percent). Livestock withdrawals accounted for about1 percent of total freshwater withdrawals for all usesexcluding thermoelectric power.In 2010, more than 50 percent of the total withdrawals inthe United States were accounted for by 12 States. Californiaaccounted for about 11 percent of the total withdrawalsand 10 percent of freshwater withdrawals in the UnitedStates, predominantly for irrigation. Texas accounted forabout 7 percent of total withdrawals, predominantly forthermo electric power, irrigation, and public supply. Floridaaccounted for 18 percent of the total saline-water withdrawalsin the United States, mostly from surface-water sources forthermoelectric power. Oklahoma and Texas accounted forabout 70 percent of the total saline groundwater withdrawalsin the United States, mostly for mining.IntroductionThis report, “Estimated use of water in the United Statesin 2010,” is the 13th in a series of U.S. Geological Survey(USGS) Circular reports that have been published every5 years since 1950. The 60-year span of national reportsrepresents the longest compilation record of water-usedata by a Federal agency in the United States. Estimates ofwithdrawals enable the depiction of trends in total water usefor the Nation among different geographic areas, categoriesof use, and sources over time. The USGS is dedicated toproviding reliable scientific information that accuratelydescribes current and historic conditions and enables abetter understanding of the Earth’s precious water resources.Water-use information complements and supports surfacewater and groundwater availability studies and water budgetsthat are critical to these studies. This information is alsoessential to accurately understand how future water demandswill be met while maintaining adequate water quality andquantities for human and ecosystem needs.The National Water Use Information Program (NWUIP)is the USGS program (http://water.usgs.gov/watuse/) thatfacilitates the 5-year compilation of water use and overtime has met various challenges in estimating water usein the United States. The program, however, has reducedsome data collections over time to address limitations ofavailable resources for analysis and limitations of capabilities for accurate interpolations. The National Water Census(NWC) is a recent USGS program, implemented as part ofthe SECURE (Science and Engineering to ComprehensivelyUnderstand and Responsibly Enhance) Water Act(Subtitle F of Public Law 111–11, the Omnibus Public LandManagement Act) to study national water availability anduse by integrating diverse research and building new wateraccounting tools, such as decision support capacity. Thesetools and research are designed to enable water managers toaccurately assess water availability at regional and nationalscales (http://water.usgs.gov/watercensus/). To meet NWCgoals of building water budget assessments at regional andnational scales, accurate and complete water-use estimatesare necessary. The NWUIP is working closely with the NWCto provide water-use data for accurate water budget assessments in the NWC study areas. To meet these goals, severalwater-use specific research studies supported by the NWCwere begun, some are completed, and some are ongoing.Each study specifically addresses a water-use data collection challenge, such as improvement in the dissemination ofinformation on data inventories, collection of more accurateinformation, use of better methods for analysis, and upgradeof data dissemination tools.NWC-supported projects with direct relevance to wateruse were conducted concurrently with the NWUIP 2010compilation efforts and focused on the three largest categories of water use, irrigation, thermoelectric power, and publicsupply. For irrigation water use, methods and documentation were synthesized into a national report using the 2000and 2005 compilation data and suggested improved estimation methods (Dickens and others, 2011). Additionally,methods were developed to assist in estimating irrigationwater use in humid Eastern States, using two predictivemodels that use climate, soils, and crop data to explain thepotential for irrigation (Levin and Zarriello, 2013). Forthermoelectric power, linked heat and water budget modelswere developed for 1,290 thermoelectric powerplants inthe United States (Diehl and others, 2013). This projectentailed a indepth inventory of powerplants and associatedinformation. Data from this project considerably improved
Introduction 3The Boise River Diversion Dam in Ada County, Idaho, was completed in 1909 and diverts water into the New York Canal, theprimary irrigation canal for Ada and Canyon Counties. Photo by Jeff Woody, used with permission.the NWUIP understanding of the cooling systems used atindividual powerplants as well as provided a more completeinventory of powerplant locations and net power generation.On the basis of the water budget models, Diehl and Harris(2014) reported powerplant-specific estimates of withdrawals and consumptive use. For public supply, the U.S.Environmental Protection Agency (EPA) provided a publicsupply dataset from the Safe Drinking Water InformationSystem (SDWIS). These data included site-specific well,surface-water intake, and distribution-system information, which was filtered through a USGS database (Priceand Maupin, 2014) and enhanced for quality control usingassociated USGS data. These data were disseminated as Statedatasets to each USGS Water Science Center to help constructa site-specific database capable of storing public-supply withdrawal, distribution, use, and return data for each State.Data dissemination capabilities and data-collection effortshave improved over the course of each 5-year compilation.The online resource, “USGS Water Use Data for the Nation”(http://waterdata.usgs.gov/nwis/wu), provides the best available county water-use data (1985–2010). These county-levelestimates are the foundation for the statewide totals presentedin each 5-year compilation report and are stored, updated, anddisseminated using the USGS National Water InformationSystem (NWIS) database. Data are retrievable as county, State,and national totals for each category of use as reported in the5-year compilation reports. Because data are updated periodically and revised during interim years, the Web site will enablequick and easy access to the most current water-use data.Factors such as demographics, new manufacturing andcooling-system technologies, economic trends, legal decisions,and climatic fluctuations have varying effects on water use.Between 2000 and 2010, population growth in the U.S.was 9.7 percent, lower than the 13.2 percent growth for the1990–2000 period (U.S. Census Bureau, 2011). More population growth was recorded in Southern and Western States(14.3 and 13.8 percent, respectively) between 2000 and 2010compared to Midwestern States (3.9 percent) and NortheasternStates (3.2 percent). Southern and Western States accountedfor more than 84 percent of the total U.S. population growthfrom 2000 to 2010. Population growth puts additional pressureon existing public utilities and increases demand on sometimes already limited water supplies. In parts of the UnitedStates, communities have sought additional water sources orinstituted water-conservation measures to meet increasingdemands. New cooling-system technologies and wastewatermanagement practices at thermoelectric powerplants andindustrial facilities are examples of water-saving practices thatare being implemented. Powerplants have reduced the demandfor cooling water by implementing more efficient coolingsystems, such as changing to recirculating systems or buildingnew plants with dry-cooling systems. Industrial facilities are
4 Estimated Use of Water in the United States in 2010using more efficient water-conserving manufacturing technologies, driven by higher costs for water and energy. Industrialmanufacturing has declined with more goods being producedoutside of the United States. Increases in industrial reuse andrecycling of wastewater help to reduce withdrawals from theavailable resources and treated discharges to surface watersover time.Climate fluctuations affect water use, particularly forirrigation, power generation, and public supply. In 2010,the contiguous United States (CONUS) experiencedaverage annual air temperatures slightly above normaland precipi tation above the long-term average. An abnormally cold winter with abundant moisture resulted inrecord-breaking precipitation in the East and Northeast forDecember–February. While the East enjoyed an abnormallywarm spring, the Western United States experienced belownormal temperatures. The summer of 2010 was the fourthwarmest on record for the CONUS, but was the ninth wettestin 116 years in the Upper Midwest and Great Lakes. TheWest and Southeast had below-normal precipitation duringthe summer. The fall of 2010 was warmer than normal,but the Upper Midwest and Northeast continued to receiveabove-average precipitation, while Florida suffered throughthe second driest September–November period on record(National Oceanic and Atmospheric Administration NationalClimatic Data Center, 2010).Cooling-system technology in thermoelectric powerplants has dramatically improved in recent years, causinglarge changes in withdrawals between 2005 and 2010.Improvements driven by the Clean Water Act and othereconomic factors have changed the way industrial facilitiesuse, reuse, and recycle water, resulting in reduced dischargesto wastewater-treatment plants or surface-water bodies.Cooling water is essential for producing most of the thermoelectric power in the United States, and an increase in electricenergy use has resulted in additional demands for water.Limitations on water supplies have led to the use of lesswater-intensive cooling technologies for producing thermoelectric power in newer powerplants.Purpose and ScopeThis report presents average daily withdrawals (in millionsof gallons per day) for calendar year 2010, by source (groundwater and surface water) and quality (fresh and saline) forthe 50 States, the District of Columbia, Puerto Rico, andthe U.S. Virgin Islands (hereafter referred to as “States” forbrevity). Withdrawals are reported by category of use: publicsupply, domestic (including self-supplied domestic anddeliveries from public supply), irrigation, livestock, aquaculture, self-supplied industrial (referred to as “industrial”for brevity), mining, and self-supplied thermo electric power(referred to as “thermoelectric power” for brevity). Salinewater is defined as water containing dissolved solids of1,000 milligrams per liter or more. All withdrawals for thepublic supply, domestic, irrigation, and livestock categoriesare reported as totals, although in some areas water is treatedto reduce salinity for these uses. Aquaculture totals includea small amount of saline surface-water withdrawals fortwo States. Both freshwater and saline-water withdrawalsare reported for industrial, mining, and thermoelectricpower uses.The series of 5-year national water-use estimates compiledby the USGS serves as one of the few sources of informationabout regional and national trends in water withdrawals.These historical reports (MacKichan, 1951, 1957; MacKichanand Kammerer, 1961; Murray, 1968; Murray and Reeves,1972, 1977; Solley and others, 1983, 1988, 1993, 1998;Hutson and others, 2004, Kenny and others, 2009) are available online at e data between 1950 and 2010 produced for the5-year national water-use estimates are available online athttp://waterdata.usgs.gov/nwis/wu/. County-level data areavailable only for 1985–2010 from the same Web siteTerminology Used in This ReportA glossary of the terms and units used in this report islocated at the end of the report and is available online athttp://water.usgs.gov/watuse/wuglossary.html. Terms andunits depicting withdrawals and ancillary data for the 5-yearcompilations have not changed since 2000. Withdrawal foreach category of use represents the total amount of waterremoved from the water source for a particular use, regardlessof how much of that total is consumptively used or returnedto the hydrologic system for future use. In most cases, somefraction of the total withdrawal will be returned to a watersource after use and will be available for other subsequentuses. Consumptive use, however, precludes the subsequentwithdrawal for another use, at least temporarily, because itrepresents that fraction of water that is removed from availability due to evaporation, transpiration, or incorporationinto products or crop, or consumed by livestock or human.Estimates of return flows and consumptive use were discontinued after 1995, primarily because of resource and dataconstraints on the USGS National Water Use InformationProgram (NWUIP). Recent efforts by other programs incoordination with NWUIP have been implemented toreinstate the consumptive-use estimates for thermoelectricpower and irrigation, but those data are not included in thisreport. Estimates of wastewater reuse were compiled by someStates for the industrial, thermoelectric power, and irrigationcategories, but these estimates were not included in the totalsreported in tables in this report because of the small volumesof water compared to the totals and the incomplete reportingacross the Nation.Withdrawals are expressed in terms of millions of gallonsper day and thousands of acre-feet per year. The term billions
Introduction 5by Energy Informationof gallons per day isAdministration (EIA)used in the Abstract andwere used to estimateTrends in Water Usethermoelectric-powersections of this reportwithdrawals. As in 2005,to more simply expresslarge numbers for totaldeliveries from publicuses. Units of millionssupply for domestic useor billions of gallonswere again compiled inper day do not repre2010, but public-supplysent actual daily rates,deliveries for commerbut rather are used tocial, industrial, andexpress total amountsthermoelectric-poweras an average dailyuses were not. Data wererate over a single year.not compiled for hydroWater demands fluctuatelogic units (watersheds).seasonally and may beData were not compiledvery different betweenfor commercial waterhot summer months anduse, hydroelectric-powercold winter months.generation, wastewaterTherefore, withdrawaltreatment (returns),estimates in this reportconsumptive use by caterepresent the total annualgory of use, and conveywithdrawals averagedance losses. Some ofover 365 days.these additional data mayWithdrawals arehave been collected byrounded to three signifiindividual States but arecant figures. All valuesnot compiled as a nationalare rounded independataset or included indently, so the sumsthis report.of individual roundedThe Trends in Waternumbers may not equalUse section of this reportthe totals. The percentageincludes national totalsFountain water display, Meridian, Idaho. Photo by Molly Maupin, USGS.of changes discussedfor withdrawals byin the text are calculatedcategory of use and sourcefrom the unrounded data and are expressed as integers. Allof water from 1950 to 2010. Totals have changed for somepopulation data are rounded to three significant figures. Incategories and years because of revisions to individual Statediscussions of States that compose the majority of withdrawals data during interim years. Because of these revisions, some offor a given category, the State names are listed in order ofthe percentage changes in this report will be slightly differentdecreasing magnitude of withdrawals.from data published previously by Kenny and others (2009).Changes for the 2010 ReportSources of Data and Methods of AnalysisA matrix showing the different categories of use and howthe terminology has changed over time is available online .html.Links to definitions
49.5 Bgal/d in 2010, about 6 percent less than in 2005. About 62,400 thousand acres were irrigated in 2010, an increase from 2005 of about 950 thousand acres (1.5 percent). The number of acres irrigated using sprinkler and microirrigation systems continued to increase and accounted for 58 percent of the total irrigated lands in 2010.
