Transcription
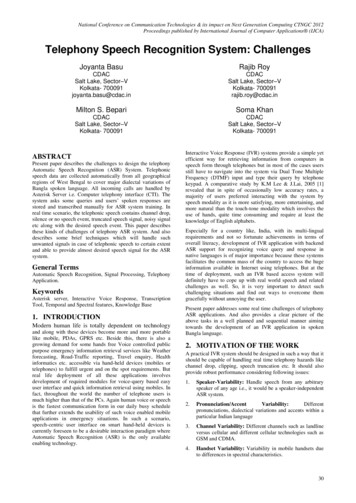
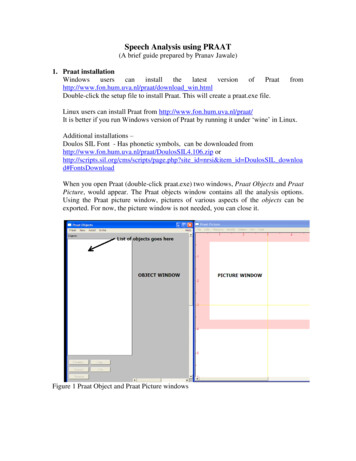
Speech Analysis using PRAAT(A brief guide prepared by Pranav Jawale)1. Praat ofPraathttp://www.fon.hum.uva.nl/praat/download win.htmlDouble-click the setup file to install Praat. This will create a praat.exe file.fromLinux users can install Praat from http://www.fon.hum.uva.nl/praat/It is better if you run Windows version of Praat by running it under „wine‟ in Linux.Additional installations –Doulos SIL Font - Has phonetic symbols, can be downloaded .zip orhttp://scripts.sil.org/cms/scripts/page.php?site id nrsi&item id DoulosSIL download#FontsDownloadWhen you open Praat (double-click praat.exe) two windows, Praat Objects and PraatPicture, would appear. The Praat objects window contains all the analysis options.Using the Praat picture window, pictures of various aspects of the objects can beexported. For now, the picture window is not needed, you can close it.Figure 1 Praat Object and Praat Picture windows
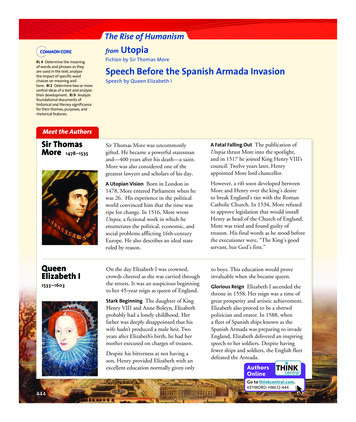
In the Praat Objects window click Read - Read from fileThen a file selection window will appear. Browse, locate and select „machali.wav‟.Click Open. Highlight its name in the list of objects and click Edit.Figure 2 Waveform and spectrogram of machali.wavPlay the file. What is it playing?Zoom into shorter segments of the waveform and observe the acoustic properties of thevarious phones: periodicity, energy, average zero-crossing rate, formants.2. Various spectrogram settings in PraatNow we will look into the spectrogram settings.Click Spectrum - Spectrogram settings
Figure 3 Default spectrogram settingsExplanation of parameters (from The Praat intro manual [1]) View range (Hz) – Range over which the spectrogram is shown. To view thespectrogram over whole frequency range, max frequency should be half thesampling rate (8000/2 4000 Hz). Spectrogram will be blank for frequencieshigher than the Nyquist frequency if they are displayed. Window length (s) – To compute short time Fourier transform Praat uses analysiswindows (frames) each of length as specified by the window length parameter.For a window length of 0.005 s, Praat uses for each frame the part of the soundthat lies between 0.0025 seconds before and 0.0025 seconds after the centre ofthat frame. Dynamic range (dB) – All values that are more than Dynamic range dB below themaximum will appear white. Values in-between have appropriate shades of grey.Thus, if the highest peak in the spectrogram has a height of 30 dB/Hz, and thedynamic range is 50 dB (which is the standard value), then values below -20dB/Hz will be drawn in white, and values between -20 dB/Hz and 30 dB/Hz willbe drawn in various shades of grey.
Now click Spectrum - Advanced spectrogram settingsFigure 4 Default advanced spectrogram settingsExplanation of some parameters (from The Praat intro manual [2]) Number of time steps - The maximum number of points along the time windowfor which Praat has to compute the spectrum. If your screen is not wider than1200 pixels, then the standard of 1000 is appropriate, since there is no point incomputing more than one spectrum per one-pixel-wide vertical line. Number of frequency steps - The maximum number of points along the frequencyaxis for which Praat has to compute the spectrum. If your screen is not taller than768 pixels, then the standard of 250 is appropriate, since there is no point incomputing more than one spectrum per one-pixel-height horizontal line. Window shape – Default is Gaussian window. You can change it to Rectangular,Hamming, Hanning etc. (See [1] under Further Reading)
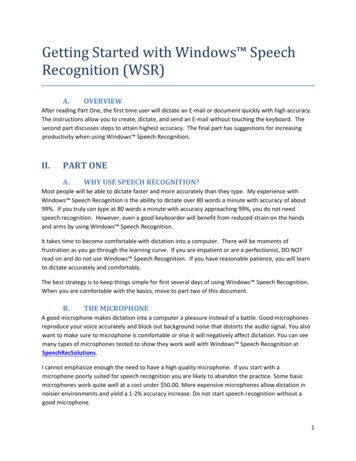
3. Wideband and narrowband spectrogramsSpeech spectrograms are called as wideband or narrowband based on what windowlength is used. Shorter the window, larger its bandwidth and the spectrogram is awideband one. Similarly if the window is larger, the spectrogram is called as narrowband.Now, how much window length corresponds to either of these? There is no clear cutboundary but for a speech sample, if the window length is around 3 - 5 ms (bandwidth 200 - 300 Hz), the resulting spectrogram is called as wideband. For the window lengtharound 20 – 30 ms (bandwidth 30 - 50 Hz), the spectrogram is called as narrowband.What is the significance of these two types of spectrograms?Wideband spectrogram is used to observe the formant structure while narrowbandspectrograms reveal the harmonic structure (pitch information). Let‟s say you use awindow length of 20 ms. With this window length, voice harmonics are resolved muchclearly as frequency resolution between them is generally 50 Hz (1/0.02). If thewindow is shortened to say 3 ms, then the spectra of two or three voice harmonics willmerge and instead of individual harmonics you will see structure of formants in thespectrogram.As an example, zoom in to a section of machali.wav depicting phoneme /m/. Play it.Keep advanced spectrogram settings at their default values (by clicking Standardsbutton) and observe the waveform and spectrogram for these two settings. Note:changing dynamic range only changes the spectrogram intensity settings. To view theformants clearly, we have reduce it to 30 dB.Table 1 Window lengths for narrowband and wideband spectrogramsParameterWindow length (s)Dynamic range (dB)Setting 10.0250Setting 20.00550Setting30.00530
Figure 5 Spectrograms of /m/ in “machali” for two different window lengths (30 ms and5 ms)In Fig 9, when the window length is 30 ms, we can see many horizontal black lines in thespectrogram which correspond to harmonics of the pitch frequency. As the windowlength is made 5 ms, we can no longer distinguish between various harmonics, but wecan see the formants. The vertical dark lines in the spectrogram indicate glottal pulses.Now zoom out (click all) and observe the whole spectrogram for the two settings inTable 4.
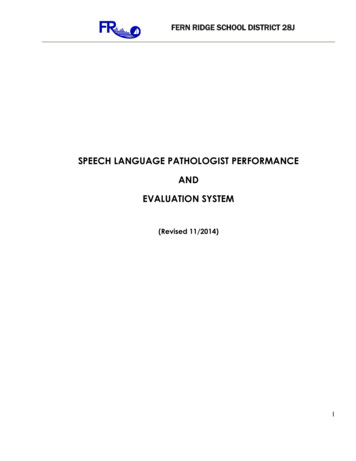
4. Analysing different phonemes4.1 Observing formantsFigure 6 Waveform and wideband spectrogram for /n/ in paani. Window length 5 ms.Zoom in to the part in waveform where /n/ in paani is located. It is characterized byabrupt discontinuities in the spectrum at the beginning and end. Note the loss of intensityin the spectrogram due to the anti-resonances. Nasals are waveform-wise differentiatedby their lower amplitudes (as compared to vowels).
Figure 7 Waveform and wideband spectrogram of /i:/ in “paani”Now observe /i:/ in “jal ki”. Observe the different formants. What are their frequencies?The phoneme, /i:/, has the maximum distance between F1 and F2 of all the vowels.Figure 8 Waveform and wideband spectrogram of A in “paani”
Now look at the spectrogram of /A/ in “paani”. Where do its first three formants lie?Figure 9 Closure and burst regions of /k/ in “jal ki”Let‟s look at the waveform of /k/ in “jal ki”. We can divide into two regions.First, the closure and second the burst region. In this example we can see twobursts along with some frication in the burst region.Figure 10 Closure and burst regions in /p/ in “paani”Zoom in to waveform of /p/ in “paani”. As can be seen, /p/ has a very short burstregion.5.2 Finding PitchNow we will see how to determine pitch from waveform and spectrogram. Firstlet‟s find out pitch of /i:/ in “paani”. Observe the periodicity in the waveform.Compute its pitch by finding inverse of the time duration after which thewaveform repeats itself. You can use Get selection length function to get theexact time duration of any selection (see Fig 15).
Figure 11 Finding selection length of section of a waveform of /i:/ in “paani”What value of pitch did you find out?Let‟s not change the spectrogram settings so that it shows the harmonics. Changethe window length to 0.03 s. The difference in Hz between adjacent harmonics isthe pitch. You can find an approximate value of pitch using this method. Is it thesame as you found out from waveform analysis?However, note that pitch is equal to the difference in Hz between the harmonicsonly when all the harmonics are present in the audio sample. If some harmonicsare missing, you will compute a wrong value of the pitch. Waveform analysis canalmost always tell you the correct value of pitch.Figure 12 Waveform and narrowband spectrogram of /i:/ in “paani”
A more accurate way to detect the pitch from the spectrum: Select two/threeperiods of waveform and click Ctrl L (Or go to Spectrum - View spectralslice). This shows a Magnitude Vs Frequency plot drawn after computing FFT.The difference in Hz between any of the high energy adjacent peaks will give youthe pitch value.Figure 13 Spectral slice of /i:/ in “paani”
Now use the waveform and spectral slice methods to find out pitch of /m/ in“machali” (Fig 18).Figure 14 Waveform and spectral slice for /m/ in “machali”Measure the pitch at several points in the voiced segments of the utterance. See how itvaries with time across the utterance.
References:1. http://www.fon.hum.uva.nl/praat/manual/Intro 3 2 Configuring the ro.html2. http://www.fon.hum.uva.nl/praat/manual/Advanced spectrogram settings .html3. /praatusers/message/2431Further Reading:1. Harris, F.J. "On the Use of Windows for Harmonic Analysis with the DiscreteFourier Transform." Proceedings of the IEEE. Vol. 66, No. 1 (January 1978)2. manitoba.ca/ robh/howto.html
In the Praat Objects window click Read - Read from file Then a file selection window will appear. Browse, locate and select „machali.wav‟. Click Open.Highlight its name in the list of objects and click Edit. Figure 2 Waveform and spectrogram of machali.wav