Transcription
MalawiMalariaIndicator Survey2014
MalawiMalaria Indicator Survey2014Ministry of HealthNational Malaria Control ProgrammeLilongwe, MalawiThe DHS ProgramICF InternationalRockville, Maryland, U.S.A.February 2015
This report presents the findings of the 2014 Malawi Malaria Indicator Survey (2014 MMIS) conducted by theNational Malaria Control Programme (NMCP) of the Ministry of Health from 2 May through 10 June 2014. Thegovernment of Malawi provided financial assistance in terms of in-kind contribution of personnel, office space,and logistical support. Principal funding partners for the MMIS are the Global Fund to Fight AIDS,Tuberculosis and Malaria (Global Fund) and the President’s Malaria Initiative (PMI). The Global Fundsupported the local costs of the survey, and PMI supported the survey through ICF International, whichprovided technical assistance through The DHS Program. The DHS Program is a worldwide project funded bythe United States Agency for International Development (USAID) and is designed to assist developing countriescollect data on fertility, family planning, and maternal and child health. The opinions expressed in this report arethose of the authors and do not necessarily reflect the views of USAID.Additional information about the 2014 MMIS may be obtained from the National Malaria Control Programme,P/Bag 65, Mtunthama Drive, Lilongwe, Malawi.Information about The DHS Program may be obtained from ICF International, 530 Gaither Road, Suite 500,Rockville, MD 20850, USA (Telephone: 1-301-407-6500; Fax: 1-301-407-6501; E-mail: info@DHSprogram.com;Internet: http://www.DHSprogram.com).Cover photos: 2011 Gomezani Jenda, PMI/Malawi. Used with permission.Recommended citation:National Malaria Control Programme (NMCP) [Malawi] and ICF International. 2014. Malawi MalariaIndicator Survey (MIS) 2014. Lilongwe, Malawi, and Rockville, Maryland, USA: NMCP and ICF International.
CONTENTSTABLES AND FIGURES . vPREFACE . viiACKNOWLEDGEMENTS . ixACRONYMS. xiMAP OF MALAWI . xii1INTRODUCTION . 11.1Country Profile. 11.1.1Geography . 11.1.2Economy . 11.1.3Health Indicators. 11.2Background on Malaria in Malawi . 21.3Objectives of the Malawi Malaria Indicator Survey . 31.4Methodology of the 2014 Malawi Malaria Indicator Survey . 41.4.1Survey Organisation . 41.4.2Sample Design . 41.4.3Questionnaires . 51.4.4Anaemia and Malaria Testing . 51.4.5Training . 61.4.6Fieldwork . 71.4.7Laboratory Testing. 71.4.8Data Processing . 81.5Response Rates . 82CHARACTERISTICS OF HOUSEHOLDS AND WOMEN . 92.1Household Environment . 92.1.1Drinking Water . 92.1.2Household Sanitation Facilities . 102.1.3Housing Characteristics . 112.1.4Sleeping Spaces . 122.2Household Possessions . 132.3Wealth Index . 132.4Population by Age and Sex . 142.5Household Composition . 162.6Characteristics of Women Respondents . 162.6.1General Characteristics . 162.6.2Education Attainment of Women . 172.6.3Literacy of Women . 183MALARIA PREVENTION . 213.1Vector Control . 213.1.1Ownership of Mosquito Nets . 223.1.2Indoor Residual Spraying . 243.2Access to Mosquito Nets. 253.2.1Use of Mosquito Nets by Household Population . 263.2.2Use of Mosquito Nets by Children under Age 5 . 273.2.3Use of Mosquito Nets by Pregnant Women. 293.3Intermittent Preventive Treatment of Malaria in Pregnancy . 313.4Preference for Colour and Shape of Mosquito Net . 334MANAGEMENT OF FEVER, ANAEMIA, AND MALARIA IN CHILDREN. 374.1Prevalence, Diagnosis, and Prompt Treatment of Children with Fever . 374.2Malaria Case Management among Children . 394.3Anaemia and Malaria Prevalence among Children . 404.3.1Anaemia Prevalence among Children . 424.3.2Malaria Prevalence among Children . 42Contents iii
5MALARIA KNOWLEDGE . 455.1Knowledge of Malaria . 455.2Exposure to Malaria Messages. 47REFERENCES . 51APPENDIX AA.1A.2A.3A.4A.5SAMPLE DESIGN. 53Sampling Frame and Stratification. 53Sample Allocation and Selection . 53A.2.1 Sample Allocation . 53A.2.2 Selection of Clusters . 56Selection of Households. 56Estimation Procedure . 57Sample Implementation . 58APPENDIX BESTIMATES OF SAMPLING ERRORS . 59APPENDIX CDATA QUALITY TABLES . 63APPENDIX DSURVEY PERSONNEL . 65APPENDIX E QUESTIONNAIRES . 67Household Questionnaire . 69Biomarker Questionnaire . 83Woman’s Questionnaire . 91iv Contents
TABLES AND FIGURES1INTRODUCTION . 1Table 1.1Demographic indicators . 2Table 1.2Results of the household and individual interviews . 82CHARACTERISTICS OF HOUSEHOLDS AND WOMEN . 9Table 2.1Household drinking water . 10Table 2.2Household sanitation facilities . 11Table 2.3Household characteristics . 12Table 2.4Percent distribution of households by number of sleeping spaces and number ofmosquito nets . 12Table 2.5Household possessions. 13Table 2.6Wealth quintiles . 14Table 2.7Household population by age, sex, and residence. 15Table 2.8Household composition . 16Table 2.9Background characteristics of respondents . 17Table 2.10 Educational attainment. 18Table 2.11 Literacy . 19Figure 2.13MALARIA PREVENTION . 21Table 3.1Household possession of mosquito nets. 23Table 3.2Indoor residual spraying against mosquitoes . 24Table 3.3Access to an insecticide-treated net (ITN) . 25Table 3.4Use of mosquito nets by persons in the household . 27Table 3.5Use of mosquito nets by children . 28Table 3.6Use of mosquito nets by pregnant women . 30Table 3.7Prophylactic use of antimalarial drugs and use of Intermittent Preventive Treatment(IPTp) by women during pregnancy . 32Table 3.8Preference for colour of mosquito net. 34Table 3.9Preference for shape of mosquito net . 34Table 3.10 Preference for shape of mosquito net by reason . 35Figure 3.1Figure 3.2Figure 3.3Figure 3.4Figure 3.54Population pyramid . 15Trend in ownership of at least one ITN, 2010, 2012, and 2014 . 23Percentage of the de facto population with access to an ITN in the household . 26Trend in ITN use by children under age 5, 2010, 2012, and 2014 . 29Trend in use of ITN by pregnant women age 15-49, 2010, 2012, and 2014 . 31Trend in percentage of pregnant women who gave birth in the two years beforethe survey who received two or more doses of SP, 2010, 2012, and 2014 . 33MANAGEMENT OF FEVER, ANAEMIA, AND MALARIA IN CHILDREN. 37Prevalence, diagnosis, and prompt treatment of children with fever . 38Table 4.1Table 4.2Source of advice or treatment for children with fever . 39Table 4.3Type and timing of antimalarial drugs used . 40Table 4.4Coverage of testing for anaemia and malaria in children age 6-59 months . 41Table 4.5Severe anaemia in children age 6-59 months . 42Table 4.6Prevalence of malaria in children age 6-59 months . 43Figure 4.1Prevalence of malaria among children under age 5, based on microscopy results,2010, 2012, and 2014 . 44Tables and Figures v
5MALARIA KNOWLEDGE . 45Table 5.1Women’s knowledge of malaria . 46Table 5.2Messages about malaria . 47Table 5.3Source of malaria messages . 49Figure 5.1Trends in knowledge about malaria . 46APPENDIX A SAMPLE DESIGN. 53Table A.1 Sample and total population proportion by stratum, 2014 Malawi MIS . 53Table A.2 Distribution of SEAs by Urban/Rural location for districts in Northern Region,2014 Malawi MIS . 54Table A.3 Distribution of SEAs by Urban/Rural location for districts in Central Region,2014 Malawi MIS . 54Table A.4 Distribution of SEAs by Urban/Rural location for districts in Southern Region,2014 Malawi MIS . 54Table A.5 Sample implementation: Women . 58Figure A.1Location of selected SEAs in the 2014 Malawi MIS . 55APPENDIX B ESTIMATES OF SAMPLING ERRORS . 59Table B.1 List of selected variables for sampling errors, Malawi MIS 2014 . 60Table B.2 Sampling errors: Total sample, Malawi MIS 2014 . 61Table B.3 Sampling errors: Urban sample, Malawi MIS 2014 . 61Table B.4 Sampling errors: Rural sample, Malawi MIS 2014. 61Table B.5 Sampling errors: Northern sample, Malawi MIS 2014 . 61Table B.6 Sampling errors: Central sample, Malawi MIS 2014 . 62Table B.7 Sampling errors: Southern sample, Malawi MIS 2014 . 62APPENDIX C DATA QUALITY TABLES . 63Table C.1 Household age distribution . 63Table C.2 Age distribution of eligible and interviewed women . 64Table C.3 Completeness of reporting . 64vi Tables and Figures
PREFACEMalaria continues to be a major public health problem in Malawi, with an estimated 4 millioncases occurring annually. Its effects are greatest among children under age 5 and pregnantwomen. The Ministry of Health, in collaboration with its partners, has been implementing theNational Malaria Strategic Plan 2011–2016 with the goal of scaling up malaria interventions towardsattainment of the national vision of a ‘Malaria-free Malawi.’ Specifically, we strive for progress inachieving prompt and effective antimalarial drug treatment, use of insecticide-treated nets and indoorresidual spraying, and prevention of malaria in pregnancy.We have set for ourselves high coverage targets for these interventions. By setting high targets, weare confident of our ability to reach our strategic goals of reducing the incidence of malaria and deathsfrom malaria as well as reducing the prevalence of malaria parasites and malaria-related anaemia.Measurement is essential for understanding progress towards these goals. Without measurement,we can only speculate on progress. The 2014 Malawi Malaria Indicator Survey is the country’s thirdnationally representative assessment of the coverage attained by key malaria interventions. Theseinterventions are reported in combination with measures of malaria-related burden and anaemia prevalencetesting among children under age 5.Overall, there has been considerable progress in scaling up interventions and controlling malaria.We noted a decline in malaria prevalence from the 2010 value of 43 percent to the 2014 value of 33percent. Net ownership has increased from 58 percent in 2010 to 70 percent in 2014. Results of the 2014MIS also show an improvement on use of IPTp among pregnant women. Coverage has increased from 54percent in 2012 to 63 percent in 2014. Changes in antimalarial drug policy have provided challenges toincreasing effective antimalarial treatment. Nevertheless, more children than before are receivingartemisinin-based combination therapy, and we expect these numbers to continue to increase.These results represent the combined work of numerous partners contributing to the overall scaleup of malaria interventions. I would like to request that all partners make use of the information presentedin this report as they implement projects to surmount the challenges depicted here.Finally, I would like to thank the National Malaria Control Programme for taking a leading role inthis survey and all of those who travelled to various areas of Malawi, including the most remote parts ofthe country, to collect data. Most important, I thank the survey respondents for their contributions to thissurvey. Together, we can kick malaria out of Malawi.Dr. Chris Kang’ombeSecretary for HealthMinistry of HealthPreface vii
ACKNOWLEDGEMENTSThis report presents the results of the 2014 Malawi Malaria Indicator Survey (MMIS), the thirdcomprehensive, nationally representative household survey designed to measure progress towardsachieving the goals and targets set forth in the National Malaria Strategic Plan 2011–2016. Itrepresents the efforts of several agencies and many individuals. The Ministry of Health (MoH), through theNational Malaria Control Programme (NMCP), had the major responsibility of conducting the survey. Thesurvey was funded by the Global Fund to Fight against HIV/AIDS, Tuberculosis and Malaria (GFATM),and the U.S. President’s Malaria Initiative (PMI). Other agencies that have been instrumental in this surveyinclude the National Statistical Office (NSO), the World Health Organization (WHO), and the Universityof Malawi’s College of Medicine.Within the Ministry, the following individuals provided overall survey leadership and guidance:Chris Kang’ombe, the Secretary for Health; Dr. Storn Kabuluzi, Director of Preventive Health Services;Doreen Ali, Deputy Director of Preventive Health Services (Malaria); and Dr. Ben Chilima, DeputyDirector of Preventive Health Services (National Public Laboratories). The implementation of the 2014MMIS was guided by the Steering Committee under the leadership of Prof. Malcolm Molyneux.Misheck Luhanga was the MIS Coordinator. He was supported by NMCP staff: Austin Gumbo,John Chiphwanya, John Sande, Dubulao Moyo, Evans Kaunda, Shadreck Mulenga, and Clifton Gondwe.Staff of the National Public Health Laboratory included Yassin Madingore, Sunday Jere, James Kaphiyo,and Mathews Mhone, who participated in the field staff training and fieldwork, supervised the laboratorytechnicians, and read the blood specimen slides.The NSO Commissioner, Mercy Kanyuka, and NSO staff, Isaac Chirwa, Kingsley Manda, andSautso Wachepa, provided support for the household listing and sample selection. ICF International staff,Sri Poedjastoeti and Keith Purvis, provided assistance with survey organisation and training, logistics andprocurement of supplies, data collection, processing, and analysis. Geofrey Lutwama provided support inthe use of computer tablets. Wilfred Dodoli of WHO provided support for training.The District Health Offices worked with the survey teams and provided artemesinin-basedcombination therapy for the treatment of children who participated in the survey and tested positive formalaria. The Health Education Unit of the MoH supported the programme on communication andawareness about the survey. In addition, various MoH personnel assisted with organisation, communitysensitisation efforts, logistics, ordering of supplies, and training.A complete list of the field teams and individuals involved in the survey is presented inAppendix D.Acknowledgements ix
ACRONYMSACTASAQArtemisinin-based combination therapyAmodiaquine artesunateDHODHSDistrict Health OfficeDemographic and Health SurveysEAEPIEnumeration areaExpanded Programme on ImmunisationIPTpIRSITNIntermittent preventive treatment (of malaria) in pregnancyIndoor residual sprayingInsecticide-treated netLALLINLocal name of artemether-lumefantrineLong-lasting insecticidal netMDGMERGMICSMISMKWMoHMillennium Development GoalMonitoring and Evaluation Reference GroupMultiple Indicator Cluster SurveyMalaria Indicator SurveyMalawian KwachaMinistry of HealthNMCPNMSPNPHLNSONational Malaria Control ProgrammeNational Malaria Strategic PlanNational Public Health LaboratoryNational Statistical OfficePDAPMIPersonal digital assistantUS President’s Malaria InitiativeRBMRDTRoll Back MalariaRapid diagnostic testSEASPStandard enumeration areaSulphadoxine-pyrimethamineUNICEFUSAIDUnited Nations Children’s FundUnited States Agency for International DevelopmentWBCWHOWhite blood cellWorld Health OrganizationAcronyms xi
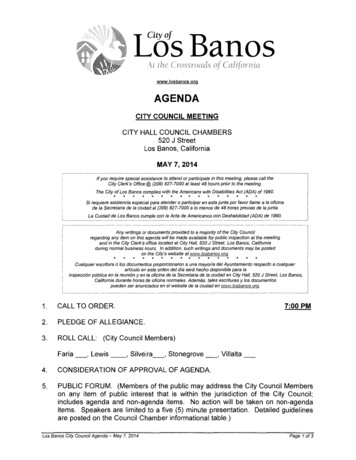
xii Map of Malawi
INTRODUCTION1.1COUNTRY PROFILE1.1.1Geography1Malawi is a sub-Saharan African country located south of the equator. It is bordered to the northand northeast by the United Republic of Tanzania; to the east, south, and southwest by the People’sRepublic of Mozambique; and to the west and northwest by the Republic of Zambia.The country is 901 kilometres long and 80 to 161 kilometres wide. The total area is approximately118,484 square kilometres, of which 94,276 square kilometres are land. The remaining area consistsmostly of Lake Malawi, which is about 475 kilometres long and delineates parts of Malawi’s easternboundary with Mozambique and Tanzania.Malawi’s most striking topographic feature is the Rift Valley, which runs the entire length of thecountry, passing through Lake Malawi in the Northern and Central Regions to the Shire Valley in thesouth. The Shire River drains the water from Lake Malawi into the Zambezi River in Mozambique. To thewest and south of Lake Malawi lay fertile plains and mountain ranges whose peaks range from 1,700 to3,000 metres above sea level.The country is divided into three regions: Northern, Central, and Southern regions. There are 28districts in the country: 6 districts in the Northern Region, 9 in the Central Region, and 13 in the SouthernRegion. Administratively, the districts are subdivided into traditional authorities (TAs), presided over bychiefs. Each TA is composed of villages, which are the smallest administrative units. The villages arepresided over by village headmen.Malawi has a tropical continental climate with maritime influences. Rainfall and temperature varydepending on altitude and proximity to the lake. From May to August, the weather is cool and dry. InSeptember and October, the weather becomes hot. The rainy season begins in October or November andcontinues until April.Based on the 2008 population census results, the population of Malawi in 2014 was estimated tobe 15.8 million, with an intercensal population growth rate of 2.8 percent per year (Table 1.1). Populationdensity increased from 105 persons per square kilometre in 1998 to 139 persons per square kilometre in2008 (NSO, 2008).1.1.2EconomyThe economy of Malawi is based primarily on agriculture, which accounts for 30 percent of thegross domestic product (GDP). The country’s major exports are tobacco, tea, and sugar. They account forapproximately 85 percent of Malawi’s domestic exports. GDP growth was estimated to be 5 percent in2013 and is projected to increase—driven by tobacco exports and continued growth in the key sectors ofagriculture, manufacturing, and services—to 6.1 percent in 2014 and 6.2 percent in 2015 (AfDB, 2014).1.1.3Health IndicatorsLife expectancy at birth in Malawi is estimated at 51.3 years for women and 48.3 years for men.(NSO, 2008). Data from the 2004 MDHS and 2010 MDHS show that the under-5 mortality rate hasdecreased from 133 deaths per 1,000 live births in 2000-2004 to 112 deaths per 1,000 live births in 20052010 (NSO and ORC Macro, 2005; NSO and ICF Macro, 2011). The Malawi MDG Endline SurveyIntroduction 1
(MES) carried out in 2013-14 by the National Statistical Office found the under-5 mortality rate to be 85deaths per 1,000 live births (NSO, 2014). The maternal mortality ratio has also declined from 984 deathsper 100,000 live births in 1998-2004 (NSO and ORC Macro, 2005) to 675 deaths per 100,000 live births in2004-2010 (NSO and ICF Macro, 2011) and to 574 deaths per 100,000 live birt
We noted a decline in malaria prevalence from the 2010 value of 43 percent to the 2014 value of 33 percent. Net ownership has increased from 58 percent in 2010 to 70 percent in 2014. Results of the 2014 MIS also show an improvement on use of IPTp among pregnant women. Coverage has increased from 54 percent in 2012 to 63 percent in 2014.

![Malawi 2015-16 Demographic and Health Survey - Key Findings [SR237]](/img/37/sr237.jpg)