Transcription
Risk governance & control: financial markets & institutions / Volume 5, Issue 4, 2015, Continued - 1ON THE RELATIONSHIP BETWEEN INVESTOR SENTIMENT,VIX AND TRADING VOLUMESimon M. S. So*, Violet U. T. Lei*AbstractAs noise traders affect stock market by trading, sentiment, as a signal of noise, may have relationshipswith trading volume. This paper explores the effect of sentiment on the stock market’s trading volume.Increase in Volatility Index (VIX) can explain the percentage increase in trading volume, but only inhigh VIX period. Besides, higher level of VIX is likely to be associated with greater variability oftrading volume. The noise traders add liquidity to the market and provide more chances for investorsto time their trade as the volatility of liquidity increases. These two kinds of impact lower rationalinvestors’ required return. The noise traders not only drive the price deviating from fundamentalvalue, but also influence the liquidity dimensions.JEL Classification: G12; G14Keywords: Sentiment; Trading Volume; Volatility*Faculty of Business Administration, University of Macau1. IntroductionIn the area of modern finance, perfect market andrationality are usually assumed. Underlying logic isthen carried out to give insight into how the marketworks. However, the facts in reality may not beconsistent with the assumptions. One majorassumption which is always challenged by behavioralfinance researchers is rationality of investors.Investors are found to be irrational and subject tovarious biases (e.g. Kahneman and Tversky, 1979).Traditionally, mispricing from irrational investors isconsidered to be heterogeneous and can be offset.Even though there is mispricing, it disappears quicklydue to arbitrage. However, Kumar and Lee (2006)show that some irrational investors’ trades aresystematically correlated. Besides, investors couldmotivate trade among each others, which is known as“herd effect”. Gleason, Mathur and Peterson (2004)use intraday data and find that herd effect exists in theU.S. stock market. Furthermore, arbitrage can becostly and risky. Irrational investors, or noise traders,play an important role in financial market. De Long,Shleifer, Summers and Waldmann (1990) show thatthe unpredictability of noise traders’ belief can createsystematic risk and place limit to arbitrage. Themagnitude of price deviation from fundamental valueis affected by the proportion of noise traders and thelevel of mispricing. As the noise traders could havepositive return from the trend they “created”, they maybecome stronger and lengthen the mispricing period.Arbitrageurs may not be willing to compete with noise114traders due to finite horizon because they could losetheir wealth before the price goes back to thefundamental value. Shleifer and Summers (1990) havea detail discussion about the possibility and influenceof noise traders. Introducing investor sentiment mayhelp to explain various financial market anomalies.There are a number of papers to investigate theimpact of noise traders or investor sentiment on thestock market. Brown and Cliff (2005) find thatsentiment can predict overall market return and theperformance of both large and small firms. Neal andWheatley (1998) compare few sentiment proxiesaccording to their predictive power on returndifference between large and small firms. Close-endfunds discount and net mutual fund redemptions havesuch predictive power. Baker and Wurgler (2006)investigate the effect of sentiment on cross-sectionalstock returns. They find that small stocks, youngstocks and stocks with high volatility are more subjectto sentiment than others. During high sentimentperiod, these stocks are overpriced and thus generaterelatively low subsequent return. Glushkov (2006)develops a sentiment beta for individual stocks. It isdefined as the change in stock return with respect tothe change in sentiment. Consistent with Baker andWurgler (2006), he finds that stocks with highersentiment beta are likely to be young, small andcomprised of more unique risks than those stocks withlow sentiment beta. Cornelli, Goldreich andLjungqvist (2006) and Dorn (2009) investigate theeffect of sentiment on IPO performance. They usegrey market price to capture investor sentiment. High
Risk governance & control: financial markets & institutions / Volume 5, Issue 4, 2015, Continued - 1grey market price indicates optimism. Stocks that areaggressively bought, or with high price in grey markethave high first day return but poor long runperformance. Yu and Yuan (2011) find that investors’sentiment affects the risk-return tradeoff. Meanvariance tradeoff is lower during high-sentimentperiod and becomes higher during low-sentimentperiod. Lee, Jiang and Indro (2002) find that volatilityincreases when investors become more bearish andvice versa.The impact of noise traders leaks out in differentway. Black (1986) has a detailed discuss about thenoise: “Noise makes financial markets possible, butalso makes them imperfect. If there is no noisetrading, there will be very little trading in individualassets.” As noise traders should affect the market bytrading, the trading volume is expected to haverelationship with the noise. According to thetraditional CAPM, systematic risk is the only factor indetermining price. As market cannot be perfect, somefashionable variables are found to have explanatorypower on return. One of such variables is liquidity(e.g. Pástor and Stambaugh, 2003). Generally, stockswith higher level of liquidity should have lower return.Besides, the second moment of liquidity can alsoaffect return. Chordia, Subrahmanyam and Anshuman(2001) find that there is negative relationship betweenreturn and variability of liquidity which is measuredby dollar trading volume and share turnover. Thissurprising finding is explained by Pereira and Zhang(2008). Since higher variation of liquidity provideschance for investors to time their trade, requiredreturns are relatively lower.Odean (1999) demonstrates that investors withdiscount brokerage account are overconfident andhave excessive trading volume. Brown (1999) showsthat small investors would like to trade by using closeend fund data when sentiment is extreme.Furthermore, Baker and Stein (2004) argue thatliquidity could serve as a sentiment indicator. Noisetraders are likely to be retail investors who are subjectto short-sales constraint. If noise traders are bullishabout the market, they can simply buy shares andthese trades thus facilitate liquidity. However, if noisetraders are bearish about the market, short-salesconstraint keeps them out of the market. Kurov (2008)finds that trend chasing strategy adopted by noisetraders is more active during high sentiment periodand this increases market liquidity.As mentioned before, noise traders affect stockmarket by trading. Their trading activities, whichaffect liquidity, can also affect price. Therefore, it isworth to know the effect of noise traders on both leveland variability of trading volume. This paper attemptsto investigate this issue and aims to provide a betterunderstanding about the relationship betweensentiment and trading volume. Sentiment proxy isdeveloped to capture the noise or irrationality ofinvestors. It can serve as a noise signal which may115have some relationships with trading activity. Thebetter understanding on such relationships may help toassess the impact of noise traders. The realized priceimpact imposed by noise traders may be composed ofvarious parts - price deviation from fundamentalvalue, additional risk they introduce and additionalliquidity and variability they provide. The first twoparts may increase rational investors’ required returnwhereas the last one could have a contrary impact.Furthermore, this paper uses daily volatility index toproxy sentiment. Sentiment proxies used in previousstudies are usually monthly or yearly measures whichmay take time to be collected. In contrary, dailyvolatility index can be obtained publicly. It enablespractitioners to assess the impact of noise traders moreeffortlessly and frequently. The following sections aredata and methodology and then empirical results.Conclusion follows.2. Data and methodologyVolatility Index (VIX) is used as the proxy to captureinvestor sentiment. VIX is firstly introduced byWhaley (1993) and the Chicago Board OptionsExchange (CBOE) publishes VIX starting from 1993.The calculation method of VIX was changed in 2003.The original VIX represents the 30-day impliedvolatility of eight S&P 100 index options. In order tobe closer to actual industry practices, since September2003, VIX has been based on S&P 500 rather thanS&P 100 index options because S&P 500 is the mostwidely used benchmark for the equity market in U.S.VIX used in this paper is downloaded from the CBOEwebsite.1 It measures the market’s expectation of 30day implied volatility and is often referred to as“investor fear gauge”. The higher the VIX, the greaterthe fear is. Since noise traders are usuallyoverconfident and over optimistic, they can be moreaggressive than rational investors. Besides, noisetraders are easily affected by various rumors orpseudo-signals. They may increase the volatility andthe market expectation on future volatility, thus affectthe performance of VIX. Therefore, VIX serves as themeasure of noise signal in this paper.Unlike asset pricing, there is no benchmarkmodel for trading volume. Many factors are found tohave influence on trading volume. Chordia, Roll andSubrahmanyam (2001) examine the determinants ofdaily change in trading activity. The determinantsinclude market return related variables, short terminterest rate, quality spread, term spread, weekdaydummies, holiday dummy and GDP, unemploymentrate and CPI announcement date dummies. Thesevariables are included in our regression analysis to seeif VIX has any additional explanatory power ontrading volume. Trading volume of New York StockExchange (NYSE) is obtained from Datastream.1http://www.cboe.com
Risk governance & control: financial markets & institutions / Volume 5, Issue 4, 2015, Continued - 1Datastream’s market return index is used to proxy themarket return which defined as the percentage changeof the return index. Interest rate related variables aredownloaded from Federal Reserve website. 2 Theannouncement date of GDP and the announcementdate of CPI and unemployment rate are obtained fromBureau of Economic Analysis and Bureau of LaborStatistics respectively.3 All variables are on dailybasis. To be included in the sample, data should beavailable for all variables in a specific trading daywith positive trading volume.The dependent variable of the first time seriesregression test is the daily percentage change oftrading volume (%ΔVO) and the explanatoryvariables are:ΔVIX : daily change in VIXMKT : market return at time t and equals to 0 ifreturn is negativeMKT– : market return at time t and equals to 0 ifreturn is positiveMA5MKT : average return during t-1 to t-5and equal to 0 if negativeMA5MKT– : average return during t-1 to t-5and equal to 0 if positiveMA5 MKT : average absolute return during t-1to t-5ShortRate : difference between Federal FundRate at t and t-1TermSpread : daily change in the differencebetween the yield on 10-year Treasury bond andFederal Fund RateQualitySpread :daily changein thedifference between the yield on Moody’s Baacorporate bond and yield on 10-year Treasury bondHoliday : 1 if a specific trading satisfies (1) ifIndependence Day, Christmas, or New Year’s Dayfalls on a Friday, then the previous Thursday, (2) ifany holiday falls on a weekend or on a Monday, thenthe following Tuesday, (3) if any holiday falls onanother weekday, then the preceding and followingdays, and 0 otherwise.MON, TUE, WED, THU : 1 if trading day is aMonday, Tuesday, Wednesday or Thursdayrespectively, and 0 otherwise.GDP(1-2), UNP(1-2), CPI(1-2) : 1 on the twotrading days prior to a GDP, unemployment or CPIannouncement respectively, and 0 otherwise.GDP(0), UNP(0), CPI(0) : 1 on the day of aGDP,unemployment,CPIannouncementrespectively, and 0 otherwise.Except those dummy variables, all other sixvariables have been examined for stationarity beforerunning time series regression.4 Stationarity matterssince regression using non-stationary time series couldresult spurious relationship and misleading result. Inthis paper, both parametric test, augmented DickeyFuller (ADF) test, and non-parametric test, PhillipsPerron (PP) test, are employed to test the nullhypothesis of unit root. In Table 1, the p-values are allless than 0.01 and thus all the six variables arestationary at the 1% significance level. The percentagechange of trading volume, daily change in VIX,average absolute return, spreads in short term as wellas long term interest rate and daily difference of yieldbetween corporate bond and Treasury bond do notdeviate from the mean persistently.In addition to the level of trading volume, thispaper also examines the effect of sentiment on itssecond moment - the variability of trading volume. Inliterature, there is lack of study to investigate thedeterminants of the variability in trading volume. Inour second test, the explanatory variables are modifiedbased on the assumption that variables that can affectthe level of trading volume can also affect thevariability of trading volume. Thus, the dependentvariable of the second test is the coefficient ofvariation (CV(VO)) which is calculated from tradingvolumes during t to t-4.5 The explanatory variablesare:AVG(VIX) : average VIX during t to t-4AVG(MKT ) : average market return during t tot-4 and equal to 0 if negativeAVG(MKT–) : average market return during t tot-4 and equal to 0 if positiveAVG(ShortRate) : average ShortRate during t tot-4AVG(TermSpread) : average TermSpreadduring t to t-4AVG(QualitySpread) : average QualitySpreadduring t to t-4Holiday’ : 1 if there is holiday during t to t-4 and0 otherwiseGDP, UNP, CPI : 1 if there is GDP,unemployment or CPI announcement during t to t-4,respectivelySimilar to the first regression test, except thosedummy variables, all other five variables have beenexamined for stationarity by using both ADF test andPP test. The statistical results are given in Table 2.The null hypothesis of unit root has been rejected atthe 1% significance level for all the variables and thusthey are ata/releases/statisticsdata.htm3http://www.bea.gov and http://www.bls.gov respectively4Stationarity implies that the time series have constant meanand variance over time and they will exhibit mean reversionand never “go too far away”.1165Coefficient of variation (CV) is the ratio of the standarddeviation to the mean or says the ratio of the risk assumed tothe expected return.
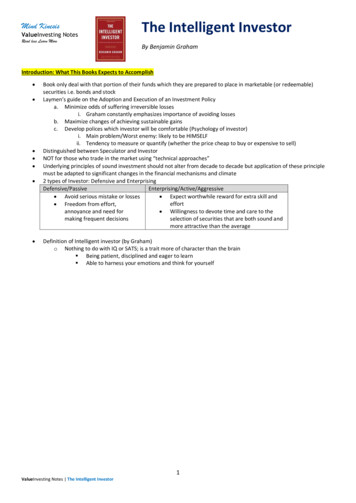
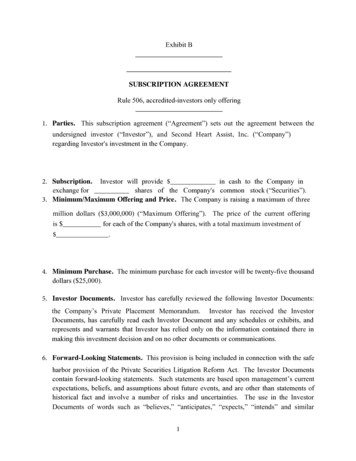
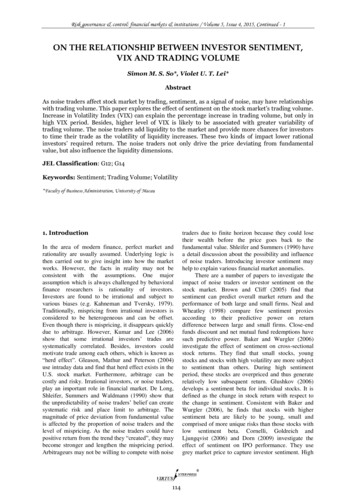
Risk governance & control: financial markets & institutions / Volume 5, Issue 4, 2015, Continued - 1Table 1. Unit Root Tests for Percentage Change of Trading Volume and Other Explanatory Variables%ΔVO. is the dependent variable of daily percentage change of trading volume. The non-dummy explanatory variables are:ΔVIX : daily change in VIX; MA5 MKT : average absolute return during t-1 to t-5; ShortRate : difference between FederalFund Rate at t and t-1; TermSpread : daily change in the difference between the yield on 10-year Treasury bond and FederalFund Rate; and QualitySpread : daily change in the difference between the yield on Moody’s Baa corporate bond and yield on10-year Treasury bond.H0 : ρ 1 (unit root) vs. Ha : ρ 1 (stationary)Augmented Dickey-Fuller (ADF)Phillips Perron (PP)Variablest-statisticp-valueadj. 50.0001ΔVIX–27.095720.0000–73.994510.0001MA5 MKT 0–61.801390.0001Table 2. Unit Root Tests for Coefficient of Variation of Trading Volume and Other Explanatory VariablesCV(VO) is the dependent variable of the coefficient of variation calculating from trading volumes during t to t-4. Theexplanatory variables are: AVG(VIX) : average VIX during t to t-4; AVG(ShortRate) : average ShortRate during t to t-4;AVG(TermSpread) : average TermSpread during t to t-4; and AVG(QualitySpread) : average QualitySpread during t to t4.H0 : ρ 1 (unit root) vs. Ha : ρ 1 (stationary)Augmented Dickey-Fuller (ADF)Phillips Perron (PP)Variablest-statisticp-valueadj. igure 1 is the time series plot of VIX. VIX isconsistently low throughout the period from 1997 to2007, which includes the Asian crisis, the dot-combubble and the SARS event. However, VIX aroundthe 2008 financial crisis is extremely high. The resultmay be due to the development of online trading in thepast few years. Most noise traders are likely to besmall traders and retail traders. The popularity ofonline trading helps them to trade easily andfrequently. Thus they are easier to assess the stockmarket and have greater influence (add highervolatility) on the market comparing to the past years.In order to test whether there exists asymmetriceffect of sentiment on the trading volume, two subsamples, namely low and high sentiment period aredrawn from the whole sample period from January1997 to December 2010. January 2005 to December2005 is defined as low VIX period whereas July 2008to June 2009 is defined as high VIX period.3. Empirical resultsFigure 2 is the time series plot of change in VIX andpercentage change in trading volume. Both series117exhibit some extreme large changes during the sampleperiod. Change in VIX is relatively small during lowsentiment period and large during high sentimentperiod. On the other hand, the swing of percentagechange in trading volume does not vary much acrosstime. The change in VIX has almost zero average,meaning that changes in VIX from time to time offseteach other. The investor sentiment cannot persistentlyincrease in the market. It may appear in the markettemporarily. The realized VIX may be the sum ofgeneral level of VIX which is caused by marketfundamental issues and the additional VIX imposed bynoise traders. It is hard to observe any relationshipbetween the two variables by simply observing thegraph. The coefficient of correlation in Table 3 mayhighlight some ideas. The three coefficients ofcorrelation are all positive. There is positiverelationship between VIX and trading volume.Besides, the coefficient of correlation using high VIXperiod data ( 0.2019) is higher than the other two.The positive relationship between VIX and tradingvolume is stronger during high VIX period.
Risk governance & control: financial markets & institutions / Volume 5, Issue 4, 2015, Continued - 1Figure 1. Time Series Plot of Volatility Index (VIX), 1997 – 2010Figure 2. Time Series Plot of Change in VIX and Percentage Change of Trading Volume, 1997 - 2010Table 3. Summary Statistics of %ΔVO and ΔVIXSummary statistics of the percentage change in trading volume and the change in VIX. Coefficient of correlationbetween them during the whole sample period, high VIX period and low VIX period.%ΔVOΔVIXMean0.01850.0001Whole Period(1997/01 - .7604Standard fficient of Correlation (ΔVIX & %ΔVO)High VIX PeriodLow VIX Period(2008/07 - 2009/06)(2005/01 - 2005/12)0.20190.1263Table 4 shows the first regression results forpercentage change in trading volume as the dependentvariable. In panel A, the coefficients of MKT , MKT–, MA5MKT , MA5MKT– and MA5 MKT are inexpected sign. MA5 MKT is used to investigate theimpact of market volatility on the trading activity.118Indeed, it is significant in all the three panels.Volatility is the factor that can significantly affecttrading volume regardless the presence of controlledvariables. In panel B, MKT is positively significantwhereas the MKT– is not significant. Thus it indicatesthat during high VIX period, the trading volume reacts
Risk governance & control: financial markets & institutions / Volume 5, Issue 4, 2015, Continued - 1fast only to the most recent positive marketmovement. However, the reaction to the negativemarket movement is relatively slow and reluctant,which is reflected by the significance of MA5MKT–.When there is a downward trend in the market return,the trading volume starts to decrease. Since noisetraders are generally optimistic, they may react fast tothe positive market movement and buy sharesaggressively. On the other hand, they are reluctantwhen the market has negative return. They may sellstocks and realize the loss after the market exhibits anobvious decreasing trend. In panel C, both MKT andMKT– are significant while both MA5MKT andMA5MKT– are not significant. As the noise traderbecomes the minority during low VIX period, thetrading volume reacts fast to the recent marketmovement.Comparing panels A and B, the weekdaydummies, which are used to capture the systematicseasonal pattern in trading activity (see Chordia, Rolland Subrahmanyam, 2001), become not significantduring high VIX period. As the noise traders play asignificant role in the high VIX period, VIX is able tocapture the trading pattern measured by the week daydummies. Besides, the macroeconomic announcementdate dummies also become not significant in panel B.One potential explanation is that the effect of themacroeconomic announcement is grabbed by VIX.After adding those explanatory variables thatused in Chordia, Roll and Subrahmanyam (2001), VIXis still significant in panels A and B. If VIX increases,the percentage change in trading volume alsoincreases. The result implies that more trades areassociated with higher VIX. In the two sub-samples,the effect of VIX only exists during high sentimentperiod. As VIX can be viewed as the signal of noise,the result may imply that noise traders increase tradingvolume. When VIX is low, the noise traders are out ofthe market, or their role is not significant, VIX hasless power in explaining the changing pattern oftrading volume.Table 5 shows the second regression results forcoefficient of variation of trading volume as thedependent variable. The level of market return appearsto be a determinant of the variability of tradingvolume. Better market performance is associated withlarger variation in trading volume. The coefficient ofAVG(VIX) is positive and significant as well. If thelevel of VIX over the successive trading days ishigher, the variability of trading volume over thesuccessive trading days also tends to be larger. Noisetraders are usually uninformed. Their trade is based onnoise or sentimental belief and is likely to be affectedby various news or rumors. During high VIX period,the noise traders share a significant portion ofinvestors. The induced trades are noise trading. Thevolatility of trading activity is likely to be induced bythose noise trading. Their variable trading behaviormay also affect the volatility in stock returns. Lee etal. (2002) find that stock market return volatilityincreases when investors become more bearish.Table 4. Time Series Regression for Percentage Change in Trading VolumeExplanatoryVariablesΔVIXMKT MKT–MA5MKT MA5MKT–MA5 MKT ptF-statisticR-squaredAdj. R-squaredPanel AWhole Period(a)(1997/01 - 2010/12)3443 13***0.0000– 1.9560*0.05161.47630.3999– 0.82180.4282– 4.9120***0.0000– 0.0419**0.01240.1056***0.00000.0376***0.0004– 0.00210.8473– 0.1214***0.00000.00310.9721– 00540.5636– 0.0371***0.0060– 0.00860.24230.0603***0.0000– 0.00090.940126.0096***0.00000.13200.1269Dependent Variable : %ΔVOPanel BHigh VIX Period(b)(2008/07 - 2009/06)250 01***0.0012– 0.05250.97998.83930.1460– 6.5810***0.0015– 5.6677***0.0001– 0.11410.1681– 0.04650.4614– 0.07070.2902– 0.05360.3425– 0.12870.1433– 0.6226***0.0016– 7– 0.03340.3543– 0.10840.1055– 00.22720.1597Panel CLow VIX Period(c)(2005/01 - 2005/12)250 ObservationsCoefficientsp-value– .1040***0.00930.02940.4065– 0.01040.7814– 0.06640.37720.23050.4662– 0.09260.67630.49230.37540.09050.2736– 0.04710.19650.01620.4750– 0.0680*0.0877– 0.03630.24860.00740.8444– 0.01970.66753.1180***0.00000.21400.1454The dependent variable is the daily percentage change of trading volume, %ΔVO. The explanatory variables are: ΔVIX :daily change in VIX; MKT : market return at time t and equals to 0 if return is negative; MKT– : market return at time tand equals to 0 if return is positive; MA5MKT : average return during t-1 to t-5 and equal to 0 if negative; MA5MKT– :average return during t-1 to t-5 and equal to 0 if positive; MA5 MKT : average absolute return during t-1 to t-5; ShortRate :119
Risk governance & control: financial markets & institutions / Volume 5, Issue 4, 2015, Continued - 1difference between Federal Fund Rate at t and t-1; TermSpread : daily change in the difference between the yield on 10-yearTreasury bond and Federal Fund Rate; QualitySpread : daily change in the difference between the yield on Moody’s Baacorporate bond and yield on 10-year Treasury bond; Holiday : 1 if a specific trading satisfies (1) if Independence Day,Christmas, or New Year’s Day falls on a Friday, then the previous Thursday, (2) if any holiday falls on a weekend or on aMonday, then the following Tuesday, (3) if any holiday falls on another weekday, then the preceding and following days, and0 otherwise; MON, TUE, WED, THU : 1 if trading day is a Monday, Tuesday, Wednesday or Thursday respectively, and 0otherwise; GDP(1-2), UNP(1-2), CPI(1-2) : 1 on the two trading days prior to a GDP, unemployment or CPI announcementrespectively, and 0 otherwise; GDP(0), UNP(0), CPI(0) : 1 on the day of a GDP, unemployment , CPI announcementrespectively, and 0 otherwise.***, ** & * denote coefficients significantly different from zero at 1%, 5% & 10%, respectively.(a), (b) & (c) use 8-lag, 4-lag & 4-lag Newey-West standard errors, respectively.Table 5. Time Series Regression for Coefficient of Variation of Trading VolumeExplanatory variablesVG(VIX)AVG(MKT quaredAdj. R-squaredDependent variables : CV(VO)(d)Coefficient0.0010***1.2671**– 1.0086*0.0556***– 0.2264**0.12860.14690.0111**– 0.0166***– 00000.11380.1112The dependent variable is the coefficient of variation calculated using trading volume during t to t-4, CV(VO). Theexplanatory variables are : AVG(VIX) : average VIX during t to t-4; AVG(MKT ) : average market return during t to t-4and equal to 0 if negative; AVG(MKT–) : average market return during t to t-4 and equal to 0 if positive; AVG(ShortRate) :average ShortRate during t to t-4; AVG(TermSpread) : average TermSpread during t to t-4; AVG(QualitySpread) :average QualitySpread during t to t-4; Holiday’ : 1 if there is holiday during t to t-4 and 0 otherwise; GDP, UNP, CPI : 1 ifthere is GDP, unemployment or CPI announcement during t to t-4, respectively.***, ** & * denote coefficients significantly different from zero at 1%, 5% & 10%, respectively.(d) uses 8-lag Newey-West standard errors.4. ConclusionLevel and variability of liquidity are found tosignificantly affect market return. Trading volume, asa proxy of liquidity, may be worth to be investigated.Noise traders could impose risks on price by derivingit from the fundamental value. Besides, as noisetraders should affect price by trading, their tradingbehavior, captured by level and variability of tradingvolume, may also have effect on return. The change inVIX significantly explains the percentage change intrading volume, but such effect only exists in highsentiment period. Their correlation coefficient ispositive, meaning that when VIX increases, tradingvolume also increases. The volatility of tradingvolume is also found to be positively related to thelevel of VIX. When the level of VIX duringsuccessive trading days is higher, the variability oftrading volume during the same period is also higher.On one hand, noise traders drive price deviationfrom fundamental value. Arbitrageurs or rationalinvestors may require higher return for compensatingthe mispricing risk. On the other hand, noise tradersalso add liquidity and induce the variability ofliquidity. Previous researches show that the increase in120the level and/or variability in liquidity lower therequired return. Therefore, the realized price impact ofnoise trader may be a combination of different kindsof impact. This consideration may help in explainingdifferent findings among researches and provide analternative approach to assess the impact of noisetraders.References1.2.3.4.5.6.Baker, Malcolm and Stein, Jeremy C. (2004), “Marketliquidity as a sentiment indicator”, Journal ofFinancial Markets V.7(3), pp.271-299.Baker, Malcolm and Wurgler, Jeffrey (2006),“Investor sentiment and the cross-section of stockreturn”, Journal of Finance V.61(4), pp.1645-1680.Black, Fischer (1986), “Noise”, Journal of FinanceV.41(3), pp.529-543.Brown, Gregory W. (1999), “Volatility, sentiment, andnoise Traders”, Financial Analysts Journal V.55(2),pp.82-90.Brown, Gregory W. and Cliff, Michael T. (2005),“Investor sentiment and asset valuation”, Journal ofBusiness V.78(2), pp.405-440.Chordia, Tarun, Roll, Richard and Subrahmanyam,Avanidhar (2001), “Market liquidity and tradingactivity”, Jo
As noise traders affect stock market by trading, sentiment, as a signal of noise, may have relationships with trading volume. This paper explores the effect of sentiment on the stock market's trading volume. Increase in Volatility Index (VIX) can explain the percentage increase in trading volume, but only in high VIX period.