Transcription
International Journal of Managing Value and Supply Chains (IJMVSC) Vol. 11, No. 2, June 2020COMPLEMENTARY ASSETS AND VALUECREATION BEYOND INFORMATIONTECHNOLOGY INVESTMENTSGodfred Yaw Koi-AkrofiDepartment of IT Studies, University of Professional Studies, AccraABSTRACTThis work was aimed at analyzing the relationships between some selected complementary assets(independent variables) and some specified benefits/value creation (dependent variables), beyondInformation Technology (IT) investments in an organizational setting. The purpose was to determinesignificant complementary assets that impact greatly on value creation beyond IT investments.With 175questionnaires sent to IT project and program managers of companies in the Telecom industry in Ghana,and analyzed,thefollowing findings were revealed: for value creation beyond IT investments to beachieved, the staff must be computer literate, there must be the availability of experts and firms around tohelp in resolving IT problems quickly and timely that crop up, and the staff must be empowered to beinnovative with IT. Again, the results showed that most of the complementary assets employed in thiswork, tend to favor benefits of Improved staff morale and Improved business processes. Also, one of thestrongest positive relationships was found to exist between “supportive organizational culture thatvalues efficiency and effectiveness” as predictor variable and “service/product quality” as responsevariable.KEYWORDSComplementary assets, information technology, value creation, investments, intangible and tangibleassets1. INTRODUCTIONThe relationship between information technology (IT) investment and value creation inorganizations has been an important topic in MIS research for years. LinA, Bou-Wen [1] notedthat information technology (IT) has become an unavoidable, essential component of firmcapacity and something from which to gain a sustainable competitive advantage. LinA[1]continued to determine that the empirical results of the relationship between IT capability andfirm performance are still equivocal, regardless of the above statement. This confusion is due toresearch results that are inconsistent or conflicting, and this has contributed to the ambiguity injustifying IT spending by IT managers.Studies on the relationships between IT investment and organizational performance andproductivity (or value creation) revealed, in some cases, positive and notable effects of suchinvestment (Barua, Kriebel, & Mulhopadhyay [2]; Brynjolfsson & Hitt [3]; Kaplan, Krishnanm,Padman, & Peters [4]; Lehr & Lichtenberg [5]; Mahmood & Mann [6]; Rai, Patnayakuni, &Patnayakuni [7]), while in other cases, studies have revealed no noteworthy relationship(Berndt & Morrison [8]; Koski [9]; Strassman [10]; Strassman [11]). Some reasons have beengiven for these contradictory results; some researchers attribute it to inadequate data and flawedmethodology (Brynjolfsson [12]; Sircar, Turnbow, &Bordoloi [13]). YiHua and Mykytyn [14]DOI:10.5121/ijmvsc.2020.1120217
International Journal of Managing Value and Supply Chains (IJMVSC) Vol. 11, No. 2, June 2020also giving their view on the same subject mentioned that handling IT investment as a blackbox without looking further at what is going on inside the box could be an even bigger cause.It is based on this that researchers like Koi-Akrofi and Koi-Akrofi [15] tried to expand thediscussion to cover the pre-IT investment activities, the IT investment itself, the conversioneffectiveness, and the gap between the investments and the yields of the investments. It wasrevealed that all these factors mentioned contribute immensely to value creation. Conversioneffectiveness has the following components: top management commitment, previous firmexperience with IT, user satisfaction with IT systems and tools, Power and politics of the firm,and culture of the firm regarding IT [15]. These factors, they maintained that when emphasizedpositively can result in IT investments producing fantastic gains. Several of the aforementioneditems constitute what we call complementary assets.Teece [16] defined complementary assets as those assets required to derive value from aprimary investment (as cited in Laudon and Laudon [17]). It is worth noting that some work hasalready been done in the area of complementary assets aiding IT investments to createsignificant values, however, quite old; Researchers (Brynjolfsson [18]; Brynjolfsson & Hitt[19]; Davern & Kauffman [20]; Laudon [21]) revealed that firms that support their technologyinvestments with investments in complementary assets, such as new business models, newbusiness processes, management behavior, organizational culture, or training, receive greaterreturns, whereas those firms failing to make these complementary investments receive less orno returns on their information technology investments. This work takes a different approachby answering the question “what benefit/value is created from which complementary asset?”The general objective of the study, therefore, was to contribute to the general body ofknowledge and research work in complementary assets and value creation beyond informationtechnology investments. To achieve this objective, the research was targeted at analyzing therelationships between specific complementary assets and selected benefits (Increased Revenue,enhanced competitive advantage, improved staff morale, improved decision making, improvedbusiness processes, and improved product/service quality) of IT investments.1.1. The Research ProblemIndisputably, IT has and continues to play a major role in the operations of businesses all overthe world to achieve expected outputs/results or goals. This undisputed fact, though difficult toascertain theoretically, is what has been pushing managers of businesses to continue to invest inIT. Ahmad and Arshad [22] revealed that huge IT investments are made in organizationsworldwide due to the notion or belief that these investments produce productivity andvalues/benefits which may be intangible. Theoretically, researchers have tried over the years toquantify or determine the benefits of IT investments in terms of productivity and profitability.In achieving this, many frameworks, models, and approaches have been employed byresearchers over the years.The main approaches are to determine performance from a direct investment in IT orperformance from IT investments through mediating factors (organizational capabilities)(Liang, T-P., You, J-J., & Liu, C-C. [23]; Dehning, B., & Richardson, V. J. [24]). In the formerapproach, results have not been straightforward, evidenced by the productivity paradox(opposing views or positions of researchers on productivity when it comes to value creationafter IT investments), and opposing profitability outcomes. To ensure benefits realization(tangible and intangible) beyond IT investments, some researchers [18-21] have suggestedinvestments in complementary assets, for which they argue that value creation is only achievedwhen commensurable investments are made in complementary assets alongside the InformationTechnology investments. This is in line with the later approach of performance from ITinvestments through mediating factors (organizational capabilities) which has been proven toyield results [23, 24].18
International Journal of Managing Value and Supply Chains (IJMVSC) Vol. 11, No. 2, June 2020This study intends to analyze the relationships between complementary assets as was proposedby Laudon and Laudon [17], as independent variables and some specified benefits (tangible andintangible) as was proposed by Ahmad and Arshad [22], as dependent variables, to establishsignificant variables within a framework for value creation beyond IT investments.2. LITERATURE REVIEW2.1. Complementary AssetsIT investments alone cannot make organizations and managers achieve fantastic results in termsof profitability and productivity unless they are accompanied by supportive values, structures,and behavior patterns in the organization and other complementary assets [17]. Laudon andLaudon [17] continued to say that before business firms can reap the advantages of newinformation technologies, they need to change how they do business; some firms fail/refuse toadopt the right business model that suits the new technology or seek to maintain an old businessmodel that is driven by new technology.Complementary assets are those assets required to derive value from a primary investment [25].In this instance, IT investment is a primary investment. Research on business informationtechnology investment shows that firms that support their technology investments withinvestments in complementary assets, such as new business models, new business processes,management behavior, organizational culture, or training, obtain receive splendid/superbreturns, while those firms failing to make these complementary investments receive less or noreturns on their information technology investments [18, 20, 21, 26]In explaining the significance of this concept, this question can be asked: what is the essence orbenefit of investing so much in computers in an organization, without training the staff how touse a computer? The net effect will be that the intended benefit that motivated the investment inthe first place will never be achieved. This is because the staff will not use it. The investmentwill become a “white elephant”. This is the concept behind complementary assets. They arecomplementary because we see them as helping the IT investments to achieve what they areintended to achieve.According to Laudon and Laudon [17], Complementary assets are grouped into three aspects: Organizational investments: This has to do with the following:o Supportive organizational culture that values efficiency and effectivenesso Appropriate business modelo Efficient business processeso Decentralized authorityo Distributed decision-making rightso Strong IS development team oooooManagerial Investments: This has to do with the following:Strong senior management support for technology investment and changeIncentives for management innovationTeamwork and collaborative work environmentsTraining programs to enhance management decision skillsManagement culture that values flexibility and knowledge-based decision making.ooSocial Investments: This has to do with the following:The Internet and telecommunications infrastructureIT-enriched educational programs raising labor force computer literacy 19
International Journal of Managing Value and Supply Chains (IJMVSC) Vol. 11, No. 2, June 2020oooStandards (both government and private sector)Laws and regulations creating fair, stable market environmentsTechnology and service firms in adjacent markets to assist implementationInvesting in the above alongside IT will yield good returns as against investing in IT alone.This is the whole concept of complementary assets and IT investments in creatingorganizational value. This whole concept of complementary assets investments alongside ITinvestments came because of the productivity paradox which has been a standing issue inliterature. The current research drive is towards maximizing value creation from IT investmentsusing complementary assets.Examples of the application of this concept in organizations are as follows: Investing heavily in IT infrastructure and training the users as well. The two activitiesshould be done at the same time so that the systems will not wait for the people to beready. Immediately the systems are ready, the users should also be ready to use themfor value realization.Investing heavily in local area networks and enterprise systems and not giving internetaccess to staff. For the systems to be used effectively, the staff need internet access.Investing heavily in IT without business processes in place. This will mean that thoughwhat is needed to ensure that the processes work is in place, the processes themselvesare not in place. This allows or permits the wrong use of the IT systems.Investing heavily in IT without IT policy in place. Staff will use the systems anyhow,posing security concerns, and so on, and that will not bring productivity to the businessOrganizations make a big mistake in investing so much in IT and forget all other things that areclosely related to the investment. Universities spend so much money to buy and install MISsystems for the registry, students, and faculty for academic work, but they find it difficult toinvest money in the training of administrative and faculty staff to enable them to use the systemefficiently. At the end of the day, they do not use it, and in most cases return to the manual wayof doing things. This problem persists in almost all institutions. Complementary assetsinvestment is key to realizing the full benefits of IT investments.3. MATERIALS AND METHODS3.1. IntroductionThis portion documents the research design and methods, research /Devices, data collection methods, andPopulation and Sampling Procedures. This chapter specifically answers the “how?” and “why?”these methods, procedures, techniques, and formats are employed. It also describes theproposed solution strategy/approach or method and expected results.The main issue at stake for this research work can be summarized into one research question:do complementary assets contribute positively to value creation in organizations beyond ITinvestments? This work uses the methods, procedures, techniques, and formats it employs toanalyze the relationships between complementary assets and benefits beyond IT investments.20
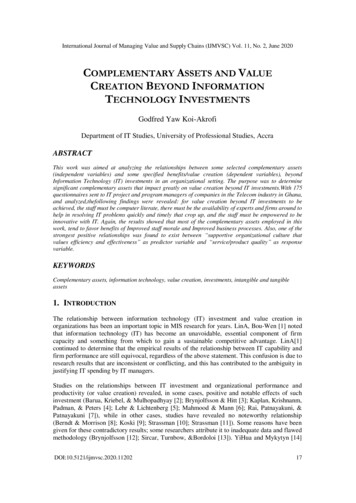
International Journal of Managing Value and Supply Chains (IJMVSC) Vol. 11, No. 2, June 20203.2. Research Design and MethodThis research adopts both qualitative and quantitative approaches. The quantitative approach isemployed because it involves the systematic empirical investigation of social phenomena viastatistical, mathematical, or computational techniques. The objective of quantitative research isto develop and employ mathematical models, theories, and/or hypotheses about phenomena,which forms part of the scope of this work. A qualitative approach is also employed becausethis work seeks systematic empirical inquiry into meaning [27]. By systematic he meansplanned, ordered, and public, following rules agreed upon by members of the qualitativeresearch community. By empirical, means that this type of inquiry is grounded in the world ofexperience. Inquiry into meaning says researchers try to understand how others make sense oftheir experience. Qualitative research seeks out the “why”, not the “how” of its topic throughthe analysis of unstructured information – things like interview transcripts, open-ended surveyresponses, emails, notes, feedback forms, photos, and videos. It does not just rely on statisticsor numbers, which are the domain of quantitative researchers. Qualitative research is used togain insight into people's attitudes, behaviors, value systems, concerns, motivations, aspirations,culture, or lifestyles; some of which are employed in this study. It is used to inform businessdecisions, policy formation, communication, and research. Focus groups, in-depth interviews,content analysis, ethnography, evaluation, and semiotics are among the many formalapproaches that are used, but qualitative research also involves the analysis of any unstructuredmaterial, including customer feedback forms, reports, or media clips.Apart from the questionnaire administration, IT, few strategic/top, tactical, and operationalmanagers of the organizations concerned wereinterviewedindividually and in groups to givetheir candid views concerning the subject matter. The information that was gathered from theseinterviews and discussions formed the basis for the qualitative aspect of the study, that is, theformulation of the conceptual framework and the various parameters/measures which formedthe basis for the theoretical framework and subsequently the quantitative analysis.Quantitatively, the data gathered from the questionnaires are coded into a 5 category Likertscale that is analyzed using statistical models and tests and interpreted. Quantitative studies areused to test hypotheses to support the generalizations from the qualitative study, estimateparameter coefficients, and determine the significance of parameters and models. Thetheoretical framework derived from the conceptual framework based on inputs from ITmanagers, top executives, tactical and operational managers of the Telecom industry in Ghana,especially in the area of determination of metrics for the complementary assets, is shown infigure 1 below:21
International Journal of Managing Value and Supply Chains (IJMVSC) Vol. 11, No. 2, June 2020COMPLEMENTARY ASSETS (LAUDON & LAUDON, 2012)ORGANIZATIONALINVESTMENTS(OI)Strong ISdevelopmentteamMETRICS OF COMPLEMENTARY ASSETSMETRICS DERIVED FROM FOCUS INTERVIEWSSuccess Rate of SIT(system integration test). Shouldbe 99%Success Rate of UAT(user acceptance test). Shouldbe 90%Efficient businessprocesses and appropriatemodelSpeed of deliveryCustomer feedbackSupportive organizationalculture that valuesefficiency and effectivenessMinimal internal customer complaintsAwareness of the processes and productsDecentralized authority anddistributed decision-makingrightsBENEFITS OF ITINVESTMENTS (BITI):TANGIBLE ANDINTANGIBLE· Increased Revenue· EnhancedCompetitiveAdvantage· Improved staff morale· Improved BusinessProcess· Improved DecisionMaking· Improved Product/Service qualityMANAGERIALINVESTMENTS(MI)Speed in decision-makingMETRICS DERIVED FROM FOCUS INTERVIEWSFundingStrong senior managementsupport for technologyinvestment and changeMaterials and HR provisionRewardsIncentives for managementinnovationDeliver on time, quality, according to specificationsand less changesTeam work andcollaborative environmentsFrequency and quality of TrainingTraining programs toenhance managementdecision skillsStaff InnovationMotivated staffManagement culture thatvalues flexibility andknowledge-based decisionmaking(Ahmad & Arshad, 2014)SOCIAL INVESTMENTS(SI)Internet and TelecommunicationsInfrastructureIT-Enriched educational programsraising labor force computer literacyMETRICS DERIVED FROM FOCUS INTERVIEWSAccess to the internet and use of infrastructureFrequent training in IT resulting in the ability of staffto resolve first-line maintenance issuesIssues with government agencies and private sectorresponsible for standardizationStandards(Government and Privatesector)Laws and regulation creating fair,stable market environmentsSurcharge or issues with regulatory bodiesAvailability of vendors, manufacturers, and suppliersTechnology and service firms inadjacent markets to assistimplementationFigure 1: Theoretical FrameworkSource: AuthorWe use the ordinal regression model as employed in SPSS because the data, especially the factthat the data of the dependent variable are of the ordinal type, and the independent variables arealso ordinal and categorical, which are considered in SPSS as factors. Continuous independentvariables are also considered in SPSS as covariate variables.The general model is as follows:22
International Journal of Managing Value and Supply Chains (IJMVSC) Vol. 11, No. 2, June 2020Taking the dependent variable BITI as in figure 1, we haveLn (ϴj/ 1-ϴj) ß0j -ß1 R1-ß2 R2 -ß3 R3- - ß14 R14 eqn. iThe function on the left-hand side of the equation is termed the logit function. ßn (where n isfrom 1 to 14) is the coefficient of an independent variable. Each logit has its ß0j term but thesame coefficient ß. That means that the effect of the independent variable is the same fordifferent logit functions.3.3. Research FormatThe research format is predominantly exploratory and causal. Exploratory, because experiencesurvey as a method under exploratory was employed. For experience surveys, experienced ITmanagers, as well as the top, tactical, and operational managers, wereinterviewed individuallyon the subject matter. This approach considers every experienced person in the company toensure fair evaluation of issues, rather than only executives who may conceal a lot ofinformation; it is a broad-based approach. An executive survey was employed because thestudy was interested in primary data only.Again, it is a causal study because the study was interested in finding relationships as isdemonstrated by the model above. Here we are looking at the concomitant variation—thedegree to which a presumed cause (e.g. OIDP-Strong Information System development team)and a presumed effect (BITI) occur together or vary together. This is where the hypothesiscomes in. If the stated hypothesis was that there is a positive relationship between OIDP andBITI, and it turns out to be false at the end of the day, after hypothesis testing, then thehypothesis is not supported.3.4. sThe 5 category Likert scale was used for the questionnaire administration. This is an orderedscale with code 1 representing strongly agree, 2 agree, 3 neutral, 4 disagree, and 5 stronglydisagree. This goes for both dependent and independent variables, where applicable. Likertscale data is an ordinal data type that requires non-parametric tests and non-parametricregression methods. The median is also used instead of the mean as a measure of centraltendency. There are two schools of thought as to the treatment of Likert scale data. Someresearchers [28, 29, 30] are of the view that Likert scale data is ordinal data, and that using the5 category scale employed in this study as an example, the difference between consecutivecategories, even though is one, and hence satisfying the equidistance condition for an intervalscale data type, is still ordinal. They argue that the difference between “agree” and “stronglyagree” is not the same as between “strongly disagree” and “disagree”, and for that matter, theequidistance property is of no use. To these researchers, only non-parametric tests (chi-squared,Spearman’s Rho, or the Mann–Whitney U-test, Kruskal-Wallis test: a non-parametricalternative to ANOVA) and non-parametric regression analysis (ordinal regression, localpolynomial regression, kernel estimation, and smoothing splines) are applicable. To otherresearchers [31, 32] this is not so. They consider Likert scale data as having both ordinal andinterval characteristics. They also argue that an assumption of equidistance can be made,especially with the 5 category Likert scale where the middle number 3 represents neutral.They continue to argue that with a large sample size (over a hundred), and well spread to covera majority area of the population, with different categories of respondents, the data assumes anormal distribution where all the measures of central tendency (mode, median, and mean)appear to merge at the middle; in other words, skewness assumes that of the Gaussian ornormal distribution, and parametric tests such as the Pearson correlation, and ANOVA analysis23
International Journal of Managing Value and Supply Chains (IJMVSC) Vol. 11, No. 2, June 2020can be employed. Again, they argue that in this instance the mean can be used instead of themedian. Another assumption they make is the number of categories of the Likert scale; thehigher the number of categories (more than 3) for the dependent variable/s, the more outcomesbecome accurate with the usage of parametric tests and methods.In this study, the author sides with the view that Likert scale data, especially for dependentvariables, have ordinal characteristics, and hence should be analyzed using non-parametric testsand methods. The parametric analysis will therefore not be used for this study. The regressionmodel above has been modeled based on the ordinal regression model which is non-parametric.SPSS (Statistical Package for the Social Sciences) is employed to run the statistics (bothdescriptive and inferential). A Non-parametric analysis is interested in the following: Spearmanrank correlation coefficient, parameter estimates, Strength of Association-Pseudo R Square:Cox and Snell R2, Nagelkerke’s R2, McFadden’s R2, overall fitting test, and parametersignificance. Descriptive statistics such as the mean, standard error, median, mode, standarddeviation, sample variance, kurtosis, and skewness are also estimated, even though it is only themedian that is used. Inferential statistics are used to test hypotheses stated, that is, to generalizeobservations made with samples to the larger population from which they were selected. Themost significant parameters are then compared for the model to see which one has the greatestimpact on the dependent variable. The result is the formulation of a model using thesesignificant parameters. The focus of the study, however,was to determine these significantparameters, and not to find a fitting model per se.Reliability (the extent to which a questionnaire, test, observation, or any measurementprocedure produces the same results on repeated trials) analysis is done to ensure whether thequestions in the questionnaire can be relied upon for good analysis or not. This is essential asthe outcome of this work was also to find the significant complementary assets that help createvalue beyond IT investments.3.5. Data Collection MethodsThis study used or employed primary data for its analysis. No secondary data was used. All theinformation was gathered from face-to-face interviews and questionnaire administration. Usingthe 5 category Likert Scale, several questions were asked for the dependent variables (BITI); 6in all as shown in the theoretical framework (Figure 1).For the independent variables (14 in all), they are all considered as categorical (factors). Thereare no continuous (covariates) variables. The ordinal type of independent variables still followsthe 5 category Likert scale where answers/responses to these questions were coded from 1 to 5,which is from “strongly agree” to “strongly disagree”, analyzed in SPSS, and then interpreted.3.6. Population and Sampling ProceduresThe service sector in Ghana was used as the population for this study. The service sectorincludes the following: telecommunications companies, banking and non-banking financialhouses, hospitals, utility services, and so on. The telecommunications industry was, however,the only one considered as a case for this study. This industry was chosen from the lot in theservice sector because it uses or employs IT more in its operations than the others. ITinvestments are huge in this industry, and so dealing with them would present an interestingscenario in terms of the data collection, interviews, results/outcomes, and so on. All the telcoshave their headquarters in Accra, and most of their operations are in Accra, and so Accra waschosen as the location for the survey. A probability sampling (random sampling) method wasemployed.24
International Journal of Managing Value and Supply Chains (IJMVSC) Vol. 11, No. 2, June 20203.6.1. SurveysSelected IT project managers/ IT managers and IT professionals for the case industry wereemployed for the face to face and focus interview sessions. The main aim was to targetexperienced and knowledgeable professionals in the IT space to interview on the subject matter.For the questionnaire administration, one hundred and seventy-five (175) questionnaires were,however, sent to IT managers, IT project managers, IT program managers, and all stakeholdersin the IT project space of the targeted industry. The Telecommunications industry in Ghana has5 active companies namely MTN, VODAFONE, TIGO, AIRTEL, and GLOBACOM. Thirtyfive questionnaires were sent to each of them summing up to one hundred and seventy-five.3.6.2. Sample Size CalculationAn approximate number of sixty-four (64) employees in the IT project space (IT managers, ITprofessionals, IT project managers, IT program managers, and so on) for one of the Telcos wasused as a standard sampling unit for the 5 sampling frame. In effect, the approximate targetpopulation was estimated to be (64*5) which is three hundred and twenty (320). For a commonchoice of 5% margin error, and a standard choice of 95% confidence level, which gives a Zscore of 1.96, and a sample proportion of 50% typical of a first time survey, a sample size ofone hundred and seventy-five (175) was realized. This was the sample size employed for thestudy. The formula used for the calculation of the sample size is as follows:Z2 *P (1-P)n 1 ((Z2 * P (1-P))/ e2 N)Where N POPULATION 320, Z score 1.96, P sample proportion 50% 0.5, e errormargin 5% 0.054. RESULTS4.1. IntroductionThe telecommunications industry was used as a case for the study. In Ghana, the majortelecommunications companies are MTN, VODAFONE, TIGO, AIRTEL, and GLO. Themetrics for the complementary assets were developed during an initial survey engaging 8 ITproject and program managers from the 5 Telcos in Ghana. The questionnaire for the thesiswork was then developed. The questionnaire consists of 4 parts: personal information,Information about the organization related to IT projects of which the answers are of thedichotomous type (yes or no), IT investment benefits( the dependent variables), and thecomplementary assets (independent variables).Thirty-five (35) questionnaires were sent to each of the above Telcos, and the people targetedwere IT project stakeholders, especially, IT project and program managers. In all 175questionnaires were administered, but only 125 were retrieved from all the Telcos; 50 were notretrievable. This was due to the tight schedules of the respondents, among other things. Out ofthe 125 respondents, 123 people answered the question of the number of years worked in theorganization, and the output shows that about 77.2% of them have worked in theirorganizations from between 0-9 years. 13% have worked between 10-14 years and the minority9.8%, beyond 14 years. This gives fairly balanc
Laudon [17] continued to say that before business firms can reap the advantages of new information technologies, they need to change how they do business; some firms fail/refuse to . o Teamwork and collaborative work environments . o Laws and regulations creating fair, stable market environments