Transcription
Earth and Planetary Science Letters 460 (2017) 50–59Contents lists available at ScienceDirectEarth and Planetary Science Letterswww.elsevier.com/locate/epslTrapped bubbles keep pumice afloat and gas diffusion makes pumicesinkKristen E. Fauria a, , Michael Manga a , Zihan Wei a,babDepartment of Earth and Planetary Science, UC Berkeley, 307 McCone Hall, Berkeley, CA 94720-4767, United StatesDepartment of Earth and Space Sciences, Peking University, Beijing, Chinaa r t i c l ei n f oArticle history:Received 14 September 2016Received in revised form 26 November 2016Accepted 29 November 2016Available online xxxxEditor: T.A. MatherKeywords:buoyancycapillary processespercolation theorysubmarine volcanismX-ray microtomographya b s t r a c tPumice can float on water for months to years – long enough for pumice to travel across oceansand facilitate the spread of species. Long-lived pumice floatation is unexpected, however, becausepumice pores are highly connected and water wets volcanic glass. As a result, observations of longfloating times have not been reconciled with predictions of rapid sinking. We propose a mechanismto resolve this paradox – the trapping of gas bubbles by water within the pumice. Gas trapping refersto the isolation of gas by water within pore throats such that the gas becomes disconnected from theatmosphere and unable to escape. We use X-ray microtomography to image partially saturated pumiceand demonstrate that non-condensable gas trapping occurs in both ambient temperature and hot (500 C)pumice. Furthermore, we show that the size distribution of trapped gas clusters matches predictions ofpercolation theory. Finally, we propose that diffusion of trapped gas determines pumice floatation time.Experimental measurements of pumice floatation support a diffusion control on pumice buoyancy and1. IntroductionPumice is a highly vesicular volcanic rock with a porosityhigh enough that it can float. Rafts of volcanic pumice can transit lakes and oceans and circle the globe (e.g., Richards, 1958;Risso et al., 2002; Bryan et al., 2004; von Lichtan et al., 2016).For example, pumice from the 1952 eruption of Volcán Barcena onIsla San Benedicto, 600 km west of Mexico, floated for at least 560days and drifted over 8700 km (Richards, 1958). The 2012 eruptionof Havre submarine volcano created a 1.5 km3 pumice raft thatspread over 550,000 km2 within three months (Carey et al., 2014;Jutzeler et al., 2014). Pumice rafts have been shown to facilitatethe dispersal of species such as barnacles, corals, algae, and gastropods (Bryan et al., 2012) because marine organisms grow on,and ocean currents advect, pumice (Richards, 1958; Jokiel, 1984;Bryan et al., 2004). While pumice rafts are relatively common andit is well known that ambient temperature pumice can float forlong periods of time, the enduring buoyancy of pumice is surprising because pumice pores are almost entirely connected and wa-*Corresponding author.E-mail address: kfauria@berkeley.edu (K.E. 550012-821X/ 2016 Elsevier B.V. All rights reserved.2we find that floatation time τ scales as τ DLθ 2 where L is the characteristic length of pumice, D isthe gas–water diffusion coefficient, and θ is pumice water saturation. A mechanistic understanding ofpumice floatation is a step towards understanding how pumice is partitioned into floating and sinkingcomponents and provides an estimate for the lifetime of pumice rafts in the ocean. 2016 Elsevier B.V. All rights reserved.ter wets pumice (Whitham and Sparks, 1986; Vella and Huppert,2007). Quantitative models for pumice saturation predict that ambient temperature pumice should sink orders of magnitude morerapidly than is observed (Vella and Huppert, 2007). The floatationtime discrepancy between observations and the Vella and Huppert (2007) model suggests that simple gas displacement by aninfiltrating water front is not sufficient to explain why ambienttemperature pumice can float for years.By comparison to ambient temperature pumice, hot pumice(e.g., 300 C) sinks almost immediately and the tendency for airfilled pumice to sink increases with pumice temperature (Whithamand Sparks, 1986; Dufek et al., 2007; Allen et al., 2008; Jutzeler etal., 2016). Rapid water ingestion by hot pumice has been attributedto cooling-induced gas contraction (Whitham and Sparks, 1986;Cashman and Fiske, 1991; Allen et al., 2008) and hydrodynamicinstabilities due to steam generation (Dufek et al., 2007). Air-filledhot pumice placed in water does not, however, completely saturate even at high (500 C) temperatures (Allen et al., 2008). As aresult, we wish to understand how gas remains within initially hotpumice and what differences and similarities exist between saturation of ambient temperature and hot non-condensable gas filledpumice.
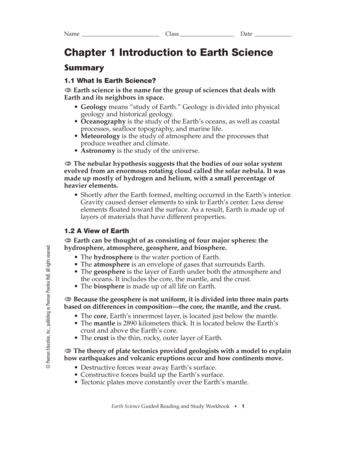
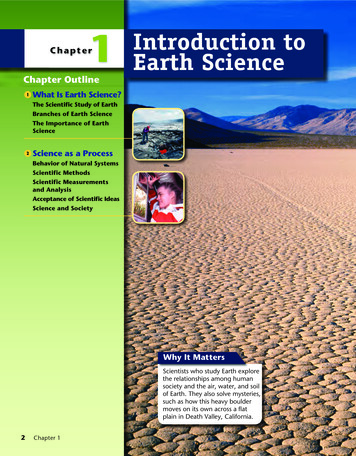
K.E. Fauria et al. / Earth and Planetary Science Letters 460 (2017) locitydynamic viscositysurface tensiondensitygravitypermeabilityconnected porosityheightvolume of water absorbedtimepumice surface areanumber of occurrencessites or porespower law coefficientspatial dimensionfractal dimension a clustermaximum size of a trapped gas clusterpumice diametersurface area of trapped gas clusterstrapped gas volumepτD effθDdPRTLwDwTiTfViVfξξiξ ρrρlvolume–area coefficientpumice floatation timescaleeffective diffusion coefficientwater saturationliquid–gas diffusion coefficientmean pore throat diameterpressurepore throat radiustemperatureglass wall thicknesswater thermal diffusivityinitial temperaturefinal temperatureinitial volumefinal volumegas saturationinitial gas saturationneutral buoyancy gas saturationglass densityliquid densityFig. 1. Mechanisms of gas trapping. Illustrations of gas trapping by (a) bypass and (b) snap-off trapping in pumice with connected pores. In both cases capillary forces drawwater into pores such that water completely surrounds the gas phase and the gas is unable to escape.Pumice, with porosities of 50 to 90 percent, is a porousmedium. Water saturation of pumice is an example of two-phaseflow in porous media and requires the replacement of a defendingfluid (air or magmatic gases) with an invading fluid (liquid water).Two-phase flow in porous media has been widely studied in thecontext of the vadose zone, oil recovery, CO2 sequestration, andgas sparging. In addition, water infiltration of pumice is a manifestation of a particular type of two-phase flow, imbibition, becausewater is the wetting phase. During imbibition the arrangement offluid, or wetting pattern, can range from one where nearly all thepores are filled with the invading fluid to one where the defending fluid remains trapped in clusters (e.g., Lenormand and Zarcone,1984). Trapped gas clusters (Fig. 1), pockets of non-wetting fluidthat are surrounded by the wetting fluid, are not only characteristic of two-phase flow in porous media but are very difficultto mobilize because of surface tension. Indeed, gas trapping is amechanism employed for long term CO2 sequestration (e.g., Ide etal., 2007; Benson and Cole, 2008).We hypothesize that pumice floats for long periods of timebecause of the occurrence of gas trapping (either air or noncondensable magmatic gases) in isolated gas clusters during waterinfiltration. We use X-ray microtomography to test the hypotheses that gas trapping occurs in both hot and ambient temperaturepumice, that gas trapping can result in a high enough residualgas saturations to keep pumice afloat, and that percolation theorycan describe gas trapping in pumice. While trapped gas may buoypumice, we hypothesize that the outward diffusion of gas trappedin bubbles eventually causes pumice to sink. We test this gas diffusion hypothesis by conducting experiments where we measure thefloatation time of dry and ambient temperature pumice on artificial seawater in a controlled laboratory setting. We then compareour results and pumice floatation times from four other studieswith a prediction for pumice floatation time based on gas-diffusionout of a porous medium.1.1. Gas trapping in porous mediaGas trapping has been observed in experiments, dictates wetting patterns, and controls residual non-wetting saturation ofporous media (e.g., Blunt and Scher, 1995; Iglauer et al., 2013;Geistlinger and Mohammadian, 2015). A key element that promotes gas trapping is the slow advance of the invading fluid suchthat capillary forces dominate over viscous forces. In other words,the Capillary numberCa vμγ,(1)
52K.E. Fauria et al. / Earth and Planetary Science Letters 460 (2017) 50–59where v is the characteristic velocity, μ is the wetting fluid viscosity, and γ is surface tension on the interface between thetwo fluids, is very small, Ca 1 (Lenormand and Zarcone, 1984;Wilkinson, 1984; Blunt and Scher, 1995).We calculate a Capillary number for water infiltration into drypumice using μ 10 3 Pa s for the viscosity of water at roomtemperature, γ 0.072 N m 1 for the surface tension at the air–water interface, and by estimating the velocity of water infiltratingpumice using Darcy’s law. For pumice floating on water, the maximum head gradient is set by the hydrostatic pressure at the bottom edge of the pumice and the capillary pressure. By assuming aconstant pore radius and a hemispherical gas–water meniscus wecan write the liquid velocity as v κ2γ,ρ gh μφR(2)where κ is permeability, φ is connected porosity, ρ is water density, g is gravity, h is the height of pumice in water, and R is porethroat radius. Pumice porosities can vary widely, but typical values are 50 to 90 percent (pumice with rock equivalent densitiesbetween 2.4 and 3.0 g cm 3 must have porosities of at least 58to 67 percent, respectively, to initially float). Pumice permeabilities are more difficult to estimate, but measured values range from10 14 –10 10 m2 (e.g., Klug and Cashman, 1996; Tait et al., 1998;Saar and Manga, 1999; Klug et al., 2002; Rust and Cashman, 2004,2011; Mueller et al., 2005; Wright et al., 2006, 2009; Degruyter etal., 2010). We note that permeability may also be a function of saturation, i.e., relative permeability is not unity. We consider pumicethat is immersed 0.01–1 m in water and pores that have radii of0.1–0.001 mm. From these input parameters, 3.8 10 11 Ca 4.3 10 4 , which shows that capillary forces dominate in pumice.We also use pumice saturation measurements from Whithamand Sparks (1986) to estimate water infiltration velocities according to,v Vwt Saφ(3)where V w is the volume of absorbed water, t is time, S a is pumicesurface area, and φ is connected porosity. We estimate S a by assuming the pumice clasts are spherical. Fourteen pumice saturation measurements by Whitham and Sparks (1986) reveal averageinitial infiltration velocities over the first five minutes of water exposure of 2.74 0.97 10 2 cm hr 1 and Capillary numbers of7.62 2.69 10 8 . These Ca estimates indicate that capillary forcesdominate. Thus, the saturation of pumice should be considered atthe pore scale and may lead to gas trapping. In the next sectionswe introduce two mechanisms that allow gas trapping to occur,the percolation models that simulate them, and the gas-trappingpredictions percolation theory makes.1.1.1. Bypass trappingBypass trapping (Fig. 1a) causes trapping through the sequential filling of pore throats such that the defending fluid becomessurrounded by the invading fluid before it can escape (e.g., Chatziset al., 1983). Invasion percolation models simulate bypass trappingby (1) representing the porous medium as a network of spheres(pores) and cylinders (pore throats); (2) prescribing a capillary entry pressure for each throat and pore; and (3) filling throats andpores from highest to lowest pressure. As a result, a pore or series of pores with low capillary pressures may be completely surrounded before being filled and thus become trapped (but maycontract or expand if compressible).1.1.2. Snap-off trappingSnap-off trapping occurs because for very low flow rates (orcapillary numbers) the wetting fluid can flow along edges of thepore walls due to surface roughness (e.g., Lenormand and Zarcone,1984). This wall-hugging thin film can swell as the wetting fluidinvades. As the film swells in the smallest throats, it completelydisplaces the non-wetting phase and can disconnect the nonwetting phase from any neighbors (Fig. 1b). Snap-off trapping issimulated by Bond percolation. When snap-off and bypass trappingare both possible, bypass trapping is favored because it occurs forhigher capillary pressures.1.1.3. Percolation model predictionsBoth invasion and bond percolation theory make predictionsabout the size distribution of residual trapped gas clusters. Becausepercolation systems are scale invariant at the critical point (whenfully percolated), the number of occurrences, n(s), of trapped gasclusters containing s sites or pores scales according to a power-law,n(s) s β ,(4)a fwhere β f and a is the spatial dimension and f is the fractal dimension of the cluster. In 3D: a 3, f 2.52, and β 2.19(Stauffer, 1979; Wilkinson and Willemsen, 1983). The maximumsize of the trapped gas cluster is limited by the samples size, L,smax L f (Wilkinson, 1986). Experimental studies of imbibitionin porous media have shown that trapped gas size distributionsmatch Equation (4) (e.g., Geistlinger and Mohammadian, 2015). Examining the size distribution of trapped gas bubbles in a naturalsystem, such as pumice, can therefore help distinguish if percolation theory (either Bond or Invasion) applies.2. X-ray microtomographyX-ray microtomography (μXRT) allows us to see both the internal structure of pumice (e.g., Polacci et al., 2006; Wright et al.,2006; Degruyter et al., 2010; Giachetti et al., 2011; Voltolini et al.,2011; Carey et al., 2013) and, when multiple fluids are presentwithin the pores, the distribution of those fluids (e.g., Wildenschildet al., 2002). We use μXRT to (1) test the hypothesis that gas trapping occurs in pumice; (2) determine if percolation theory candescribe the size distribution of trapped gas; (3) examine the sizedistribution of trapped gas for insights into the mechanisms (bypass or snap-off trapping) that occur in pumice.2.1. Experimental set-upWe used μXRT to image the internal distribution of liquid andair in six uncut pumice clasts. Before the μXRT, we conductedsaturation experiments on ambient temperature and hot (500 C)pumice from Santa Maria, Guatemala and Medicine Lake, California (Table 1). We set ambient temperature pumice on a 13 wt%solution of potassium iodide (KI) for 20 h such that the pumicecould adsorb the liquid. KI, a common chemical dopant, increasescontrast of the μXRT images (greatly improves the segmentation ofair and water in the images), while maintaining a surface tensionwithin 1% of water (Aveyard and Saleem, 1976; Wildenschild et al.,2002).We heated two of the pumice samples (SM04 and SM05) to500 C, quenched these pumice clasts in the KI dopant, and allowed them to stay in the solution for 10 min. All pumice poreswere filled with air at the time of KI exposure. To preserve theinternal fluid distributions for μXRT imaging, we then rapidly removed and encased the pumice in wax.We carried out the μXRT imaging at the Lawrence Berkeley National Lab Advanced Light Source on beamline 8.3.2. We conductedthe scans using 30 kev monochromatic X-rays and a 5X lens (resolution of 1.22 μm/pixel). We used the TomoPy gridrec algorithmto reconstruct the 3D image stacks (Gürsoy et al., 2014).
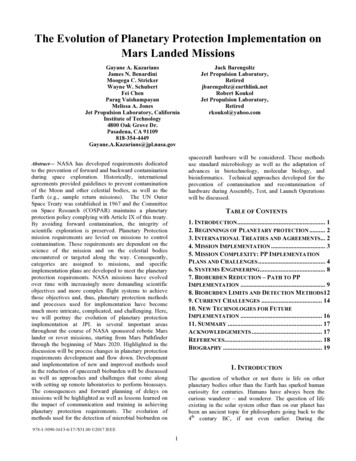
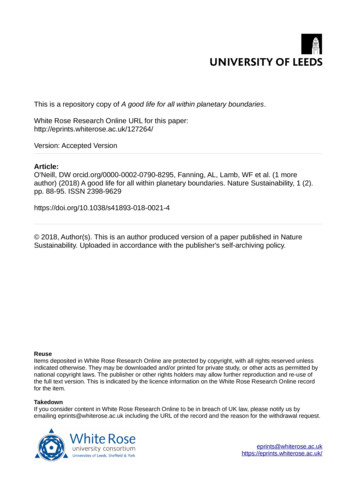
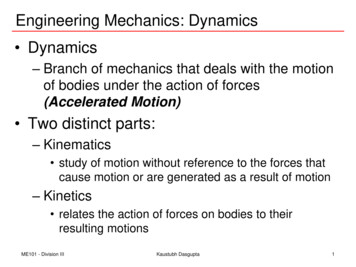
K.E. Fauria et al. / Earth and Planetary Science Letters 460 (2017) 50–5953Table 1μXRT samples (uncut clasts) and measurements.Sample nameSM01SM02SM04SM05ML01ML02Sample descriptionPumice mass (g)Pumice dimensions mm3TemperatureEnding buoyancyPorosityConnected porosityLiquid volume/total volumeGas volume/total volumeLiquid saturation(liquid volume/pore volume)Calculated wet density/KI densityTrapped gas bubble numberdensity (cm 3 )Vesicle number density (cm 3 )β : Power law exponentSmallest bubble fitto power law (mm3 )p: Trapped bubble volume tosurface area exponentSize of analyzed volume (mm3 )1902 Santa Maria0.079 4.5 4ambientfloating0.700.700.300.400.431902 Santa Maria0.1911 7 4.5ambientneutrally buoyantNANANA0.36NA1902 Santa Maria0.1311 6 5500 Cnot floating0.730.730.560.170.771902 Santa Maria0.046.5 3 3500 Cnot floatingNANANA0.13NAMedicine Lake0.159.5 5 5ambientnot floating0.630.550.130.500.21Medicine Lake0.765 5 4ambientbarely floating0.670.650.310.360.460.869.6 105NA3.0 1061.074.4 106NA4.2 1060.837.2 1060.932.3 1068.3 1062.025.9 10 5NA1.901.3 10 51.5 1071.952.3 10 5NA2.103.1 10 69.6 1061.831.3 10 45.3 1061.511.0 10 hile μXRT analysis is done on subvolumes of larger clasts, we expect the subvolumes to be representative of the larger pumice in part because the pumice are relativelysmall (i.e., 1 g). Furthermore, the selected pumice samples do not have bread crust textures such that we expect differences between rim an internal porosities to beminimal.To minimize ring artifacts, we selected a subvolume from eachdata set of either 0.37 or 0.94 mm3 for data processing. We usedFiji’s Trainable Weka Segmentation plugin – which employs multiple machine learning algorithms – to segment air, water, androck within each image sequence (Hall et al., 2009). To train classifiers for each image sequence, we manually outlined vesicles andtrapped air on fifty different images. After checking and retraining the classifiers as necessary, we applied the trained classifiersacross the images sequences to segment air and rock (thereby creating two sets of binarized image sequences for each sample).We also made the image sequences binary by applying agreyscale threshold in Fiji, but determined that the machine learning method reduced the effect of annular ring artifacts and betterpreserved thin glass walls compared to the traditional thresholdbased binarization method. Despite the advantages of the machinelearning method, two image sets (SM02 and SM05) had glass wallsthat were too thin to resolve and we do not report porosities orvesicle size distributions for these samples.After we segmented each data set, we loaded the binary imagesinto Avizo where we identified and quantified the volume, surfacearea, and orientation of individual bubbles and vesicles. Here werefer to the pores of the pumice (that can be filled with either gasor liquid) as vesicles and areas where the gas phase is present asbubbles. Because most samples had highly interconnected porosities, we separated connected vesicles using a watershed algorithmbefore measuring vesicles sizes and orientations (Supplementaryinformation). No separation was applied to the gas bubbles. As aresult, any observed and reported gas bubbles were truly isolated.We note, however, that some gas bubbles may appear connected(by one or two voxels) when they are not if glass walls are thinner than one pixel. To correct for very thin glass walls we usea “neighborhood” value of six in the Avizo labeling module suchthat bubbles must share at least one voxel face to be consideredconnected.Errors in generating the bubble and vesicle size distributionsstem from two main sources: (1) ring artifacts in the originalgreyscale image and (2) vesicle walls that are thinner than thevoxel resolution and that may also lead to overestimates of connected porosity (Fig. S1). Through examination of twenty 2D images from each dataset, we estimate that ring artifacts result in themischaracterization of gas or water in 1 volume percent of eachpumice. While the machine learning method for image segmentation reduced the effects of ring artifacts compared to thresholdbased segmentation, it introduced a number of very small (artifact)bubbles and vesicles that do not contribute to the total volumefraction of pores or trapped gas. As a result, we filtered the data toexclude any bubbles or vesicles with less than a 4.16 pixel radiusor smaller than 10 6 mm3 .2.2. X-ray microtomography resultsWe find trapped gas clusters in all pumice we imaged (Figs. 2and 3). Trapped gas cluster size varies and gas clusters fill partof, single, and multiple vesicles (Figs. 2 and 3). Because connectedporosities for most samples are close to or equal to the total porosity, isolated gas pockets are due to trapping by liquid instead ofisolation by rock (Table 1). Furthermore, we found that ambienttemperature pumice contain larger volume percentages of trappedgas (36–50%) than the hot pumice (13 and 17%) (Table 1).We use μXRT measurements of phase (liquid and water) saturations to estimate pumice buoyancy, assuming glass densities of2.4 g cm 3 , and find that the observed trapped gas saturationsare high enough to allow pumice to float. These density calculations match our observation that many of the pumice clasts werefloating or neutrally buoyant when we encased them in wax. Ourdensity calculation of ML01, however, does not match our observation that ML01 was not floating (Table 1). Discrepancies betweenobservations and density estimages suggest that gas and liquid saturation within pumice is likely heterogeneous. Indeed, we visuallyobserved areas of more and less gas saturation within μXRT images.The size distributions of both trapped gas (black) and segmented pores (grey) are shown in Fig. 4. For the majority ofsamples (ML02, SM01, SM02, and SM05) at least a third of thetrapped gas is contained within one large cluster. These clusters,in cases where the vesicle size distributions are known (SM01 andML02), greatly exceed the maximum vesicle size and Fig. 3 showshow these largest trapped bubbles can extend throughout multiple vesicles. The trapped bubble size distributions, however, showthat there are multiple modes of trapped bubbles sizes. In sample
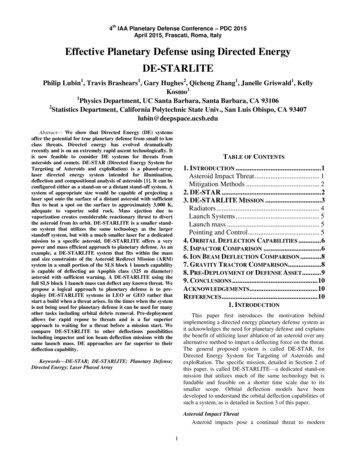
54K.E. Fauria et al. / Earth and Planetary Science Letters 460 (2017) 50–59Fig. 2. X-ray microtomography images. 2D slices through μXRT images of pumice containing water and trapped gas. While hot pumice (SM04 and SM05) contain trapped gas,they hold smaller volume percentages compared to ambient temperature pumice. Contacts between rock, liquid, and gas demonstrate that the liquid is the wetting fluid (seered box). While glass walls are too thin to resolve in places (particularly in SM02 and SM05), we do not see any evidence in the μXRT that the thin glass walls in pumiceare broken or damaged due to cleaning in an ultrasonic bath. (For interpretation of the references to color in this figure legend, the reader is referred to the web version ofthis article.)Fig. 3. Shapes of trapped gas bubbles. 3D μXRT images of trapped gas bubbles within pumice. Colors in this figure are chosen at random to identify separate gas bubbles.The top rows show the largest gas bubbles and the bottom row shows all gas bubbles within a single pumice. A single interconnected gas bubbles extends throughout manypores in pumice SM01. (For interpretation of the references to color in this figure legend, the reader is referred to the web version of this article.)ML01, the trapped bubble size distribution mirrors the vesicle sizedistribution.2.3. Comparison to percolation theoriesHere we test the hypothesis that percolation theory can describe gas trapping in pumice by fitting Equation (4) to the observed distributions of trapped gas clusters using the maximumlikelihood method (Clauset et al., 2009; Iglauer and Wülling, 2016).We find that Equation (4) fits the observed distributions welland that fitted power-law coefficients range from 1.51–2.10, which(other than the coefficient for ML01) are close to the value predicted by percolation theory (β 2.19) (Fig. 5; Table 1). Thesepower-law fits lend support to a percolation theory treatment ofpumice saturation.Percolation theory also predicts:A V p,
K.E. Fauria et al. / Earth and Planetary Science Letters 460 (2017) 50–5955Fig. 4. Bubble and vesicle size distributions. Trapped gas bubbles, locations where only the gas is present, are shown in black, and vesicles, pumice pores that can be filledwith liquid or gas, are in grey. At least a third of the trapped gas is contained with a single large bubble for most of samples. The existence of large trapped bubbles, incombination with the vesicle size distribution, demonstrates that at least the largest gas clusters often extend through multiple pores. Bubbles and vesicles are binned intofifty logarithmically spaced bins and each bin is divided by the total volume of air or vesicles. Volume fraction is not weighted by bin width such that the sum of all binsequals one.Fig. 5. Power-law fits of bubble-size distributions. Measured distributions of trapped bubble volume (grey circles) and the fitted power-law distributions (dashed lines). They-axis shows the probability that a bubble is larger than a given volume, V . With the exception of ML02, the fitted power-law coefficients, β , are consistent with the valuepredicted from percolation theory, β 2.19. Because our machine learning segmentation method generated very small (artifact) bubbles, we removed bubbles smaller than10 6 mm3 before fitting a power-law coefficient.where A is the surface area of the trapped clusters, and V is thevolume of the trapped clusters (Stauffer, 1979). From our data sets,we empirically find p 0.75–0.83 and the R 2 values for these fitsare 0.95–0.99 (Table 1 and Fig. S2). Values of p greater than 2/3demonstrates that the gas bubbles are non-spherical.percolation theory can describe the distribution of trapped gasclusters. The occurrence of gas trapping does not, however, explain why pumice, after floating for days or months, eventuallysinks.3.1. Pumice floatation experiments3. Mechanisms that cause pumice to sinkThe previous sections demonstrated that gas trapping occursin pumice, that ambient temperature pumice traps more gasthan hot (500 C) pumice, that gas trapping can lead to highenough residual gas saturations to allow pumice to float, and thatTo examine why pumice sinks, we conducted pumice floatation experiments using pumice from the 1902 plinian eruption ofSanta Maria Volcano, Guatemala. We placed the pumice in artificial seawater and measured the time it took for the pumice tosink. Before the experiments, we cleaned the pumice in an ultra-
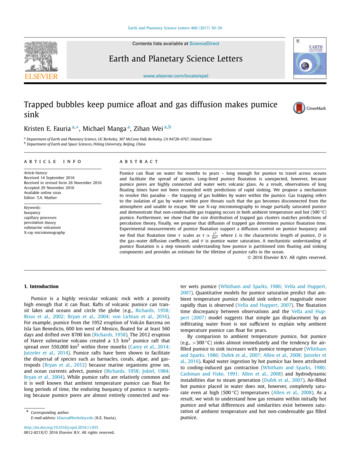
56K.E. Fauria et al. / Earth and Planetary Science Letters 460 (2017) 50–59Fig. 6. Floatation time as a function of pumice volume. Measurements of pumice floatation from this study, Whitham and Sparks (1986), Manville et al. (1998), Risso et al.(2002), and White et al. (2001). Pumice floatation time predictions from this study (Equation (6)) and Vella and Huppert (2007) are also shown. Measured floatation timesfit the trend predicted by Equation (6) (grey bar). Filled symbols represent measured sinking times while open symbols represent projected sinking times.Table 2Floatation time measurements for Santa Maria pumice.τ Sample nameDry weight(g)Estimated volume(cm3 )Floatation time(days)SM F02SM F03SM F05SM F06SM F09SM F10SM F11SM F21SM 8.22.520.1sonicator for four hours and dried the pumice in an oven at 65 Cfor 12 h. We specifically chose a temperature lower than 100 C toensure that we did not break pumice walls during the drying process and used μXRT to confirm that the pumice was dry prior toexperiments. Table 2 shows pumice weights, sizes, and characteristics. While we did not measure the volume of each pumice clast,we estimated volume by assuming porosities of 80% and glass densities of 2.4 g m 3 .To initiate the floatation experiments, we dropped the pumicefrom a height of 4 cm into individual containers of artificial seawater. These containers were covered to prevent evaporation andcontamination. We monitored the pumice with a time lapse camera that could determine when each clast sank to the nearestminute.3.2. Pumice floatation timescaleHere we propose that the diffusion of trapped gas bubbles outof the pumice (and eventually to the atmosphere) causes pumicecontaining trapped gas clusters to sink. We envisage that the diffusion process is analogous to Ostwald ripening where small (andthus higher pressure) trapped gas clusters diffuse into larger clusters and eventually to the atmosphere. If gas diffusion does control pumice buoyancy through time, then pumice floatation timeshould scale like a diffusive process whereL2D eff,(5)and where L is the mean diameter of the pumice, and D eff isthe effective diffusion coefficient. The effective diffusion coefficientfor trapped gas in pumice, as in other porous media, is not justthe gas–liquid diffusion coefficient, but should be weighted by theconnectivity of the porous media (i.e., porosity and partial saturation). From Hunt et al. (2014) we write effective diffusivity asD eff D θ 2 , where θ is water saturation (fraction of pore spacefilled by water) and D is the liquid–gas diffusion coefficient, suchthatτ L2Dθ 2.(6)We test the hypothesis that diffusion of trapped gas out ofpumice allows pumice to sink by comparing experimental measurements of pumice floatation time and volume (Whitham andSparks, 1986; Manville et al., 1998; Risso et al., 2002; White etal., 2001) with Equation (6) and where L V 2/3 (Fig. 6). Becausewe do not know θ for any individual pumice, and because, if ourhypothesis is correct, θ changes through time, we consider Equation (6) with a range of saturation values (8–80%).3.3. Pumice floatation results and model comparisonFig. 6 shows measurements of floatation time and volume (thisstudy and four others) against predictions from Equation (6) andwhere D 1.9 10 5 cm2 s 1 is the air–water diffusion coefficient at room temperature. Experimental measurements of pumicefloatation times generally match predictions from Equation (6)(Fig. 6). We also list pumice floatation times from our experimentsin Table 2.It is worth noting, however, that if pumice are highly nonspherical, then we overestimate the eff
Mechanisms of gas trapping. Illustrations of gas trapping by (a) bypass and (b) snap-off trapping in pumice with connected pores. In both cases capillary forces draw water into pores such that water completely surrounds the gas phase and the gas is unable to escape. Pumice, with porosities of 50 to 90 percent, is a porous medium.