Transcription
SUGGESTIONSFOR CALCULATINGHAROLDReportsofnestingsuccessF.NEST SUCCESSMAYFIELDthat do not take into account the time span ofobservation for each nest usually understate losses, and sometimes the errorcan be very large.More than a decade ago I pointed out this problem andproposed a way of dealing with it (Mayfield1960:192-204;1961).Sincethat time many field students have used the method, and it has proved especially helpful in combining fragments of data from many sources, as inthe North AmericanNest-record Programat Cornell University.However,not every published report shows awareness of the problem, and letters of inquiry have shown that some people are deterred from dealing with it becauseof difficulty with details. Therefore, I offer these further suggestions to simplify the procedure as much as possible.THEPROBLEMAll nests are not found at the very start. Indeed, most nests of small opennesting birds are not found until incubation is well under way or until theyoung have hatched. The observed success in such a sample will be greaterthan the true nesting successof the species.The shorter the time span of observations, the less the observed losses;that is, nest mortality-lossby destruction or desertion-isa function oftime. Since nearly all field studies contain a mixture of nests found earlyand late, as customarily reported they show nesting success higher than reality; but the amount of error is indeterminableentered the sample is not reported.because the time each nestFor precise analysis of mortality and sur-vival, it is not enough merely to count nests, eggs, and young.The elapsedtime of the observations must also be considered.To illustrate the main difficulty, suppose you found a series of nests whenincubation was far advanced. Hatching success would be nearly 100%; andin nests containing large young when found, fledging successwould be nearly100%. Yet you would hesitate to present these figures because it is plain thatnot enough time elapsed for many accidents to befall. In this extreme casethe pitfall is obvious, but in a mixed bag of data, this kind of error may slipthrough unnoticed.What you are trying to determine is the nesting success of a population.Ideally you would like to find all the nests started by the birds in that population, watch all these nests from their beginnings, and observe everythingthat happened up to the fledging of young.Usually this is impossible andyou have to settle for a good deal less, namely, a sample that is anything but456
Mayfield* CALCULATING NEST SUCCESS457neat and complete. Some nests in the population are not found at all, someare not under observation for their full duration-foundnot followed to a conclusion.early, found late, orWhat do you do with these incomplete records, which often comprise thelarger part of the data? Customarily, some aspects of the problem are ignored. Nests found late are lumped with nests found early and consideredalike. The result is to understate mortality and overstate success, as mentioned earlier.Not everyone dodges the issue. In his study of the Yellowhammer (Emberiza citrinella) , Peakall (1960) used only the subsample of nests observedfrom the very start.But this course brings 3 objections:First, very fewfield studies contain enough nests found before incubation began;second,the nests disqualified contain valuable information that should be used ifpossible; and third, the subsample of nests found earliest may not be typical.Perhaps they were easier to find because of their locations or because thevegetation concealing them was not yet far advancd.In some elusive species the eggs and young may be found almost at randomtimes throughout the duration of the nesting cycle. If so, the average periodof observation is about half the duration of the nesting cycle, and the observedlosses are about half the true losses. Coulson (1956) recognized this fact inhis study of the Meadow Pipit (Anthus pratemis) and corrected the observedfigures by doubling the known losses.Up to this point I have discussed nests not observed from the start, butwhat of nests not followed to a conclusion ? At one extreme there is the caseof an ornithologist whose field records each year did not begin until he arrived at his summer cottage after the close of the school term, and at theother extreme are the members of expeditions and the vacationers who areobliged to leave a region while some nests are still active. Samples containingthe work of many years are likely to contain records of both kinds.Customarily,I suspect, nests with outcomes unknownare excluded fromsamples used in calculating success. Yet, this too is regrettable, because ittends to exaggerate losses. That is, a nest lost early becomes a part of therecord, whereas a nest that persists is thrown out.Finally, the sorriest data are those on nests whose beginnings are shroudedin doubt and whose outcomes are also unknown.These are certain to bediscarded in calculations of success. The effect on the sample is uncertain,but any loss of data is regrettable and any discards may introduce bias.No field student is happy to see a simple concept like nesting success madeto appear complicated.Yet everyone who has undertakena nesting studyknows that his own data embody not only hard facts but also elements ofjudgment that might have been handled differently by another worker.None
458THE WILSON BULLETIN - Vol. 87, 1vo. 4, December 1975of this difficulty is apparent in published tables of figures, which conveyan air of indisputable finality.A review of nest success in altricial birds by Nice (1957) is widely quoted.examined about half the 35 summarizedYet Woolfenden and Rohwer (1969)studies of open-nesting birds included;tell how he dealt with these difficulties.in not one did the original authorRicklefs (1969) offered a sophisti-cated analysis of mortality in small altricial birds but threw up his hands attrying to disentangle these tissues in published studies, and treated all nestsas if “found before the initiation of laying.”It is true that nests of some species are more likely to be found duringthe building stage than during incubation, and some field workers-notably,the oologists-areparticularlyadept at findingnests before the eggs arelaid, but these circumstances are not universal. My own experience in thefield and consultations with others about their data lead me to suspect thatraw data on species with hard-to-find nests commonly reveal a mortality onlya little more than half the true mortality.This problem needs to be dealtwith in one way or another.In this whole discussion I emphasize small open-nesting birds, becausethe problem of finding nests early is much more acute in such species than inthose nesting in boxes or other predetermined sites.A SOLUTIONThere is a straightforwardway of dealing with these problems that makesuse of nearly every bit of data collected. In principle it treats nests in termsof mortality and survival over observed periods of time. Survival is the converse of mortality.abilities.For mathematical elegance, we deal with both as prob-Nest success may be viewed in 5 stages: (1) survival during the building of the nest; (2) survival during the egg-laying period; (3) survival during incubation;(4)hatching of eggs, which is assumed to take place at apoint in time when the first young bird breaks free of the shell; (5) survival of young to fledging. Bere I will focus attention on the last 3 stages.The number of observed losses will depend on the number of nests in thesample and the amount of time each nest is under observation-thatis, theA convenient unit for measuring exposure is the nest-day (oneexposure.nest for one day).For example, 2 nests both under observation for periodsspanning 6 days represent an observed exposure of 12 nest-days; this isequivalent to 3 nests observed for 4 days or one nest for 12 days. The timespan is the crucial factor even though the nest was not actually visited on allthe days in it. By dividing the total number of losses by the total numberof nest-days, you get the mortalityperiod.and survival rates (probability)for any
Mayfield* CALCULATINGNESTFor the greatest precision by this method,SUCCESSif your459sample were largeenough, you might calculate a separate survival rate for each day of eachstage, and compute the probability of survival for n days by the productP1PzPa . . . P,, where Pr is the probabilityprobabilityday n.of survival on day 1, Pz is theof survival on day 2, and P, is the probabilityHowever,of survival onvery few studies will have samples of sufficient size toyield a reliable separate rate for each day.So, if losses do not bunch upearly or late in any stage, the practical course is to calculate an averagemortality and survival rate across each stage of the nest. Since the conditionsat the nest are usually different for each stage, we would expect to find, forexample, a survival rate during incubation different from the survival rateduring the nestling stage,Here is an example.kirtlandii)In my study of the Kirtland’sWarbler(Dendroica1960 :193) , 35 nests were lost during 878 nest-days of(Mayfieldincubation, and the mortalitywas therefore 35/878 .040 per nest-day.Ifso, the survival rate was 1 - .040 .960 per nest-day. Now we can use whatwe have learned from the entire sample to predict the probabilityof suc-cess for a nest through the full 14 days of incubation. Since the probability ofsuccessive events is the product of their probabilities, the probability a nestwill survive 14 days is .960 multiplied by itself 14 times, or .96014 .56.In raising decimals to high powers, it is best to use as many decimal pointsas practical at each step, because repeated rounding off of decimals will causeerrors to pyramid.In calculating nest success-definednest-youas the survival of any contents of theignore partial losses through the failure of some but not all eggsto survive and hatch, and proceed immediately to the nestling period, whichyou handle in the same way. For example, in the Kirtland’s Warbler (Mayfield 1960:198)in 735 nest-days with young in the nest, 22 nests were lost.So the mortality rate was 22/735 .030 per nest-day, and the probabilitysurvival was 1 - .030 .970 per nest-day.9 days, the probabilityCombiningofHence, with a nestling period ofof survival of a nest with young was .970s .76.these probabilities,we have the probabilityof survival of anest from the start of incubation to the fledging of young, .56 x .76 .43.Note that nest success is usually somewhat larger than egg success, becausesome eggs do not hatch and some eggs and young are lost from nests whosecontents otherwise remain intact.A separate calculation gives the hatching rate-thepresent at hatching time actually produce living young.probabilityof young by the number of eggs present just before hatching.Warblers(Mayfield1960:197)this probabilityeggs present at hatching time did not hatch.that eggsDivide the numberIn Kirtland’swas .73; that is, 27% of the
THE460WILSONBULLETIN* Vol. 87, No. 4, December 1975If there are no significant losses of eggs or young without the loss of entirenests, the 3 probabilities calculated in the previous paragraphs may he combined to arrive at the probabilityan egg present at the start of incubationwill produce a fledgling. We multiply the probability an egg will survive theincubation period, by the probability an egg will hatch, by the probability ayoung bird will survive the nestling period;thus, .56 X .73 X .76 .31.In some species a considerable number of eggs or young may vanish fromnests that are not lost totally. If so, the probability of these events must besuperimposed on the previous calculations. The principle is the same, butnow it is necessary to introduce a smaller unit of exposure, the egg-day orthe nestling-day.That is, a nest with 5 eggs observed for one day has an ex-posure of 5 egg-days.Similarly,nestling.daysmeasure the exposure ofyoung in the nest. Note that when more than one egg or nestling is in thenest, the exposure in egg-days or nestling-days is much larger than whenmeasured in nest-days, and for nests not suffering internal variations,it isa multiple of the number of nest-days.The total number of individual eggs lost without the loss of all eggs in theclutch divided by the total number of egg-days gives the mortality per eggday. For example, in the Kirtland’s Warbler I noted 6 eggs lost individuallyduring incubation where the exposure was 3181 egg-days.(This number wassmall because most eggs removed by cowbirds vanished before incubationbegan.)The mortality was .002 and the survival was .998 per egg-day, andthe probabilityof an egg surviving the incubation period in a persisting nestwas .998r4 .97. A similar calculation may be made for nestlings survivingin persisting nests.Often, as in my example, these categories of loss are very small, or, conversely, the probabilityis very high.of survival of eggs and young in continuingnestsIf so, it is doubtful if this refinement is justified by the limitedaccuracy of the basic data. However, to pursue the example given, if the onlyadjustment to be made is for eggs lost individually,ability by the previously calculated probabilitystart of incubation to fledgingwe multiply this last prob-of survival of nests from the(which ignored losses of individualnestlings) and get a slightly reduced probabilityIf there is also a significant loss of individualeggs andof success; .97 X .31 .30.nestlings, this will call for afurther adjustment downward of the ultimate probabilityof success from thestart of incubation to FFERENT?In the foregoing example I have treated the incubation period separatelyfrom the nestling period (ignoring nest-building and egg-laying stages). Thisstep may not always be necessary. In precocial birds the nestling period
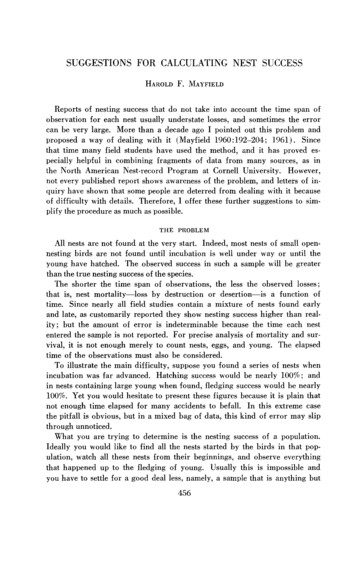
Mayfield * CALCULATINGNESTSUCCESS461TABLE1COMPARISON OF MORTALITY IN INCUBATION AND NESTLING PERIODS OF KIRTLAND’SWARBLER*Nest-dayswith lossesNest-dayswithout lossesTotalnest-daysIncubation lsx2 1.16, P .25* This contingencytable, constructedto appraise by the chi-square test if there is a real difference in mortality between the incubation period and the nestling period, shows that the observed difference might have been expected by chance in about a quarter of samples of this size;i.e., a significant difference is not proven, although a larger sample might show a real differenceto exist.shrinks toward the vanishing point, and in some altricial birds the mortalityin the two periods may not be significantly different.To appraise the difference,we construct a 2X 2 contingency table, asshown in Table 1, and apply the chi-square test. The test reveals the observed difference is not statistically significant for the entire population ata high level of probability.This is plausible because the variants (losses)are relatively small numbers, and chance effects could have a major influenceon the differences.Therefore,on the basis of this sample, the observed dif-ference cannot be taken as virtuallycertain; that is, the difference does notmeet the 1% or 5% test of significance commonly used by statisticians to beassured the difference could be explained on the basis of chance alone in lessthan 1 or 5 times out of 100. However, the difference may still be real.larger sample might increase the confidence level.Changing to a smaller unit--say,nest-hours-mightAseem to hold outpromise of a different result, since it multiplies the sample size without enlarging the losses; but in this instance it still yields a chi-square and probability of the same order, and therefore does not alter the general conclusion.In these circumstances, what are the alternatives?By lumping the 2 stages,you enlarge the sample and increase the confidence in the single mortalityrate across both. Sometimes this is the wise course. Yet, to do so, may maskreal differences that ought to be recognized for some purposes. It would beastonishing to find survival rates identical in the 2 stages, since desertion isusually more prevalent during incubation and predation is usually more likelywhen activity at the nest increases after the hatching of young. The observershould state reasons for whatever course taken.In this example, lumping the stages to get a single rate brings little change
462THEWILSONBULLETIN* Vol. 87, No. 4, December 1975in the final results. The survival rate per day for the entire 23 days of incubation and young is .96466 (instead of .96 and .97 for the respectivestages). Using this rate for both, we find the probability of survival for theincubation period is .60 (instead of .56) ; for the nestling period is .76 (thesame as before) ; for the product of the two is .46 (instead of .43) ; and forthe entire 23 days of both stages considered as a unit is .44. At no point dothe 2 methods give survival probabilities differingSOMEA basic underlyingby more than .04.CAUTIONSassumption of this method is that mortalityis ap-proximately even across each stage. That is, we judge in a particular studythat nests are about as likely to fail early in incubation as late in incubation,and about as likely to fail early in the nestling period as late in the nestlingperiod.For several species I have examined, this appears to be true, but toprove it rigorously would require a very large sample. Lacking this, we mayjudge the distributionof losses approximatelyby inspecting the total lossesfor each day in the nesting cycle, which may be entered at the foot of thecolumn for each day on the worksheet suggested here. A notable concentration of losses anywhere should be apparent.In the Mourning Dove (Zenaida macroura),often exposed nest, Woolfenden and Rohwerwhich builds a flimsy and(1969:38)found losses withinthe incubation period much more likely to occur near the beginning.So aflat mortality rate across the incubation period proved inappropriate for analysis of this portion of the nesting cycle.The unit of time suggested here is one day, because nests are commonlyvisited on a daily schedule and recorded by days.Manyobservers avoidvisiting a nest more often than once a day lest they interfere with its normalexpressed concern about visits even this freprogress. Skutch (1966:5)quent and saw here an objection to the use of this method.Intuitively one feels some predators may follow human beings to bird nests,but it is also possible some predators may be repelled by the presence or scentof people-asfur trappers tend to believe. In any case, we are faced with akind of biological “uncertaintyprinciple”whereby any nest observed is nolonger in its natural state.Willis found a way to compare survival rates of visited and unvisited nestsof Bicolored AntbirdsIsland, Panama.(Gymnopithys bicolor) in the forest of Barro ColoradoApplying his test, he found “survivalrates of visited andunvisited nests are very similar” (Willis 1973 :264).However, daily visits are not a cornerstone of this method.Rather, thekey concept is the time span of observations, which may be measured eventhough days may be missing from the record. The emphasis here is not onthe way informationis gathered but on the way it is used after it is collected.
THE464WILSONBULLETIN* Vol. 87, nio. 4, December 1975TABLE3SAMPLE ENTRIES IN lingdaysNestno.--7Sl4/l555555555510508. Record complete.73-Z3/z543333333310339. Partial loss.444400 I 2 3 474-5 5 6 7 8 9 lO 11 12NestdaysSIDE3%14comment10. Age estimated.11. Total losses bydays.There is nothing magic about a day as a unit.recordingof events in the nest, a half-dayConceivably, with automaticor an hour might suit specialpurposes. However, we should be wary of being lured into a fictitious appearance of precision.proximationAny method we use will give no more than an ap-of the truth, and this method merely helps avoid certain grosserrors that are common. In birds with very long nesting periods and widelyspaced visits, time units larger than one day may be suitable. By using thelargest practical unit, we minimize the pyramidingof small errors when rais-ing inexact numbers to high powers.In addition to matters treated here, there are many problems that are notcircumvented by mathematics. In samples of modest size, stochastic variablesmay be importantand seriously interfere with generalization to larger pop-ulations. Fortuitous influences may vary from year to year and place to place-predation,competition, weather, sex ratios, and so on.WORKSHEETYou will simplifyworksheet.analysis if you enter all your nest data on one largeI prefer to use ruled ledger paper, splicing sheets together to anydesired width and length.For hundreds of nests the sheet may be so longit must be rolled like a scroll or folded like a computer printout.Table 2 illustratestion),the left portionof such a sheet (egg-layingand incuba-and Table 3 illustrates the right portion of the same sheet. A “Cornment” column is useful for noting special circumstances when entering dataon the sheet, but I have used it here to identifyselected for illustration.some common problemsIn this example I focus on the nest stages from thestart of incubation to the fledging of young.Similar attention may be givento nest-building and egg-laying stages if the samples are large enough.
Mayfield1. Gap in record.* CALCULATINGNest 73-lNEST(code designates465SUCCESSnest No. 1 of 1973)was not visitedfora period of 5 days, but this did not detractfrom the record in any way, since no changein nest contentsOn handwrittenoccurredin the interval.to circle all numbers representingnot observed.2. StartNest 73-2was foundpositioned on the table after the hatching3. Nestdestroyed.was empty.NestDestructionvisits, namely,73-3duringto haveand these entriesbetweenday -11If the gap in observationsand day -7,midwaybetweenhad been betweenwould have been day -91/2, and this would be takendate is not preciselyearlier,incubation,occurrednest-day and egg-day entries at left, where fractionsfailurebut not enoughloss rate is constant,it is convenientat the midpointto makepresentbetweenan appreciablethe numericalintervalalwayswhenlastday -11ittwoand dayinto account in theThe estimated2 observations;differencewilltheno difficuties.theit is a little(Iftheand thereforethefor these purposes.size of the losses declinesmean age of those lost in any timewereday was determined.was not visitedis assumedon day -9.-8, the midpointworksheetseggs.steadily,be less thanthe mean pointinthe interval. 14. Nest deserted.Nest 74-lit was visited on day -11.was not attendedDesertionsince the nest was active the previousthe observer an inklingarbitraryrule.5. Humanday -9,Theobserver’sdisturbance.day.judgmentNest 74-4may be excludedthe outcome,on the day when notedAn extra visit or some other clue oftenmightto experimentalas a result.periodThisbut disqualifiedfor any humansuch as a gross alterationthat is bettergivesthananyplace this loss at day -11%.was subjecteddesertedfor 4 days of its observedall of a recordaffectand the eggs were cold whenabout the time at which the loss occurredand the nest was promptlythe sampleby adultsis assumed to have n the environment,of eggs onwas admittedtoA portionseriousorenoughphotography,toor otherdisruptions.6.Start and74-3outcomeare segregatedunknown.Because of theirso they do not figureon 6 successive days, which constituterecordcannotbe used in analysisas a part of totalexposuretion may be judged7. SingleNestshow observationsnot usefulfor recordsremainingWithonlyto specificandwas visitedAlthoughthisdays, it can be usedsome species the extentonce and thereforeof observationof incuba-day.by at least 24 hours, to constituteand survival.appearis excludeddoes not cover a fullonly once may provideof mortalityexamplesnests 74-2Nest 74-2of the eggs, but this is not always feasible.on 2 days, separatedA nest visitedchronology,by days.span of 5 days observation.incubation.was visitedbecause the perioda day or more.Theduring74-3a timeof events attributedby examinationvisit.calculationsunknownin any totalson TableThedata for otherexposure3, representinga timepurposes,in nest-daysthefromEntriesrighthandallmustspan ofbutit isis zero.sideof theuntilfoundworksheet.8. Recordcomplete.empty on day ll.youngin thisfledglingsNest 73-1,Fledgingappearingalso in Table2, remainedmay be assumed even thoughspecies sometimesleaves theintactthe young are not seen, sincenest as earlyas day 9.Findingafter they have been out of the nest a few hours is very difficultcies and unnecessary9. Partialfor this purpose, whereloss. Nest 73-2the nest endured,and the remainderdays was not affectedLosses of individualthe lefthandportionattentionis on survivallost one young bird on day 2of the young fledgedby the losses, buteggs fromcontinuingof the worksheet.thenumbernests wouldfor a statedand anothernormally.be treatedreflectedsimilarlytheperiod.on day 3,The numberof nestling-daysallin some spebutof nestthem.in Table2,
THE466WILSONBULLETIN* Vol. 87, No. 4, December 197510. Age estimated. Nest 74-5 was found after hatching and destroyed before fledging,but an experienced observer can position the nest approximately in the table at his firstinspection of the young.11. Total losses by days. At the bottom of each column representing a day in the nesting cycle, you enter the number of nests last that day. It helps the eye catch these lossesin a large and intricate table if conspicuous red marks are made in the body of the tableat points when losses are believed to have occurred. The totals for the columns show thedistribution of mortality by days.SUMMARYIn field studies of nesting birds, many nests are not found at the very beginning or arenot followed to a conclusion. When nests are not under observation for their full duration, the observed loss rates are less than the actual rates of the species. The amountof error varies according to the total exposure of all nests not spanned by human observation in the sample. A way of incorporating the time span of observations is to measure the exposure in nest-days, and calculate mortality and survival rates in these unitsat each stage of the nesting cycle. This method allows pieces of data to be used thatwould be discarded in customary analyses. A suggested worksheet simplifies analysis,and illustrations answer some questions that troubled users of this method.ACKNOWLEDGMENTSDavid B. Peakall and Clara Dixon were kind enough to read and comment on an earlier draft of this paper.LITERATURECITED1956. Mortality and egg production of the Meadow Pipit with specialreference to altitude. Bird Study 3:119-132.MAYFIELD, H. F. 1960. The Kirtland’s Warbler. Cranbrook Inst. Sci., Bloomfield Hills,Mich.1961. Nesting success calculated from exposure. Wilson Bull. 73:255-261.y.NICE, M. M. 1957. Nesting success in altricial birds. Auk 74:305-321.PEAKALL, D. B. 1960. Nest records of the Yellowhammer.Bird Study 7:94-102.RICKLEFS, R. E. 1969. An analysis of nesting mortality in birds. Smithsonian Contributions to Biology, No. 9, Washington.SKUTCH, A. F.1966. A breeding bird census and nesting success in Central America.Ibis 108: 1-16.WILLIS, E. 0.1973. Survival rates for visited and unvisited nests of Bicolored Antbirds.Auk 90 :263-267.WOOLFENDEN, G. E. AND S. A. ROHWER.1969. Breeding birds in a Florida suburb.Bull. Fla. State Mus. Biol. Ser. 13:1-83.COULSON, J. 5.
A review of nest success in altricial birds by Nice (1957) is widely quoted. Yet Woolfenden and Rohwer (1969) examined about half the 35 summarized studies of open-nesting birds included; in not one did the original author . errors to pyramid. In calculating nest success-defined as the survival of any contents of the