Transcription
Volume 66, Number 3April 11, 2017United States Life Tables, 2013by Elizabeth Arias, Ph.D., Melonie Heron, Ph.D., and Jiaquan Xu, M.D., Division of Vital StatisticsAbstractObjectives—This report presents complete period life tables forthe United States by race, Hispanic origin, and sex, based on agespecific death rates in 2013.Methods—Data used to prepare the 2013 life tables are 2013final mortality statistics; July 1, 2013 population estimates basedon the 2010 decennial census; and 2013 Medicare data for personsaged 66–99. The methodology used to estimate the 2013 life tableswas first implemented with data year 2008. The methodology usedto estimate the life tables for the Hispanic population remainsunchanged from that developed for the publication of life tables byHispanic origin for data year 2006.Results—In 2013, the overall expectation of life at birth was78.8 years, unchanged from 2012. Between 2012 and 2013,life expectancy at birth remained the same for both males (76.4)and females (81.2), for the black population (75.5), the Hispanicpopulation (81.9), and the non-Hispanic black population (75.1). Lifeexpectancy at birth declined for both the white population (79.1 to79.0) and the non-Hispanic white population (78.9 to 78.8).Keywords: life expectancy survival death rates race HispanicoriginIntroductionThere are two types of life tables: the cohort (or generation)life table and the period (or current) life table. The cohort life tablepresents the mortality experience of a particular birth cohort—allpersons born in the year 1900, for example—from the moment ofbirth through consecutive ages in successive calendar years. Basedon age-specific death rates observed through consecutive calendaryears, the cohort life table reflects the mortality experience of anactual cohort from birth until no lives remain in the group. To preparejust a single complete cohort life table requires data over many years.It is usually not feasible to construct cohort life tables entirely on thebasis of observed data for real cohorts due to data unavailability orincompleteness (1). For example, a life table representation of themortality experience of a cohort of persons born in 1970 wouldrequire the use of data projection techniques to estimate deaths intothe future (2,3).Unlike the cohort life table, the period life table does not representthe mortality experience of an actual birth cohort. Rather, the periodlife table presents what would happen to a hypothetical cohort if itexperienced throughout its entire life the mortality conditions of aparticular period in time. For example, a period life table for 2013assumes a hypothetical cohort that is subject throughout its lifetimeto the age-specific death rates prevailing for the actual population in2013. The period life table may thus be characterized as renderinga “snapshot” of current mortality experience and shows the longrange implications of a set of age-specific death rates that prevailedin a given year. In this report, the term “life table” refers only to theperiod life table and not to the cohort life table.Life tables can be classified in two ways according to the lengthof the age interval in which data are presented. A complete life tablecontains data for every single year of age. An abridged life tabletypically contains data by 5- or 10-year age intervals. A complete lifetable can be aggregated into 5- or 10-year age groups (refer to theTechnical Notes at the end of this report for instructions). Other thanthe decennial life tables, U.S. life tables based on data prior to 1997are abridged life tables constructed by reference to a standard table(4). This report presents complete period life tables by race, Hispanicorigin, and sex.Data and MethodsThe data used to prepare the U.S. life tables for 2013 arefinal numbers of deaths for the year 2013; July 1, 2013 populationestimates based on the 2010 decennial census; and age-specificdeath and population counts for Medicare beneficiaries aged66–99 for the year 2013 from the Centers for Medicare & MedicaidServices. Data from the Medicare program are used to supplementvital statistics and census data for ages 66 and over. The U.S. lifetables by Hispanic origin are based on death rates that have beenadjusted for race and ethnicity misclassification on death certificatesusing classification ratios (or correction factors) generated from anupdated evaluation of race and Hispanic-origin misclassification
2National Vital Statistics Reports, Vol. 66, No. 3, April 11, 2017on death certificates in the United States (5). (See Technical Notesfor a detailed description of the data sets and methodology used toestimate Hispanic-origin life tables.)Expectation of lifeThe most frequently used life table statistic is life expectancy (ex),which is the average number of years of life remaining for personswho have attained a given age (x). Life expectancy and other lifetable values for each age in 2013 are shown for the total populationby race, Hispanic origin, and sex in Tables 1–18. Life expectancy issummarized by age, race, Hispanic origin, and sex in Table A.Life expectancy at birth (e0) for 2013 for the total populationwas 78.8 years. This represents the average number of years thatthe members of the hypothetical life table cohort can expect to live atthe time of birth (Table A).Survivors to specified agesAnother way to assess the longevity of the period life tablecohort is to determine the proportion that survives to specified ages.The lx column of the life table provides the data for computing thisproportion. Table B summarizes the number of survivors by age,race, Hispanic origin, and sex. To illustrate, 57,879 persons outof the original 2013 hypothetical life table cohort of 100,000 (or57.9%) were alive at exact age 80. In other words, the probability thata person will survive from birth to age 80, given 2013 age-specificmortality, is 57.9%. Probabilities of survival can be calculated atany age by dividing the number of survivors at the terminal ageby the number at the beginning age. For example, to calculate theprobability of surviving from age 20 to age 85, one would divide thenumber of survivors at age 85 (42,192) by the number of survivorsat age 20 (98,953), which results in a 42.6% probability of survival.Explanation of the columns of the life tableColumn 1. Age (between x and x 1)—Shows the age intervalbetween the two exact ages indicated. For instance, “20–21” meansthe 1-year interval between the 20th and 21st birthdays.Column 2. Probability of dying (qx )—Shows the probability ofdying between ages x and x 1. For example, for males in the ageinterval 20–21 years, the probability of dying is 0.001024 (Table 2).This column forms the basis of the life table; all subsequent columnsare derived from it.Column 3. Number surviving (lx )—Shows the number of personsfrom the original hypothetical cohort of 100,000 live births whosurvive to the beginning of each age interval. The lx values arecomputed from the qx values, which are successively applied to theremainder of the original 100,000 persons still alive at the beginningof each age interval. Thus, out of 100,000 female babies born alive,99,524 will complete the first year of life and enter the second;99,322 will reach age 10; 99,132 will reach age 20; and 48,940 willlive to age 85 (Table 3).Column 4. Number dying (dx )—Shows the number dying ineach successive age interval out of the original 100,000 live births.For example, out of 100,000 males born alive, 651 will die in the firstyear of life; 101 between ages 20 and 21; and 1,023 after reachingage 100 (Table 2). Each figure in column 4 is the difference betweentwo successive figures in column 3.Column 5. Person-years lived (Lx )—Shows the number ofperson-years lived by the hypothetical life table cohort within an ageinterval x to x 1. Each figure in column 5 represents the total time(in years) lived between two indicated birthdays by all those reachingthe earlier birthday. Thus, the figure 98,733 for males in the ageinterval 20–21 is the total number of years lived between the 20thand 21st birthdays by the 98,784 males (column 3) who reachedtheir 20th birthday out of 100,000 males born alive (Table 2).Column 6. Total number of person-years lived (Tx )—Shows thetotal number of person-years that would be lived after the beginningof the age interval x to x 1 by the hypothetical life table cohort. Forexample, the figure 5,658,717 is the total number of years lived afterattaining age 20 by the 98,784 males reaching that age (Table 2).Column 7. Expectation of life (ex )—The expectation of life atany given age is the average number of years remaining to be livedby those surviving to that age, based on a given set of age-specificrates of dying. It is derived by dividing the total person-years thatwould be lived beyond age x by the number of persons who survivedto that age interval (Tx / lx). Thus, the average remaining lifetime formales who reach age 20 is 57.3 years (5,658,717 divided by 98,784)(Table 2).ResultsLife expectancy in the United StatesTables 1–18 show complete life tables for 2013 by race(white and black), Hispanic origin, and sex. Table A summarizes lifeexpectancy by age, race, Hispanic origin, and sex. Life expectancy atbirth for 2013 represents the average number of years that a groupof infants would live if they were to experience throughout life theage-specific death rates prevailing in 2013. In 2013, life expectancyat birth was 78.8 years, which was unchanged from 2012.Changes in mortality levels by age and cause of death canhave a major effect on changes in life expectancy. While changes incauses of death occurred between 2012 and 2013, life expectancyat birth for the total population did not change. Decreases in mortalityfrom cancer, homicide, stroke, and heart disease were offset byincreases in mortality from Influenza and pneumonia, chronic lowerrespiratory diseases, Septicemia, and unintentional injuries (6). Lifeexpectancy at birth for both males and females did not changebetween 2012 and 2013. For males, decreases in mortality fromcancer, homicide, Alzheimer’s disease, and stroke were offset byincreases in mortality from Influenza and pneumonia, hypertension,Chronic liver disease and cirrhosis, and Septicemia. Similarly for thefemale population, decreases in mortality for cancer, heart disease,stroke, and Congenital malformations were offset by increases inmortality from Influenza and pneumonia, Chronic lower respiratorydiseases, Septicemia, and perinatal conditions (6).The difference in life expectancy between the sexes was4.8 years in 2013, unchanged from the difference in 2012. From1900 to 1975, the difference in life expectancy between the sexesincreased from 2.0 years to 7.8 years (Table 19). The increasing gapduring these years is attributed to increases in male mortality dueto ischemic heart disease and lung cancer, both of which increased
Table A. Expectation of life, by race, Hispanic origin, age, and sex: United States, 2013All races and originsWhiteHispanic1BlackNon-Hispanic white1Non-Hispanic maleTotalMaleFemaleTotalMaleFemaleTotalMaleFemale0 .1 .5 .10 . . . . . . . . . . . . . . . .15 . . . . . . . . . . . . . . . .20 . . . . . . . . . . . . . . . .25 . . . . . . . . . . . . . . . .30 . . . . . . . . . . . . . . . .35 . . . . . . . . . . . . . . . .40 . . . . . . . . . . . . . . . .45 . . . . . . . . . . . . . . . .50 . . . . . . . . . . . . . . . .55 . . . . . . . . . . . . . . . .60 . . . . . . . . . . . . . . . .65 . . . . . . . . . . . . . . . .70 . . . . . . . . . . . . . . . .75 . . . . . . . . . . . . . . . .80 . . . . . . . . . . . . . . . .85 . . . . . . . . . . . . . . . .90 . . . . . . . . . . . . . . . .95 . . . . . . . . . . . . . . . .100 . . . . . . . . . . . . . . fe tables by Hispanic origin are based on death rates that have been adjusted for race and ethnicity misclassification on death certificates. Updated classification ratios were applied; see Technical Notes.SOURCE: NCHS, National Vital Statistics System, Mortality.National Vital Statistics Reports, Vol. 66, No. 3, April 11, 20173
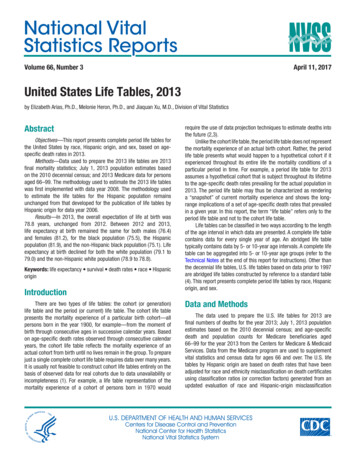
4National Vital Statistics Reports, Vol. 66, No. 3, April 11, 2017Among the four race-sex groups (Figure 1), white femalescontinued to have the highest life expectancy at birth (81.4 years),followed by black females (78.4), white males (76.7), and blackmales (72.3). Between 2012 and 2013, life expectancy remainedunchanged for black males (72.3) and black females (78.4). Blackmales experienced a decline in life expectancy every year for1984–1989 (8), followed by annual increases in 1990–1992 and1994–2012. Between 2012 and 2013, life expectancy remainedunchanged for white males (76.7) and white females (81.4). Overall,gains in life expectancy between 1980 and 2013 were 8.5 years forblack males, 6.0 years for white males, 5.9 years for black females,and 3.3 years for white females (Table 19).largely as the result of men’s early and widespread adoption ofcigarette smoking (7,8). Between 1979 and 2010, the difference inlife expectancy between the sexes narrowed from 7.8 years to 4.8years (Table 19). The general decline in the sex difference since 1979reflects proportionately greater increases in lung cancer mortality forwomen than for men and proportionately larger decreases in heartdisease mortality among men (7,8).The 2013 life table may be used to compare life expectancy atany age from birth onward. On the basis of mortality experienced in2013, a person aged 65 could expect to live an average of 19.3 moreyears, for a total of 84.3 years; a person aged 85 could expect to livean additional 6.6 years, for a total of 91.6 years; and a person aged100 could expect to live an additional 2.3 years, on average (Table A).Life expectancy by Hispanic originLife expectancy by raceBetween 2012 and 2013, life expectancy remained unchangedfor the non-Hispanic black population (75.1) and the Hispanicpopulation (81.9). It declined by 0.1 year for the non-Hispanic whitepopulation (from 78.9 to 78.8) (Table 19). In 2013, the Hispanicpopulation had a life expectancy advantage at birth of 3.1 yearsover the non-Hispanic white population and 6.8 years over the nonHispanic black population. The U.S. life tables by Hispanic origin arebased on death rates that have been adjusted for race and ethnicitymisclassification on death certificates (see Technical Notes for adetailed description of the methodology).Between 2012 and 2013, life expectancy remained unchangedat 75.5 years for the black population and declined by 0.1 year from79.1 to 79.0 years for the white population (Table 19). The differencein life expectancy between the white and black populations was3.5 years in 2013, a historically record low level. The white-blackdifference in life expectancy narrowed from 14.6 years in 1900 to 5.7years in 1982, but it increased to 7.1 years in 1993 before beginningto decline again in 1994 (Table 19). The increase in the gap from1983 to 1993 was largely the result of increases in mortality amongthe black male population due to HIV infection and homicide (8).8580White femaleAge (years)75Black femaleWhite male70Black male656001970197419781982198619901994SOURCE: NCHS, National Vital Statistics System, Mortality.Figure 1. Life expectancy at birth, by race and sex: United States, 1970–201319982002200620102013
National Vital Statistics Reports, Vol. 66, No. 3, April 11, 2017Among the six Hispanic-origin race-sex groups (Figure 2),Hispanic females continued to have the highest life expectancy atbirth (84.2 years), followed by non-Hispanic white females (81.2),Hispanic males (79.2), non-Hispanic black females (78.1), nonHispanic white males (76.5), and non-Hispanic black males (71.9).The smallest difference is between Hispanic males and non-Hispanicblack females, with Hispanic males having an advantage of 1.1years. The largest difference is between Hispanic females and nonHispanic black males, with Hispanic females having a life expectancyat birth 12.3 years greater.The Hispanic mortality advantage is also evident in the effectproduced on life expectancy at birth when race and Hispanic originare considered separately. Until 2006, U.S. life tables were producedonly by race (white and black), irrespective of Hispanic origin. Whenthe Hispanic population is excluded from the two race groups andonly the non-Hispanic black and non-Hispanic white populationsare included, life expectancy at birth declines. For example, for theblack population, irrespective of Hispanic origin, life expectancy atbirth was 75.5 years in 2013 but was 75.1 years when only the nonHispanic segment of the black population was included. Similarly, lifeexpectancy for the white population, irrespective of Hispanic origin,was 79.0 years in 2013, but was 78.8 years when only the nonHispanic segment of the white population was included. The effectof the Hispanic mortality advantage on race-specific life expectancywas also observed for each race-sex group. (See Technical Notesfor a detailed description of the methodology used to estimate theHispanic-origin life tables.)Survivorship in the United StatesTable B summarizes the number of survivors out of 100,000persons born alive (lx) by age, race, Hispanic origin, and sex for2013. Table 20 shows trends in survivorship from 1900 to 2013. In2013, 99.4% of all infants born in the United States survived thefirst year of life. In contrast, 87.6% of infants born in 1900 survivedthe first year. Of the 2013 period life table cohort, 57.9% survivedto age 80 and 2.0% survived to age 100. In 1900, 13.5% of thelife table cohort survived to age 80 and 0.03% survived to age 100(Table 20). The U.S. life tables by Hispanic origin are based on deathrates that have been adjusted for race and ethnicity misclassificationon death certificates (see Technical Notes for a detailed descriptionof the methodology).Survivorship by raceAmong the four race-sex groups, white females have thehighest median age at death, with about 52.7% surviving to age 84(Tables 4–9). Of the original hypothetical cohort of 100,000 infantwhite females, 99.2% survive to age 20, 88.5% survive to age 65,and 49.2% survive to age 85 (Table 6). White males have slightlyhigher survival rates than black females at the younger ages, with98.9% surviving to age 20 compared with 98.5% of black females(Tables 5 and 9). At the older ages, however, black female survivalsurpasses white male survival. By age 85, white male survival is35.6% compared with 41.5% for black females. The median age atdeath for black males is close to 76 years, about 8 years less than85Hispanic female84.282.9Non-Hispanic white femaleAge (years)807580.6Hispanic male77.5Non-Hispanic black female76.475.7Non-Hispanic white maleNon-Hispanic black 102011SOURCE: NCHS, National Vital Statistics System, Mortality.Figure 2. Life expectancy at birth, by Hispanic origin, race, and sex: United States, 2006–201320122013
AgeTotalMale0 . . . . . . . . . . . . . . . . 100,000 100,0001 . . . . . . . . . . . . . . . . 99,404 99,3495 . . . . . . . . . . . . . . . . 99,303 99,23510 . . . . . . . . . . . . . . . . 99,244 99,17015 . . . . . . . . . . . . . . . . 99,174 99,09020 . . . . . . . . . . . . . . . . 98,953 98,78425 . . . . . . . . . . . . . . . . 98,542 98,18930 . . . . . . . . . . . . . . . . 98,062 97,51835 . . . . . . . . . . . . . . . . 97,500 96,77040 . . . . . . . . . . . . . . . . 96,811 95,90645 . . . . . . . . . . . . . . . . 95,848 94,73450 . . . . . . . . . . . . . . . . 94,352 92,92555 . . . . . . . . . . . . . . . . 92,062 90,13660 . . . . . . . . . . . . . . . . 88,788 86,09465 . . . . . . . . . . . . . . . . 84,343 80,66870 . . . . . . . . . . . . . . . . 78,308 73,65675 . . . . . . . . . . . . . . . . 69,764 64,05080 . . . . . . . . . . . . . . . . 57,879 51,25285 . . . . . . . . . . . . . . . . 42,192 35,21490 . . . . . . . . . . . . . . . . 24,208 18,21395 . . . . . . . . . . . . . . . .9,2995,973100 . . . . . . . . . . . . . . WhiteTotalMale100,000 100,00099,494 99,44199,401 99,33799,348 99,27799,279 99,20099,069 98,91698,672 98,35198,207 97,70797,660 96,98496,988 96,14896,047 95,00194,587 93,23192,344 90,48389,170 86,55984,858 81,30878,882 74,38670,341 64,79958,373 51,91242,493 35,63724,283 0 100,00099,500 99,46499,418 99,37599,373 99,32799,311 99,26299,139 99,03098,831 98,59498,483 98,10098,093 97,57597,615 96,94196,946 96,08395,855 94,72294,152 92,58291,650 89,38288,036 84,82383,135 78,70476,101 70,14065,892 58,72851,524 43,36133,327 25,40115,489 10,0364,3562,229Non-Hispanic ale100,000 100,00099,495 99,43899,401 99,32399,345 99,25499,278 99,17099,062 98,88198,651 98,29798,155 97,61097,564 96,82896,839 95,93295,837 94,71594,314 92,88592,010 90,08088,774 86,10184,419 80,82578,415 73,90969,852 64,34157,872 51,46542,045 35,25423,985 18,1669,0365,7981,837931Life tables by Hispanic origin are based on death rates that have been adjusted for race and ethnicity misclassification on death certificates. Updated classification ratios were applied; see Technical Notes.SOURCE: NCHS, National Vital Statistics System, n-Hispanic black1TotalMale100,000 100,00098,889 98,80398,728 98,64298,636 98,55298,543 98,45198,214 97,95297,611 97,03696,897 96,00396,053 94,84494,985 93,46393,576 91,75091,466 89,23288,295 85,49483,586 79,74977,230 71,96069,458 62,81359,531 51,60847,412 38,67833,260 25,00918,993 611,0923,309National Vital Statistics Reports, Vol. 66, No. 3, April 11, 2017All races and origins6Table B. Number of survivors out of 100,000 born alive, by race, Hispanic origin, age, and sex: United States, 2013
7National Vital Statistics Reports, Vol. 66, No. 3, April 11, 2017that for white females (Table 8). Among black males, 98.0% surviveto age 20, 72.7% to age 65, and 25.7% to age 85. By age 100, thereis very little difference between the white and black populations interms of survival. Around 1% of white and black males and around3% of white and black females survive to age 100.Survivorship by Hispanic originIn 2013, 99.5% of Hispanic and non-Hispanic white infantssurvived the first year of life, compared with 98.9% of non-Hispanicblack infants (Tables 10–19). Of both the Hispanic and non-Hispanicwhite populations, 99.1% survived to age 20, while 98.2% of thenon-Hispanic black population survived to age 20. By age 65, theHispanic population has a clear survival advantage compared withthe other two populations. Overall, 88.0% of the Hispanic populationsurvived to age 65, compared with 84.4% of the non-Hispanic whiteand 77.2% of the non-Hispanic black populations. The Hispanicsurvival advantage increases with age so that by age 85, 51.5% ofthe Hispanic population has survived, compared with 42.0% of thenon-Hispanic white and 33.3% of the non-Hispanic black populations.Among the six Hispanic-origin race-sex groups, Hispanicfemales had the highest median age at death, with 47.9% survivingto age 88 (Figure 3). The group with the next highest median ageat death is non-Hispanic white females, with 48.7% surviving toage 85. Hispanic males had 49.9% surviving to age 83; followedby non-Hispanic black females, with 49.8% surviving to age 82;non-Hispanic white males, with 48.4% surviving to age 81; andfinally non-Hispanic black males, with 49.2 % surviving to age 76(see Technical Notes).References1.2.3.4.5.6.7.Shryock HS, Siegel JS, Larmon EA. The methods and materials ofdemography, vol 2. U.S. Bureau of the Census. 1973.Moriyama IM, Gustavus SO. Cohort mortality and survivorship:United States death-registration states, 1900–1968. National Centerfor Health Statistics. Vital Health Stat 3(16). 1972. Available from:https://www.cdc.gov/nchs/data/series/sr 03/sr03 016.pdf.Preston SM, Heuveline P, Guillot M. Demography: Measuring andmodeling population processes. Oxford: Blackwell Publishers Ltd.2001.Sirken MG. Comparison of two methods of constructing abridgedlife tables by reference to a “standard” table. National Centerfor Health Statistics. Vital Health Stat 2(4). 1966. Available from:https://www.cdc.gov/nchs/data/series/sr 02/sr02 004.pdf.Arias E, Heron M, Hakes JK. The validity of race and Hispanic-originreporting on death certificates in the United States: An update. NationalCenter for Health Statistics. Vital Health Stat 2(172). 2016. Availablefrom: https://www.cdc.gov/nchs/data/series/sr 02/sr02 172.pdf.Xu JQ, Murphy SL, Kochanek KD, Bastian BA. Deaths: Final datafor 2013. National vital statistics reports; vol 64 no 2. Hyattsville,MD: National Center for Health Statistics. 2016. Available r64 02.pdf.Waldron I. Recent trends in sex mortality ratios for adults in developedcountries. Soc Sci Med 36(4):451–62. 1993.100Hispanic female80Non-Hispanic white femaleHispanic maleNon-Hispanic black femalePercent60Non-Hispanic white male40Non-Hispanic black male20001020SOURCE: NCHS, National Vital Statistics System, Mortality.304050Age (years)6070Figure 3. Percentage surviving, by Hispanic origin, race, age, and sex: United States, 20138090100
8National Vital Statistics Reports, Vol. 66, No. 3, April 11, 20178.Kochanek KD, Maurer JD, Rosenberg HM. Causes of death contributingto changes in life expectancy: United States, 1984–89. National Centerfor Health Statistics. Vital Health Stat 20(23). 1994. Available from:https://www.cdc.gov/nchs/data/series/sr 20/sr20 023.pdf.Anderson RN. Method for constructing complete annual U.S. lifetables. National Center for Health Statistics. Vital Health Stat 2(129).1999. Available from: https://www.cdc.gov/nchs/data/series/sr 02/sr02 129.pdf.Arias E, Rostron BL, Tejada-Vera B. United States life tables, 2005.National vital statistics reports; vol 58 no 10. Hyattsville, MD: NationalCenter for Health Statistics. 2010. Available from: https://www.cdc.gov/nchs/data/nvsr/nvsr58/nvsr58 10.pdf.Arias E. United States life tables, 2008. National vital statistics reports;vol 61 no 3. Hyattsville, MD: National Center for Health Statistics.2012. Available from: https://www.cdc.gov/nchs/data/nvsr/nvsr61/nvsr61 03.pdf.Arias E. United States life tables by Hispanic origin. National Centerfor Health Statistics. Vital Health Stat 2(152). 2010. Available from:https://www.cdc.gov/nchs/data/series/sr 02/sr02 152.pdf.Arias E, Schauman WS, Eschbach K, et al. The validity of race and Hispanicorigin reporting on death certificates in the United States. National Centerfor Health Statistics. Vital Health Stat 2(148). 2008. Available from:https://www.cdc.gov/nchs/data/series/sr 02/sr02 148.pdf.Arias E, Eschbach K, Schauman WS, Backlund EL, Sorlie PD. TheHispanic mortality advantage and ethnic misclassification on US deathcertificates. Am J Public Health 100(Suppl 1):S171–7. 2010.Arias E. United States life tables, 2009. National vital statistics reports;vol 62 no 7. Hyattsville, MD: National Center for Health Statistics.2014. Available from: https://www.cdc.gov/nchs/data/nvsr/nvsr62/nvsr62 07.pdf.Greville TNE, Carlson GA. Estimated average length of life in the deathregistration states. Vital statistics—Special reports 33(9). 1951.Office of Management and Budget. Revisions t
There are two types of life tables: the cohort (or generation) life table and the period (or current) life table. The cohort life table presents the mortality experience of a particular birth cohort—all persons born in the year 1900, for example—from the moment of birth through consecutive ages in successive calendar years. Based