Transcription
NIST Standard Reference Database 71NIST Electron Inelastic-Mean-Free-Path DatabaseVersion 1.2Users' GuidePrepared by:C. J. Powell, Surface and Microanalysis Science DivisionNational Institute of Standards and TechnologyGaithersburg, MD, USAA. Jablonski, Institute of Physical Chemistry,Polish Academy of Sciences, Warsaw, PolandDecember 2010U.S. Department of CommerceNational Institute of Standards and TechnologyStandard Reference Data ProgramGaithersburg, Maryland 20899
The National Institute of Standards and Technology (NIST) uses its best efforts to deliver a highquality copy of the database and to verify that the data contained therein have been selected onthe basis of sound scientific judgment. However, NIST makes no warranties to that effect, andNIST shall not be liable for any damage that may result from errors or omissions in the database.For a literature citation, the database should be viewed as a book published by NIST. Thecitation would therefore be:C. J. Powell and A. Jablonski, NIST Electron Inelastic-Mean-Free-Path Database - Version 1.2,National Institute of Standards and Technology, Gaithersburg, MD (2010). 2010 copyright by the U.S. Secretary of Commerce on behalf of the United States of America.All rights reserved. No part of this database may be reproduced, stored in a retrieval system, ortransmitted, in any form or by any means, electronic, mechanical, photocopying, recording, orotherwise, without the prior written permission of the distributor.Certain trade names and other commercial designations are used in this work for the purpose ofclarity. In no case does such identification imply endorsement by the National Institute ofStandards and Technology nor does it imply that the products or services so identified arenecessarily the best available for the purpose.Microsoft, MS-DOS, Windows 95, Windows 98, Windows NT, Windows 2000,Windows ME, Windows XP, Windows Vista, and Windows 7 are registered trademarksof Microsoft Corporation.ii
ACKNOWLEDGMENTSThe authors wish to thank Mrs. Cheryl W. Levey for testing the database and for editorialassistance.iii
TABLE OF CONTENTSI. INTRODUCTION .1II. GETTING STARTED.2Packet Content .2System Requirements.2Installation.3Removal of the Database .3III. STRUCTURE OF THE PROGRAM.4Main Menu.4IV. RUNNING THE DATABASE PROGRAM .10Starting the Database.10Database (first option of the main menu).10Elements.10Inorganic Compounds.15Organic Compounds .17File Management (second option of the main menu).18Save Created Files .19Delete Files .20Print Files .20Print Figures.21Load Files .22Comparisons (third option of the main menu) .23Inelastic Mean Free Paths from the Database Only.24Inelastic Mean Free Paths from other Sources and theDatabase .25V. UNCERTAINTIES OF CALCULATED, MEASURED, AND PREDICTEDINELASTIC MEAN FREE PATHS.27Consistency of Calculated Inelastic Mean Free Paths .27Consistency of Measured Inelastic Mean Free Paths.27Consistency of Calculated and Measured InelasticMean Free Paths.27Recommended Inelastic Mean Free Paths.28Uncertainties of Calculated and Measured InelasticMean Free Paths.28Uncertainties of Inelastic Mean Free Paths fromPredictive Formulae .29TPP-2M Equation of Tanuma, Powell, and Penn .29G-1 Equation of Gries.30VI. REFERENCES .31iv
APPENDIX A: PREDICTIVE FORMULAE FOR ELECTRON INELASTIC MEANFREE PATHS .32TPP-2M Equation of Tanuma, Powell, and Penn .32G-1 Equation of Gries .36Atomic Weight and Density Data .37APPENDIX B: EXAMPLE OF A FILE CONTAINING INELASTIC MEANFREE PATHS .40APPENDIX C: CONTACTS .42v
I. INTRODUCTIONThis database provides values of electron inelastic mean free paths (IMFPs) in solid elementsand compounds at selected electron energies between 50 eV and 10,000 eV (although most ofthe available data are for energies less than 2,000 eV).The database was designed mainly to provide IMFPs for applications in surface analysis byAuger-electron spectroscopy (AES) and X-ray photoelectron spectroscopy (XPS). For theseapplications, IMFPs are needed for quantitative surface analyses (to correct elemental sensitivityfactors for variations of IMFP with chemical state), for defining the surface sensitivity, and incalculations of the transport of signal electrons in solids. The IMFPs are also useful for definingthe surface sensitivity of other surface-characterization methods in which electron beams areemployed and for applications in which knowledge of the transport of low-energy electrons insolids is needed.In AES and XPS, a user often needs IMFP values at one or more specified electron energies orwishes to display IMFPs as a function of energy. The database can provide IMFP informationfrom up to three types of sources: calculated IMFPs from experimental optical data for a limitednumber of materials, IMFPs measured by elastic-peak electron spectroscopy (EPES) for someelemental solids, and IMFPs from predictive formulae for all materials. The calculated andmeasured IMFPs were generally reported in journal papers at specified electron energies, and itwas convenient to fit these IMFPs with appropriate functions so that IMFPs could be found byinterpolation for intermediate energies [1].A user of this database can obtain and display IMFP values for elements, inorganic compounds,and organic compounds at specified electron energies or energy ranges. For a selected materialin each class, the user can specify a source of IMFPs (calculations, measurements, or predictiveformulae) and then choose from a number of options for the IMFP units (nanometers,Ångstroms, or milligrams per square meter) and the type of display (linear, logarithmic, orlinear/logarithmic coordinates).The user can display the IMFP results graphically (that is, a plot of IMFP versus electronenergy), obtain an IMFP for a selected electron energy, obtain IMFPs for a number of specifiedenergies, and create an IMFP Table for regularly spaced electron energies. The IMFPs from thelatter two options can be stored in files for later processing (e.g., on-screen comparisons ofIMFPs from different sources for the same material or comparisons of IMFPs for differentmaterials), printing, or permanent storage. Finally, graphical displays can be saved in Windowsbitmap format for easy incorporation into other documents.NIST released version 1.0 of the Electron Inelastic-Mean-Free-Path Database (SRD 71) inSeptember, 1999. Version 1.0 was designed to operate under the DOS operating system. Version1.1 was designed to operate under the Windows 95, Windows 98, or Windows NT operatingsystems, and was released in December, 2000. The database screens were redesigned to makeuse of the database easier and more convenient. There were no changes or additions to the datain the database although there were some changes to the N v parameter values listed in Table A.1.IMFP 1
The installation program for Version 1.2 was changed so that it would operate on newer versionsof the Windows operating system; Version 1.2 was released in December, 2010. There were nochanges or additions to the data in the database although a new About box was added to the mainmenu. This box shows three references, a 1999 critical review [1] and two recent reviews [2,3]that discuss evaluations of the compiled data, methods of determination, and uncertainty.II. GETTING STARTEDPacket ContentCD-ROMUsers’ GuideAlternatively, the files on the CD-ROM and a PDF file with the Users’ Guide can bedownloaded from NIST (http://www.nist.gov/srd/surface.cfm).System Requirements1. Personal computer with Windows 95, Windows 98, Windows NT, Windows 2000, WindowsME, Windows XP, Windows Vista, or Windows 7 operating system2. CD-ROM drive3. Screen resolution: 1024 by 768 pixels.4. System font size: small fonts.5. Printer: Laser printer supporting the PCL 6 printer language.6. Hard disk space: 720 kilobytes minimum. Larger amounts of storage are required if numerousfiles are created with the database. It is suggested that 30 Megabytes be available, particularlyif graphic files are created.The database has been designed to operate optimally at the screen resolution given above.However, it can also be operated at a lower screen resolution, e.g., 640 by 480 pixels, or 800 by600 pixels. At higher resolutions, the database will operate correctly but there may be difficultyin reading text on the screen. For all resolutions, small system fonts must be selected.To change the screen resolution or the system font size, follow these steps:1. Double click the My Computer icon on the desktop.2. Click the Control panel icon.3. Double click the Display icon.4. Click on the Settings tab.5. Set a given resolution by moving the slider.To change the system font size, proceed as follows depending on the operating system in use:For Windows 95 or NT, select Small Fonts in the Font Size box.For Windows 98, click on the Advanced button, select the General tab, and then select theSmall Fonts option in the Display box.IMFP 2
For Windows XP, click on the Advanced button, and then select the Normal size (96 DPI)option in the Display box.For Windows Vista, click on Appearance and Personalization, Personalization, Adjust fontsize (DPI) in the left pane, and select Default scale (96 DPI).For Windows 7, click on Appearance and Personalization, Display, and select Small - 100 %(default option).Installation1. Insert the CD-ROM into the disk drive of the computer.2. Click the Start button on the task bar.3. Click the Run command.4. Type D:\SETUP (if D: is the drive letter for the disk drive) and click OK.5. Follow instructions on the screen.Alternatively, the following procedure can be used:1. Insert the disk into the disk drive of the computer.2. Double-click My Computer on the desktop.3. Double-click the icon corresponding to the disk drive.4. Double-click the Setup icon (showing the computer).5. Follow instructions on the screen.If files have been downloaded into a directory on the user’s personal computer, double-click theSetup icon (i.e., setup.exe).Should difficulty be encountered in installing the database as described above (e.g., due tosecurity settings on the computer), the database can be launched by double-clicking onIMFPWIN.exe located in the Program Files directory.By default, the database is installed in the directory C:\PROGRAM FILES\NIST\IMFPWIN.Furthermore, an IMFPWIN icon is created. This icon appears after clicking the Start button andchoosing Programs.Removal of the Database1. Double click My Computer on the desktop.2. Double click the Control panel icon.3. Double click the Add/Remove Programs icon.4. Select Install/Uninstall.5. In the list of programs, click Imfpwin.6. Click the button Add/Remove.IMFP 3
III. STRUCTURE OF THE PROGRAMMain MenuFigure 1. The title screen and main menu.The five options of the Main Menu are listed in the upper part of the title screen (Fig. 1), and thesubmenus corresponding to the first three options are shown in Figs. 2, 4 and 5.IMFP 4
The functions of the five main menu options are as follows:1. Database (Figure 2)Figure 2. First option of the main menu (Database)With this option, IMFPs can be obtained for elements, inorganic compounds, and organiccompounds. For each of these three classes of materials, submenus (Figs. 3(a)-(c)) enable theselection of data sources and the types of data to be obtained. These submenus are described inSection IV. Operation of the database can be terminated by choosing End the session.IMFP 5
Figure 3(a). Elements submenu for the Database menu of Figure 2.Figure 3(b). Inorganic Compounds submenu for the Database menu of Figure 2.IMFP 6
Figure 3(c). Organic compounds submenu for the Database menu of Figure 2.2. File Management (Figure 4)Figure 4. Second option of the main menu (File Management).This option allows the user to save files created in the present session to another directory forpermanent storage, to delete files from the database directory, to print files containing IMFPIMFP 7
data, to print figures showing displays of IMFP data as a function of electron energy, and to loadfiles containing IMFP data or figures that were created in earlier sessions and stored in anotherdirectory.3. Comparisons (Figure 5)Figure 5. Third option of the main menu (Comparisons).With this option, IMFP data for different materials and/or from different sources can begraphically compared.4. Disclaimer (Figure 6)The NIST disclaimer is stated.IMFP 8
Figure 6. NIST disclaimer.6. About box (Figure 7)The About box gives information on the release date of this version of the database, how thedatabase should be cited in publications, and references to evaluations of the compiled data,methods of determination, and uncertainties [1-3].Figure 7. The About box.IMFP 9
V. RUNNING THE DATABASE PROGRAMStarting the DatabaseThe database can be started by any of the following means:1. Click the Start button, choose Programs, and then the IMFPWIN icon.2. Click the Start button, choose Run, and type:C:\PROGRA 1\NIST\IMFPWIN\IMFPWIN,and then click OK.3. Double-click the My Computer icon on the desktop, select the C:\PROGRAMFILES\NIST\IMFPWIN directory, and double-click on the IMFPWIN icon.Database(First option of the main menu)Elements(First option of the Database option on the main menu)The user will initially select an element and a source of data (Figure 3(a)).The Periodic Table of the elements will then appear (Figure 8), and an element can be selectedby clicking on the button for the element of interest. A selection is indicated by a change of colorfrom black to red.An element can be deselected by clicking again on another button. After a selection has beenmade (Cu in the case shown in Figure 8), the OK button should be clicked. Clicking on theCancel button returns control to the opening screen and the main menu. Note that it is notpossible to select an element shown in bold letters.After an element has been selected, a screen will appear showing the IMFP data sourcesavailable for that element. For example, if copper (Cu) had been chosen, the screen shown inFigure 9 would be displayed.IMFP 10
Figure 8. Screen for selecting an element (here Cu).Figure 9. Sources of IMFP data for copper.One of the data sources should then be selected. If experimental IMFP values are desired (i.e.,IMFPs measured by elastic peak electron spectroscopy), an additional selection of a data sourceshould be made in the bottom box of the screen. Further information concerning the selection(s)(the reference, the electron energy range for the IMFP data, and how the IMFP data wereIMFP 11
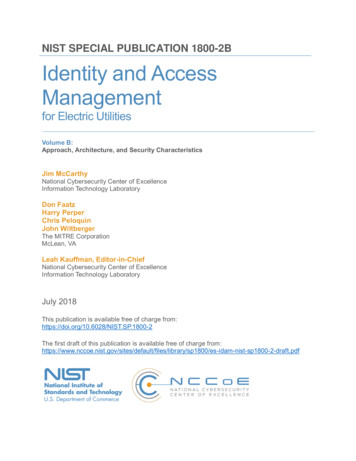
obtained) appears in the status box. The user should also select the preferred IMFP units(Ångstroms, nanometers, or milligrams per square meter) in the box in the upper right of thescreen (although units can be changed on later screens). The OK button should then be clicked.Four types of data sources have been utilized to provide the IMFPs in the database:1. IMFPs calculated from experimental optical data (for a group of elements and a smallnumber of compounds). An analytic function has been fitted to calculated IMFPs for aparticular material and data source to allow convenient interpolation [1,4].2. IMFPs measured by elastic-peak electron spectroscopy (EPES) and the use of either MonteCarlo calculations or analytical theory (for a group of elements). An analytic function hasbeen fitted to measured IMFPs for a particular material and data source to allow convenientinterpolation [1,4].3. IMFPs obtained from predictive formulae.4. Recommended IMFPs (only for Ni, Cu, Ag, and Au) [1].Further information on the sources of calculated, measured, and recommended IMFPs and theuncertainty of the IMFP data has been published elsewhere [1-4]. These references also containa description of the procedures used to fit IMFPs that were calculated or measured at specificenergies so that convenient interpolations can be made. The predictive formulae are described inAppendix A; for most applications, use of the TPP-2M equation of Tanuma et al. [5] isrecommended.For the example of Cu, seven separate data sources are shown in the screen of Figure 9. The firstfour of these are calculated IMFPs based on the work of the authors shown at the left of eachline. For IMFPs from the work of Tanuma, Powell, and Penn [6], IMFPs are provided based onspecific IMFP calculations for a selected element, if available, or otherwise from the predictiveIMFP formula TPP-2M proposed by these authors [5]. If this formula has been utilized,information to this effect will be given on the screen for that element.The following source in Figure 9 allows IMFPs to be calculated from the predictive IMFPequation (G-1 formula) of Gries [7].The next line on the screen of Figure 9 indicates that measured IMFPs are available for Cu fromEPES measurements and Monte Carlo calculations; selection of this line will lead to theappearance of six sources of data in the lowest box of Figure 8 from which the user should makea selection.The last line on the screen of Figure 9 indicates that recommended IMFP values [1] are availablefor copper. The following screen (Figure 10) shows a graphical plot of calculated IMFPs forcopper from Tanuma et al. [6] versus electron energy.IMFP 12
Figure 10. Graphical display of calculated IMFPs for copper (from Tanuma et al. [6]) as afunction of electron energy.The energy dependence of the cross section can be displayed in linear, semilogarithmic, orlogarithmic coordinate systems; these coordinates are chosen with the buttons in the upper-rightpart of the screen. The IMFP units can be changed by clicking the Change Units button at thebottom-right of the screen, and the line type can be changed by clicking the Line Type button atthe bottom of the screen. This plot provides a convenient means for showing the energydependence of the IMFP. If it is desired to store or print a graphical plot such as that shown inFigure 10, a file with the IMFP data should be created with the Table with IMFP values option tobe described shortly and then the Comparisons option of the main menu should be used toprepare a graphical display of the data in the file; this latter display can be printed and a file canbe created for transfer to other applications.An IMFP value for a particular energy can be found by clicking the cursor inside the plot at aposition close to the desired energy. The IMFP and the chosen energy appear in the upper-leftcorner of the screen. The selected energy can be changed by clicking on the Increase energy orDecrease energy buttons; these changes will occur in steps of 1 eV, 10 eV, or 100 eV dependingon the choice of button selected in the upper part of the screen. In this way, numerical IMFPvalues for particular electron energies of interest can be quickly found.There are two additional methods by which numerical IMFP values for a particular material canbe found and also stored. First, by clicking on the Multiple IMFPs button of the screen in Figure10, the user can obtain IMFPs for specified electron energies. As an example, Figure 11 showsthe screen that would appear if the silicon IMFP measurements of Gergely et al. [8] had beenselected earlier; these IMFPs are derived from an analytic function fitted to the IMFPmeasurements [1].IMFP 13
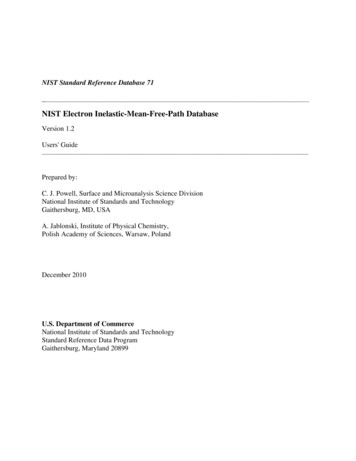
Figure 11. Example of multiple IMFP values from the measured IMFPs for silicon ofGergely et al. [8].A series of electron energies can be entered into the box on the lower-left of the screen and theAdd button clicked after each entry. These energies and the corresponding IMFPs will thenappear in the center box of the screen. Entries in this box can be removed by selecting therelevant line(s) and clicking the Delete button. Similarly, new entries can be inserted above aselected line using the Insert button. The status box in the upper-right of the screen indicates theenergy range of the original data; IMFPs can be obtained only for energies within this range. TheIMFP units can be changed by clicking on the Change units button. Finally, a file can be createdcontaining the indicated energies and IMFPs by entering a suitable file name in the box of theright-side of the screen and clicking the Create button. Such a file will be given the .MFPextension. A window will then appear on the screen indicating that the file has been successfullycreated; this window would show a diagnostic if, for example, an unsuitable file name had beenchosen. This option is a convenient means of storing IMFPs at user-specified electron energiesfor a selected material and data source.Second, a Table can be created containing IMFPs for regularly spaced electron energies withinthe energy range of the original data source. Figure 12 shows the screen that would appear if theTable with IMFPs button in Figure 10 had been clicked and if measured IMFPs for silicon fromGergely et al. [8] had been previously selected.IMFP 14
Figure 12. Table with IMFP values derived from the measured IMFPs for silicon ofGergely et al. [8].The number of IMFP values in the Table can be selected by the user in the box at the upper-rightof the screen; the default value is 401 (the maximum number). The user can also choose to havethe energy values in the Table distributed uniformly on either linear or logarithmic scales byselecting the appropriate button on the lower part of the screen. Clicking on the Create button inthe upper-right of the screen will then create the Table in the center of the screen. The IMFPunits can be changed as before by clicking on the Change units button. Finally, a file can becreated containing the Table of energies and IMFPs by entering a suitable file name and clickingon the Create button in the lower-right of the screen. Files of this type are given extensions of.ANG, .NAN, or .MGM depending on whether the IMFP units are Ångstroms, nanometers, ormilligrams per square meter, respectively. This option is a convenient means of storing IMFPdata for a selected material and data source over the energy range of the original data (shown atthe upper-right of the screen). This file can be later used to create a graphical display of theIMFP data (e.g., for comparisons, printing, or transfer to other applications).Clicking on the Close button in Figs. 11 and 12 will return the user to the main menu. It is thenpossible to go directly to screens for obtaining a single IMFP value (Figure 10), multiple IMFPvalues (Figure 11), or a Table with IMFP values (Figure 12) for the previously selected elementand data source using the submenu shown in Figure 3(a).Inorganic Compounds(Second option of the Database option on the main menu)The user can choose to obtain calculated IMFPs for a limited number of inorganic compounds orto derive IMFPs from predictive formulae (Figure 3(b)). If the first choice is made, the screen ofIMFP 15
Figure 13 appears in which four sources of calculated IMFPs are shown in the center part of thescreen.Figure 13. Screen to select source and compound to obtain calculated IMFPs for inorganiccompounds.If one of those sources is selected, the compounds for which calculated IMFPs are availableappear in the lower part of the screen. After a compound is selected (and, if desired, the IMFPunits changed using the box at the upper-right of the screen), the OK button is clicked and aseries of screens similar to Figs. 10, 11, and 12 will then appear depending on whether the userwishes to obtain an IMFP value for a single electron energy, multiple IMFP values, or a Table ofIMFP values as described for Elements in the previous section.If the second choice is made, a Periodic Table of the elements similar to Figure 8 appears (butnow the gaseous elements are not shown in bold). At least two elements should be selected byclicking on the appropriate boxes. After clicking the OK button, a screen similar to Figure 14appears.The name of the compound should be entered in the box in the upper-left of the screen. Thestoichiometry coefficients for each element in the compound should then be entered in the nextlower box.IMFP 16
Figure 14. Screen used to obtain IMFPs from predictive formulae for inorganic compounds.The user can choose to obtain IMFP values from the predictive TPP-2M equation of Tanuma etal. [5] or the predictive G-1 equation of Gries [7] using one of the buttons in the top-right of thescreen; these equations are described in Appendix A. If the TPP-2M equation is selected, valuesfor the density, number of valence electrons per molecule, and bandgap energy should be enteredinto the appropriate boxes; information on the latter two parameters is given in Appendix A. Ifthe G-1 equation is selected, only the density value should be entered. The IMFP units can bechanged, if desired, using the buttons on the right side of the screen. After clicking OK, screenssimilar to Figs. 10, 11, and 12 will appear. It is possible to go directly to the desired screens fromthe main menu after a data source and compound have been selected using the submenu optionsshown in Figure 3(b).Further information on the sources of calculated IMFPs for the inorganic compounds and on theiruncertainties has been published elsewhere [1-4].Organic Compounds(Third option of the Database option on the main menu)Similar choices are made to obtain IMFPs for organic compounds as described above forinorganic compounds, as in Figure 3(c). Figure 15 shows the screen that indicates sources ofcalculated IMFPs for organic compounds and, for the selected source, the compounds for whichIMFPs are available.IMFP 17
Figure 15. Screen to select source and compound to obtain calculated IMFPs for organiccompounds.File Management(Second option of the main menu)With this option, a user can save files created in the present session to another directory forpermanent storage, delete files from the database directory, print files containing IMFP data,print figures showing displays of IMFP data as a function of electron energy, and load filescontaining IMFP data or figures that were created in earlier sessions and stored in anotherdirect
NIST released version 1.0 of the Electron Inelastic-Mean-Free-Path Database (SRD 71) in September, 1999. Version 1.0 was designed to operate under the DOS operating system. Version 1.1 was designed to operate under the Windows 95, Windows 98, or Windows NT operating systems, and was released in December, 2000.